San Francisco, California Neighborhood Map - Income, House Prices, Occupations, Boundaries
Settings
X

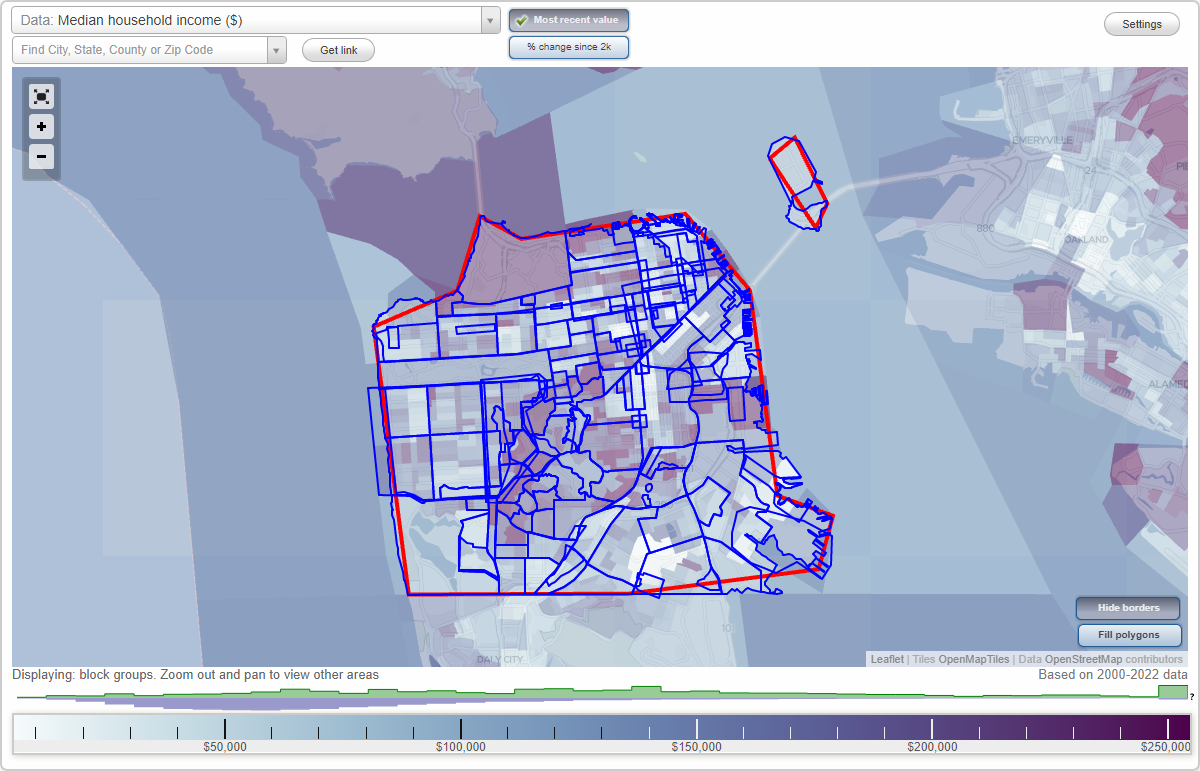
- City boundary
- Neighborhood boundaries
Business Search - 14 Million verified businesses
Neighborhoods:
Alamo Square, Anza Vista, Aquatic Park, Baja Noe, Balboa Park, Balboa Terrace, Bayview District, Bayview Heights, Bernal Heights, Bernal Heights North, Bernal Heights Park, Bernal Heights South, Buena Vista Park, Castro, Cathedral Hill, Cayuga Terrace, Central Richmond, Central Sunset, Chinatown, Civic Center, Clarendon Heights, Cole Valley, Corona Heights, Cow Hollow, Crocker-Amazon, Deco Ghetto, Diamond Heights, Dogpatch, Downtown, Duboce Triangle, Embarcadero, Excelsior, Financial District, Financial District South, Fisherman's Wharf, Forest Hill, Forest Knolls, Fort Mason, French Quarter, Ghirardelli Square, Glen Park, Golden Gate Heights, Golden Gate Park, Haight-Ashbury, Hayes Valley, Holly Park, Hunters Point, India Basin, Ingleside, Ingleside Heights, Ingleside Terrace, Inner Parkside, Inner Richmond, Inner Sunset, Inner Sunset, Inset, Intermission, Jackson Square, Japantown, Laguna Honda, Lake, Lake Shore, Lakeside, Laurel Heights, Laurel Village, Little Hollywood, Little Russia, Little Saigon, Lone Mountain, Lower Haight, Lower Nob Hill, Lower Pacific Heights, Marina District, Mastro, Merced Heights, Merced Manor, Midtown Terrace, Mint Hill, Miraloma Park, Mission Bay, Mission District, Mission Dolores, Mission Terrace, Monterey Heights, Mount Davidson Manor, NOMA, Nob Hill, Noe Valley, North Beach, North Panhandle, North Waterfront, Oceanview, Outer Mission, Outer Parkside, Outer Richmond, Outer Sunset, Outset, Pacific Heights, Park Merced, Parkside, Parnassus, Pier 39, Pine Lake Park, Polk Gulch, Portola, Potrero Flats, Potrero Hill, Presidio, Presidio Heights, Presidio Terrace, Richmond District, Rincon Hill, Russian Hill, SOMISSPO, Saint Francis Wood, Sea Cliff, Sherwood Forest, Showplace Square, Silver Terrace, South Basin, South Beach, South Of Market, South Park, St Marys Square, Stonestown, Sunnydale, Sunnyside, Sunset District, Sutro Heights, Telegraph Hill, Tenderloin, The Hub, Transmission, Treasure Island, Twin Peaks, Twin Peaks West, Union Square, Upper Market, Van Ness, Visitacion Valley, West Portal, West of Twin Peaks, Western Addition, Westwood Highlands, Westwood Park, Yerba Buena Island, Zion DistrictAlamo Square neighborhood in San Francisco statistics: (Find on map)
Area: 0.144 square miles
Population: 4,136
Population density:
Median household income in 2021:
Median rent in in 2021:
Male vs Females
Median age
Most popular occupations of males: management occupations (except farmers) (28.0%); computer and mathematical occupations (27.0%); business and financial operations occupations (9.6%); sales and office occupations (9.6%); service occupations (7.0%); education, training, and library occupations (4.5%); arts, design, entertainment, sports, and media occupations (3.1%)
Most popular occupations of females: management occupations (except farmers) (18.9%); business and financial operations occupations (14.6%); healthcare practitioners and technical occupations (13.3%); sales and office occupations (10.8%); education, training, and library occupations (10.5%); arts, design, entertainment, sports, and media occupations (8.8%); service occupations (8.7%)
Roads and streets: Hayes St; McAllister St; Fulton St; Fell St; Oak St; Steiner St; Scott St; Grove St; Divisadero St; Pierce St; Fillmore St.
Alamo Square neighborhood detailed profile
Area: 0.144 square miles
Population: 4,136
Population density:
| Alamo Square: | 28,800 people per square mile |
| San Francisco: | 17,458 people per square mile |
Median household income in 2021:
| Alamo Square: | $157,277 |
| San Francisco: | $121,826 |
Median rent in in 2021:
| Alamo Square: | $2,310 |
| San Francisco: | $2,001 |
Male vs Females
| Males: | 2,183 |
| Females: | 1,953 |
Median age
| Males: | 40.2 years |
| Females: | 37.6 years |
Most popular occupations of males: management occupations (except farmers) (28.0%); computer and mathematical occupations (27.0%); business and financial operations occupations (9.6%); sales and office occupations (9.6%); service occupations (7.0%); education, training, and library occupations (4.5%); arts, design, entertainment, sports, and media occupations (3.1%)
Most popular occupations of females: management occupations (except farmers) (18.9%); business and financial operations occupations (14.6%); healthcare practitioners and technical occupations (13.3%); sales and office occupations (10.8%); education, training, and library occupations (10.5%); arts, design, entertainment, sports, and media occupations (8.8%); service occupations (8.7%)
Roads and streets: Hayes St; McAllister St; Fulton St; Fell St; Oak St; Steiner St; Scott St; Grove St; Divisadero St; Pierce St; Fillmore St.
Alamo Square neighborhood detailed profile
Anza Vista neighborhood in San Francisco statistics: (Find on map)
Area: 0.124 square miles
Population: 2,452
Population density:
Median household income in 2021:
Median rent in in 2021:
Male vs Females
Median age
Most popular occupations of males: computer and mathematical occupations (52.2%); management occupations (except farmers) (28.7%); arts, design, entertainment, sports, and media occupations (26.1%); sales and office occupations (25.5%); business and financial operations occupations (19.1%); construction, extraction, and maintenance occupations (15.1%); transportation occupations (12.2%)
Most popular occupations of females: management occupations (except farmers) (87.4%); business and financial operations occupations (40.4%); healthcare practitioners and technical occupations (24.6%); sales and office occupations (20.2%); education, training, and library occupations (16.2%); life, physical, and social science occupations (15.2%); arts, design, entertainment, sports, and media occupations (9.6%)
Roads and streets: Geary Blvd; Ofarrell St; Anzavista Ave; Masonic Ave; Terra Vista Ave; St Josephs Ave; Broderick St; Encanto Ave; Fortuna Ave; Baker St; Barcelona Ave; Lyon St; Vega St; Pinar Ln; Eddy St; Ellis St; Sonora Ln; Presidio Ave.
Anza Vista neighborhood detailed profile
Area: 0.124 square miles
Population: 2,452
Population density:
| Anza Vista: | 19,736 people per square mile |
| San Francisco: | 17,458 people per square mile |
Median household income in 2021:
| Anza Vista: | $20,073 |
| San Francisco: | $121,826 |
Median rent in in 2021:
| Anza Vista: | $1,686 |
| San Francisco: | $2,001 |
Male vs Females
| Males: | 997 |
| Females: | 1,454 |
Median age
| Males: | 60.5 years |
| Females: | 82.5 years |
Most popular occupations of males: computer and mathematical occupations (52.2%); management occupations (except farmers) (28.7%); arts, design, entertainment, sports, and media occupations (26.1%); sales and office occupations (25.5%); business and financial operations occupations (19.1%); construction, extraction, and maintenance occupations (15.1%); transportation occupations (12.2%)
Most popular occupations of females: management occupations (except farmers) (87.4%); business and financial operations occupations (40.4%); healthcare practitioners and technical occupations (24.6%); sales and office occupations (20.2%); education, training, and library occupations (16.2%); life, physical, and social science occupations (15.2%); arts, design, entertainment, sports, and media occupations (9.6%)
Roads and streets: Geary Blvd; Ofarrell St; Anzavista Ave; Masonic Ave; Terra Vista Ave; St Josephs Ave; Broderick St; Encanto Ave; Fortuna Ave; Baker St; Barcelona Ave; Lyon St; Vega St; Pinar Ln; Eddy St; Ellis St; Sonora Ln; Presidio Ave.
Anza Vista neighborhood detailed profile
Aquatic Park neighborhood in San Francisco statistics: (Find on map)
Area: 0.037 square miles
Roads and streets: Beach St; Hyde St; Jefferson St; Tonquin St; Polk St; Van Ness Ave.
Aquatic Park neighborhood detailed profile
Area: 0.037 square miles
Roads and streets: Beach St; Hyde St; Jefferson St; Tonquin St; Polk St; Van Ness Ave.
Aquatic Park neighborhood detailed profile
Baja Noe neighborhood in San Francisco statistics: (Find on map)
Area: 0.055 square miles
Population: 2,590
Population density:
Median household income in 2021:
Median rent in in 2021:
Male vs Females
Median age
Housing prices:
Average estimated value of detached houses in 2021 (21.9% of all units):
Average estimated value of townhouses or other attached units in 2021 (6.7% of all units):
Average estimated value of housing units in 2-unit structures in 2021 (18.6% of all units):
Average estimated '21 value of housing units in 3-to-4-unit structures (39.0% of all units):
Average estimated '21 value of housing units in 5-or-more-unit structures (1.8% of all units):
Most popular occupations of males: management occupations (except farmers) (23.3%); service occupations (12.0%); healthcare practitioners and technical occupations (11.6%); business and financial operations occupations (11.4%); arts, design, entertainment, sports, and media occupations (9.3%); sales and office occupations (6.0%); education, training, and library occupations (5.8%)
Most popular occupations of females: business and financial operations occupations (26.5%); healthcare practitioners and technical occupations (18.2%); arts, design, entertainment, sports, and media occupations (17.2%); sales and office occupations (13.2%); management occupations (except farmers) (10.8%); education, training, and library occupations (9.7%); service occupations (3.1%)
Roads and streets: Guerrero St; 22nd St; Valencia St; 23rd St; Hill St; San Jose Ave; Ames St; Fair Oaks St; Quane St; Alvarado St; 21st St.
Baja Noe neighborhood detailed profile
Area: 0.055 square miles
Population: 2,590
Population density:
| Baja Noe (Mission Deluxe): | 46,957 people per square mile |
| San Francisco: | 17,458 people per square mile |
Median household income in 2021:
| Baja Noe (Mission Deluxe): | $173,136 |
| San Francisco: | $121,826 |
Median rent in in 2021:
| Baja Noe (Mission Deluxe): | $1,837 |
| San Francisco: | $2,001 |
Male vs Females
| Males: | 1,188 |
| Females: | 1,402 |
Median age
| Males: | 41.6 years |
| Females: | 38.0 years |
Housing prices:
Average estimated value of detached houses in 2021 (21.9% of all units):
| Baja Noe (Mission Deluxe): | $5,050,000 |
| San Francisco: | $1,815,784 |
Average estimated value of townhouses or other attached units in 2021 (6.7% of all units):
| This neighborhood: | $662,090 |
| city: | $1,506,493 |
Average estimated value of housing units in 2-unit structures in 2021 (18.6% of all units):
| This neighborhood: | $1,247,458 |
| San Francisco: | $1,685,431 |
Average estimated '21 value of housing units in 3-to-4-unit structures (39.0% of all units):
| Baja Noe (Mission Deluxe): | $2,678,736 |
| city: | $1,521,789 |
Average estimated '21 value of housing units in 5-or-more-unit structures (1.8% of all units):
| Baja Noe (Mission Deluxe): | $939,348 |
| San Francisco: | $1,317,001 |
Most popular occupations of males: management occupations (except farmers) (23.3%); service occupations (12.0%); healthcare practitioners and technical occupations (11.6%); business and financial operations occupations (11.4%); arts, design, entertainment, sports, and media occupations (9.3%); sales and office occupations (6.0%); education, training, and library occupations (5.8%)
Most popular occupations of females: business and financial operations occupations (26.5%); healthcare practitioners and technical occupations (18.2%); arts, design, entertainment, sports, and media occupations (17.2%); sales and office occupations (13.2%); management occupations (except farmers) (10.8%); education, training, and library occupations (9.7%); service occupations (3.1%)
Roads and streets: Guerrero St; 22nd St; Valencia St; 23rd St; Hill St; San Jose Ave; Ames St; Fair Oaks St; Quane St; Alvarado St; 21st St.
Baja Noe neighborhood detailed profile
Balboa Park neighborhood in San Francisco statistics: (Find on map)
Area: 0.048 square miles
Population: 796
Population density:
Median household income in 2021:
Median rent in in 2021:
Male vs Females
Median age
Most popular occupations of males: service occupations (29.5%); sales and office occupations (16.2%); management occupations (except farmers) (9.5%); construction, extraction, and maintenance occupations (9.0%); community and social services occupations (6.7%); production occupations (6.3%); transportation occupations (5.4%)
Most popular occupations of females: service occupations (35.6%); sales and office occupations (29.4%); community and social services occupations (12.4%); business and financial operations occupations (11.0%); management occupations (except farmers) (5.3%); education, training, and library occupations (2.1%); healthcare practitioners and technical occupations (2.1%)
Roads and streets: San Jose Ave; Sergeant John V Young St; Sgt John V Young Ln; Arco Way.
Balboa Park neighborhood detailed profile
Area: 0.048 square miles
Population: 796
Population density:
| Balboa Park: | 16,554 people per square mile |
| San Francisco: | 17,458 people per square mile |
Median household income in 2021:
| Balboa Park: | $105,952 |
| San Francisco: | $121,826 |
Median rent in in 2021:
| Balboa Park: | $1,233 |
| San Francisco: | $2,001 |
Male vs Females
| Males: | 378 |
| Females: | 417 |
Median age
| Males: | 43.9 years |
| Females: | 50.3 years |
Most popular occupations of males: service occupations (29.5%); sales and office occupations (16.2%); management occupations (except farmers) (9.5%); construction, extraction, and maintenance occupations (9.0%); community and social services occupations (6.7%); production occupations (6.3%); transportation occupations (5.4%)
Most popular occupations of females: service occupations (35.6%); sales and office occupations (29.4%); community and social services occupations (12.4%); business and financial operations occupations (11.0%); management occupations (except farmers) (5.3%); education, training, and library occupations (2.1%); healthcare practitioners and technical occupations (2.1%)
Roads and streets: San Jose Ave; Sergeant John V Young St; Sgt John V Young Ln; Arco Way.
Balboa Park neighborhood detailed profile
Balboa Terrace neighborhood in San Francisco statistics: (Find on map)
Area: 0.092 square miles
Population: 951
Population density:
Median household income in 2021:
Median rent in in 2021:
Male vs Females
Median age
Average estimated value of detached houses in 2021 (94.5% of all units):
Most popular occupations of males: sales and office occupations (21.0%); management occupations (except farmers) (19.2%); legal occupations (12.2%); community and social services occupations (11.3%); construction, extraction, and maintenance occupations (10.6%); business and financial operations occupations (10.1%); service occupations (8.9%)
Most popular occupations of females: sales and office occupations (34.3%); business and financial operations occupations (16.8%); healthcare practitioners and technical occupations (10.2%); management occupations (except farmers) (9.3%); service occupations (8.9%); education, training, and library occupations (7.3%); arts, design, entertainment, sports, and media occupations (5.7%)
Roads and streets: Ocean Ave; Darien Way; San Benito Way; Upland Dr; Santa Ana Ave; Junipero Serra Blvd; San Leandro Way; Aptos Ave; San Fernando Way; San Aleso Ave; Westgate Dr.
Balboa Terrace neighborhood detailed profile
Area: 0.092 square miles
Population: 951
Population density:
| Balboa Terrace: | 10,305 people per square mile |
| San Francisco: | 17,458 people per square mile |
Median household income in 2021:
| Balboa Terrace: | $195,249 |
| San Francisco: | $121,826 |
Median rent in in 2021:
| Balboa Terrace: | $3,501 |
| San Francisco: | $2,001 |
Male vs Females
| Males: | 409 |
| Females: | 542 |
Median age
| Males: | 56.1 years |
| Females: | 55.5 years |
Average estimated value of detached houses in 2021 (94.5% of all units):
| Balboa Terrace: | $1,610,146 |
| San Francisco: | $1,815,784 |
Most popular occupations of males: sales and office occupations (21.0%); management occupations (except farmers) (19.2%); legal occupations (12.2%); community and social services occupations (11.3%); construction, extraction, and maintenance occupations (10.6%); business and financial operations occupations (10.1%); service occupations (8.9%)
Most popular occupations of females: sales and office occupations (34.3%); business and financial operations occupations (16.8%); healthcare practitioners and technical occupations (10.2%); management occupations (except farmers) (9.3%); service occupations (8.9%); education, training, and library occupations (7.3%); arts, design, entertainment, sports, and media occupations (5.7%)
Roads and streets: Ocean Ave; Darien Way; San Benito Way; Upland Dr; Santa Ana Ave; Junipero Serra Blvd; San Leandro Way; Aptos Ave; San Fernando Way; San Aleso Ave; Westgate Dr.
Balboa Terrace neighborhood detailed profile
Bayview District neighborhood in San Francisco statistics: (Find on map)
Area: 2.057 square miles
Population: 23,979
Population density:
Median household income in 2021:
Median rent in in 2021:
Male vs Females
Median age
Housing prices:
Average estimated value of detached houses in 2021 (48.8% of all units):
Average estimated value of townhouses or other attached units in 2021 (23.8% of all units):
Most popular occupations of males: service occupations (24.1%); management occupations (except farmers) (14.7%); sales and office occupations (14.0%); construction, extraction, and maintenance occupations (8.0%); transportation occupations (7.4%); production occupations (5.8%); arts, design, entertainment, sports, and media occupations (5.1%)
Most popular occupations of females: service occupations (28.5%); sales and office occupations (22.7%); management occupations (except farmers) (11.3%); business and financial operations occupations (9.1%); education, training, and library occupations (6.6%); production occupations (4.6%); healthcare practitioners and technical occupations (3.3%)
Limited-access highways (interstate or state) in this neighborhood: I- 280; US Hwy 101 (James Lick Fwy).
Roads and streets: 3rd St; Bay Shore Blvd; Jerrold Ave; Newcomb Ave; Palou Ave; Quesada Ave; la Salle Ave; Ingalls St; Hudson Ave; Shafter Ave; Revere Ave; McKinnon Ave; Industrial St; Oakdale Ave; Thomas Ave; Egbert Ave; Armstrong Ave; Fitzgerald Ave; Underwood Ave; Carroll Ave; Van Dyke Ave; Kirkwood Ave; Jennings St; Innes Ave; Yosemite Ave; Bancroft Ave; Keith St; Hawes St; Lane St; Griffith St; Evans Ave; Mendell St; Wallace Ave; Cashmere St; Selby St; Napoleon St; Newhall St; Quint St; Fitch St (Arelious Walker Dr); Toland St; Phelps St; Barneveld Ave; Marin St; Rankin St; Davidson Ave; Loomis St; Whitney Young Cir; Donner Ave; Cameron Way; Dedman Ct; Helena St; Apparel Way; Bayview St; Dorman Ave; Galvez Ave; Orsi Cir; Hilton St; Nichols Way; Boutwell St; Garlington Ct; Crisp Rd; Upton St; Kalmanovitz; Hawkins Ln; Osceola Ln; Thornton Ave; Charter Oak Ave; Alemany Blvd; Williams Ave; Custer Ave; Garnett Ter; Elmira St; Beatrice Ln; Lydia Ave; Rosie Lee Ln; Flora St; Pomona St; Latona St; Bitting Ave; Patterson St; Lucy St; Ceres St; Milton I Ross Ln; Waterloo St; Las Villas Ct; Dukes Ct; Marengo St; Hillview Ct; Commer Ct; Flower St; Lillian Ct; George Ct; Lindsay Cir; Cortland Ave; Espanola St; San Bruno Ave; Progress St; Cosgrove St; Donahue St; Earl St; Lettuce Ln; Willie B Kennedy Dr; Doublerock St; Costa St; Faith St; Jakey Ct; Youngs Ct; Kansas St; Whitfield Ct; Mabrey Ct; Wayland St; Carpenter Ct; Bell Ct; Matthew Ct; Eve St.
Railroad features: Union Pacific RR.
Bayview District neighborhood detailed profile
Area: 2.057 square miles
Population: 23,979
Population density:
| Bayview District: | 11,657 people per square mile |
| San Francisco: | 17,458 people per square mile |
Median household income in 2021:
| Bayview District: | $80,201 |
| San Francisco: | $121,826 |
Median rent in in 2021:
| Bayview District: | $1,433 |
| San Francisco: | $2,001 |
Male vs Females
| Males: | 11,927 |
| Females: | 12,051 |
Median age
| Males: | 38.6 years |
| Females: | 41.5 years |
Housing prices:
Average estimated value of detached houses in 2021 (48.8% of all units):
| Bayview District: | $951,549 |
| San Francisco: | $1,815,784 |
Average estimated value of townhouses or other attached units in 2021 (23.8% of all units):
| This neighborhood: | $1,235,322 |
| city: | $1,506,493 |
Most popular occupations of males: service occupations (24.1%); management occupations (except farmers) (14.7%); sales and office occupations (14.0%); construction, extraction, and maintenance occupations (8.0%); transportation occupations (7.4%); production occupations (5.8%); arts, design, entertainment, sports, and media occupations (5.1%)
Most popular occupations of females: service occupations (28.5%); sales and office occupations (22.7%); management occupations (except farmers) (11.3%); business and financial operations occupations (9.1%); education, training, and library occupations (6.6%); production occupations (4.6%); healthcare practitioners and technical occupations (3.3%)
Limited-access highways (interstate or state) in this neighborhood: I- 280; US Hwy 101 (James Lick Fwy).
Roads and streets: 3rd St; Bay Shore Blvd; Jerrold Ave; Newcomb Ave; Palou Ave; Quesada Ave; la Salle Ave; Ingalls St; Hudson Ave; Shafter Ave; Revere Ave; McKinnon Ave; Industrial St; Oakdale Ave; Thomas Ave; Egbert Ave; Armstrong Ave; Fitzgerald Ave; Underwood Ave; Carroll Ave; Van Dyke Ave; Kirkwood Ave; Jennings St; Innes Ave; Yosemite Ave; Bancroft Ave; Keith St; Hawes St; Lane St; Griffith St; Evans Ave; Mendell St; Wallace Ave; Cashmere St; Selby St; Napoleon St; Newhall St; Quint St; Fitch St (Arelious Walker Dr); Toland St; Phelps St; Barneveld Ave; Marin St; Rankin St; Davidson Ave; Loomis St; Whitney Young Cir; Donner Ave; Cameron Way; Dedman Ct; Helena St; Apparel Way; Bayview St; Dorman Ave; Galvez Ave; Orsi Cir; Hilton St; Nichols Way; Boutwell St; Garlington Ct; Crisp Rd; Upton St; Kalmanovitz; Hawkins Ln; Osceola Ln; Thornton Ave; Charter Oak Ave; Alemany Blvd; Williams Ave; Custer Ave; Garnett Ter; Elmira St; Beatrice Ln; Lydia Ave; Rosie Lee Ln; Flora St; Pomona St; Latona St; Bitting Ave; Patterson St; Lucy St; Ceres St; Milton I Ross Ln; Waterloo St; Las Villas Ct; Dukes Ct; Marengo St; Hillview Ct; Commer Ct; Flower St; Lillian Ct; George Ct; Lindsay Cir; Cortland Ave; Espanola St; San Bruno Ave; Progress St; Cosgrove St; Donahue St; Earl St; Lettuce Ln; Willie B Kennedy Dr; Doublerock St; Costa St; Faith St; Jakey Ct; Youngs Ct; Kansas St; Whitfield Ct; Mabrey Ct; Wayland St; Carpenter Ct; Bell Ct; Matthew Ct; Eve St.
Railroad features: Union Pacific RR.
Bayview District neighborhood detailed profile
Bayview Heights neighborhood in San Francisco statistics: (Find on map)
Area: 0.639 square miles
Population: 2,887
Population density:
Median household income in 2021:
Median rent in in 2021:
Male vs Females
Median age
Housing prices:
Average estimated value of detached houses in 2021 (46.4% of all units):
Average estimated value of townhouses or other attached units in 2021 (21.6% of all units):
Average estimated value of housing units in 2-unit structures in 2021 (7.2% of all units):
Most popular occupations of males: sales and office occupations (22.0%); service occupations (18.1%); computer and mathematical occupations (13.2%); management occupations (except farmers) (9.2%); transportation occupations (6.8%); construction, extraction, and maintenance occupations (6.2%); material moving occupations (6.2%)
Most popular occupations of females: service occupations (41.4%); sales and office occupations (23.4%); healthcare practitioners and technical occupations (8.5%); transportation occupations (5.7%); material moving occupations (4.9%); legal occupations (4.4%); education, training, and library occupations (3.9%)
Limited-access highways (interstate or state) in this neighborhood: US Hwy 101 (James Lick Fwy).
Roads and streets: Jamestown Ave; Bayview Park Rd; Gilman Ave; Bay Shore Blvd; Executive Park Blvd; 3rd St; Key Ave; Ingerson Ave; Giants Dr (3 Com Park); Harney Way; Hollister Ave; Hunters Point Expy; Le Conte Ave; Paul Ave; Jennings St; Meade Ave; Thomas Mellon Cir; Salinas Ave; Keith St; Ingalls St; Hawes St; Alana Way; Jennings Ct; Crane St; Exeter St; Gould St; Carr St; Gilroy St; Ignacio Ave; Wheat St; Griffith St; Redondo St; Coronado St; Blanken Ave; Nelson Ave; Lane St; Olney Ave.
Railroad features: Union Pacific RR.
Bayview Heights neighborhood detailed profile
Area: 0.639 square miles
Population: 2,887
Population density:
| Bayview Heights: | 4,516 people per square mile |
| San Francisco: | 17,458 people per square mile |
Median household income in 2021:
| Bayview Heights: | $67,155 |
| San Francisco: | $121,826 |
Median rent in in 2021:
| Bayview Heights: | $1,408 |
| San Francisco: | $2,001 |
Male vs Females
| Males: | 1,396 |
| Females: | 1,490 |
Median age
| Males: | 36.5 years |
| Females: | 40.9 years |
Housing prices:
Average estimated value of detached houses in 2021 (46.4% of all units):
| Bayview Heights: | $623,778 |
| San Francisco: | $1,815,784 |
Average estimated value of townhouses or other attached units in 2021 (21.6% of all units):
| This neighborhood: | $845,972 |
| city: | $1,506,493 |
Average estimated value of housing units in 2-unit structures in 2021 (7.2% of all units):
| This neighborhood: | $646,124 |
| San Francisco: | $1,685,431 |
Most popular occupations of males: sales and office occupations (22.0%); service occupations (18.1%); computer and mathematical occupations (13.2%); management occupations (except farmers) (9.2%); transportation occupations (6.8%); construction, extraction, and maintenance occupations (6.2%); material moving occupations (6.2%)
Most popular occupations of females: service occupations (41.4%); sales and office occupations (23.4%); healthcare practitioners and technical occupations (8.5%); transportation occupations (5.7%); material moving occupations (4.9%); legal occupations (4.4%); education, training, and library occupations (3.9%)
Limited-access highways (interstate or state) in this neighborhood: US Hwy 101 (James Lick Fwy).
Roads and streets: Jamestown Ave; Bayview Park Rd; Gilman Ave; Bay Shore Blvd; Executive Park Blvd; 3rd St; Key Ave; Ingerson Ave; Giants Dr (3 Com Park); Harney Way; Hollister Ave; Hunters Point Expy; Le Conte Ave; Paul Ave; Jennings St; Meade Ave; Thomas Mellon Cir; Salinas Ave; Keith St; Ingalls St; Hawes St; Alana Way; Jennings Ct; Crane St; Exeter St; Gould St; Carr St; Gilroy St; Ignacio Ave; Wheat St; Griffith St; Redondo St; Coronado St; Blanken Ave; Nelson Ave; Lane St; Olney Ave.
Railroad features: Union Pacific RR.
Bayview Heights neighborhood detailed profile
Bernal Heights neighborhood in San Francisco statistics: (Find on map)
Area: 1.049 square miles
Population: 24,919
Population density:
Median household income in 2021:
Median rent in in 2021:
Male vs Females
Median age
Housing prices:
Average estimated value of detached houses in 2021 (43.0% of all units):
Average estimated value of townhouses or other attached units in 2021 (15.5% of all units):
Average estimated value of housing units in 2-unit structures in 2021 (19.0% of all units):
Average estimated '21 value of housing units in 3-to-4-unit structures (14.9% of all units):
Average estimated '21 value of housing units in 5-or-more-unit structures (3.5% of all units):
Most popular occupations of males: management occupations (except farmers) (18.1%); sales and office occupations (13.8%); service occupations (12.6%); construction, extraction, and maintenance occupations (8.7%); computer and mathematical occupations (7.9%); business and financial operations occupations (7.7%); arts, design, entertainment, sports, and media occupations (7.3%)
Most popular occupations of females: management occupations (except farmers) (17.4%); sales and office occupations (17.0%); service occupations (14.7%); business and financial operations occupations (13.6%); healthcare practitioners and technical occupations (7.3%); arts, design, entertainment, sports, and media occupations (7.2%); education, training, and library occupations (6.5%)
Limited-access highways (interstate or state) in this neighborhood: I- 280; US Hwy 101 (James Lick Fwy).
Roads and streets: Alemany Blvd; Mission St; Peralta Ave; Bernal Hts Blvd; Cortland Ave; Crescent Ave; Precita Ave; Folsom St; Ellsworth St; Holladay Ave; College Ave; Eugenia Ave; Benton Ave; Powhattan Ave; Gates St; Moultrie St; Anderson St; Andover St; Elsie St; Justin Dr; Banks St; Prentiss St; Jarboe Ave; Richland Ave; Nevada St; Tompkins Ave; Bradford St; Mullen Ave; Park St; Prospect Ave; Ogden Ave; Holly Park Cir; Winfield St; Coleridge St; Franconia St; Bosworth St; Esmeralda Ave; Montcalm St; Murray St; Ripley St; Highland Ave; Bonview St; Rutledge St; Putnam St; Bocana St; Coso Ave; Alabama St; Bronte St; Virginia Ave; Lundys Ln; Santa Marina St; Bennington St; Brewster St; Appleton Ave; Genebern Way; Chapman St; Mayflower St; Mirabel Ave; Montezuma St; Harrison St; Manchester St; Leese St; Ellert St; Wool St; San Bruno Ave; Newman St; Stoneman St; Calvert Dr; Shotwell St; Treat Ave; Kingston St; Gladys St; York St; St Marys Ave; Adam St; Fair Ave; Hunter St; Bache St; Porter St; Roscoe St; Bessie St; Costa St; Dickinson St; Marsilly St; Aztec St; Nebraska St; Cuvier St; Faith St; Barneveld Ave; Case St; Norwich St; Carver St; Bay Shore Blvd; Mojave St; Milton St; Godeus St; Saul St; Powers Ave; Florida St; Agnon Ave; Patton St; Samoset St; Massasoit St; College Ter; Rousseau St; Heyman Ave; Arnold Ave; Waltham St; Joy St; Mirando St (Mirando Way); Mirando Way; Rotteck St; Wright St; Eve St; Rosenkranz St; Macedonia St; Peters Ave; Lyell St; Weldon St; Perasto Ave; Islais St; Danton St; Oakdale Ave; Emmet Ct (Emmett Ct); Lamartine St; Badger St; Cayuga Ave.
Bernal Heights neighborhood detailed profile
Area: 1.049 square miles
Population: 24,919
Population density:
| Bernal Heights: | 23,754 people per square mile |
| San Francisco: | 17,458 people per square mile |
Median household income in 2021:
| Bernal Heights: | $147,373 |
| San Francisco: | $121,826 |
Median rent in in 2021:
| Bernal Heights: | $2,024 |
| San Francisco: | $2,001 |
Male vs Females
| Males: | 13,144 |
| Females: | 11,775 |
Median age
| Males: | 41.1 years |
| Females: | 40.7 years |
Housing prices:
Average estimated value of detached houses in 2021 (43.0% of all units):
| Bernal Heights: | $1,705,619 |
| San Francisco: | $1,815,784 |
Average estimated value of townhouses or other attached units in 2021 (15.5% of all units):
| This neighborhood: | $1,342,325 |
| city: | $1,506,493 |
Average estimated value of housing units in 2-unit structures in 2021 (19.0% of all units):
| This neighborhood: | $4,027,716 |
| San Francisco: | $1,685,431 |
Average estimated '21 value of housing units in 3-to-4-unit structures (14.9% of all units):
| Bernal Heights: | $1,140,270 |
| city: | $1,521,789 |
Average estimated '21 value of housing units in 5-or-more-unit structures (3.5% of all units):
| Bernal Heights: | $796,479 |
| San Francisco: | $1,317,001 |
Most popular occupations of males: management occupations (except farmers) (18.1%); sales and office occupations (13.8%); service occupations (12.6%); construction, extraction, and maintenance occupations (8.7%); computer and mathematical occupations (7.9%); business and financial operations occupations (7.7%); arts, design, entertainment, sports, and media occupations (7.3%)
Most popular occupations of females: management occupations (except farmers) (17.4%); sales and office occupations (17.0%); service occupations (14.7%); business and financial operations occupations (13.6%); healthcare practitioners and technical occupations (7.3%); arts, design, entertainment, sports, and media occupations (7.2%); education, training, and library occupations (6.5%)
Limited-access highways (interstate or state) in this neighborhood: I- 280; US Hwy 101 (James Lick Fwy).
Roads and streets: Alemany Blvd; Mission St; Peralta Ave; Bernal Hts Blvd; Cortland Ave; Crescent Ave; Precita Ave; Folsom St; Ellsworth St; Holladay Ave; College Ave; Eugenia Ave; Benton Ave; Powhattan Ave; Gates St; Moultrie St; Anderson St; Andover St; Elsie St; Justin Dr; Banks St; Prentiss St; Jarboe Ave; Richland Ave; Nevada St; Tompkins Ave; Bradford St; Mullen Ave; Park St; Prospect Ave; Ogden Ave; Holly Park Cir; Winfield St; Coleridge St; Franconia St; Bosworth St; Esmeralda Ave; Montcalm St; Murray St; Ripley St; Highland Ave; Bonview St; Rutledge St; Putnam St; Bocana St; Coso Ave; Alabama St; Bronte St; Virginia Ave; Lundys Ln; Santa Marina St; Bennington St; Brewster St; Appleton Ave; Genebern Way; Chapman St; Mayflower St; Mirabel Ave; Montezuma St; Harrison St; Manchester St; Leese St; Ellert St; Wool St; San Bruno Ave; Newman St; Stoneman St; Calvert Dr; Shotwell St; Treat Ave; Kingston St; Gladys St; York St; St Marys Ave; Adam St; Fair Ave; Hunter St; Bache St; Porter St; Roscoe St; Bessie St; Costa St; Dickinson St; Marsilly St; Aztec St; Nebraska St; Cuvier St; Faith St; Barneveld Ave; Case St; Norwich St; Carver St; Bay Shore Blvd; Mojave St; Milton St; Godeus St; Saul St; Powers Ave; Florida St; Agnon Ave; Patton St; Samoset St; Massasoit St; College Ter; Rousseau St; Heyman Ave; Arnold Ave; Waltham St; Joy St; Mirando St (Mirando Way); Mirando Way; Rotteck St; Wright St; Eve St; Rosenkranz St; Macedonia St; Peters Ave; Lyell St; Weldon St; Perasto Ave; Islais St; Danton St; Oakdale Ave; Emmet Ct (Emmett Ct); Lamartine St; Badger St; Cayuga Ave.
Bernal Heights neighborhood detailed profile
Bernal Heights North neighborhood in San Francisco statistics: (Find on map)
Area: 0.374 square miles
Population: 8,584
Population density:
Median household income in 2021:
Median rent in in 2021:
Male vs Females
Median age
Housing prices:
Average estimated value of detached houses in 2021 (34.3% of all units):
Average estimated value of townhouses or other attached units in 2021 (13.8% of all units):
Average estimated value of housing units in 2-unit structures in 2021 (26.8% of all units):
Average estimated '21 value of housing units in 3-to-4-unit structures (16.9% of all units):
Average estimated '21 value of housing units in 5-or-more-unit structures (4.5% of all units):
Most popular occupations of males: management occupations (except farmers) (16.6%); service occupations (11.5%); sales and office occupations (10.8%); computer and mathematical occupations (9.3%); business and financial operations occupations (9.1%); construction, extraction, and maintenance occupations (8.9%); arts, design, entertainment, sports, and media occupations (8.6%)
Most popular occupations of females: management occupations (except farmers) (19.1%); sales and office occupations (16.7%); business and financial operations occupations (15.7%); service occupations (12.1%); healthcare practitioners and technical occupations (7.3%); education, training, and library occupations (7.1%); arts, design, entertainment, sports, and media occupations (6.9%)
Limited-access highways (interstate or state) in this neighborhood: US Hwy 101 (James Lick Fwy).
Roads and streets: Precita Ave; Peralta Ave; Bernal Hts Blvd; Mullen Ave; Holladay Ave; Esmeralda Ave; Mission St; Montcalm St; Prospect Ave; Coleridge St; Ripley St; Winfield St; Elsie St; Folsom St; Rutledge St; Franconia St; Coso Ave; Alabama St; Eugenia Ave; Virginia Ave; Lundys Ln; Brewster St; Bonview St; Mirabel Ave; Montezuma St; Harrison St; Manchester St; Stoneman St; Shotwell St; Treat Ave; Kingston St; York St; Adam St; Fair Ave; Bessie St; Aztec St; Costa St; Norwich St; Faith St; Bay Shore Blvd; Godeus St; Powers Ave; Florida St; Samoset St; Massasoit St; Heyman Ave; Waltham St; Joy St; Wright St; Macedonia St; Peters Ave; Eve St; Emmet Ct (Emmett Ct); Bradford St; Hwy 101 S Off Rmp (Bay Shore Blvd).
Bernal Heights North neighborhood detailed profile
Area: 0.374 square miles
Population: 8,584
Population density:
| Bernal Heights North: | 22,977 people per square mile |
| San Francisco: | 17,458 people per square mile |
Median household income in 2021:
| Bernal Heights North: | $147,844 |
| San Francisco: | $121,826 |
Median rent in in 2021:
| Bernal Heights North: | $1,865 |
| San Francisco: | $2,001 |
Male vs Females
| Males: | 4,520 |
| Females: | 4,064 |
Median age
| Males: | 40.9 years |
| Females: | 38.2 years |
Housing prices:
Average estimated value of detached houses in 2021 (34.3% of all units):
| Bernal Heights North: | $1,664,488 |
| San Francisco: | $1,815,784 |
Average estimated value of townhouses or other attached units in 2021 (13.8% of all units):
| This neighborhood: | $1,346,978 |
| city: | $1,506,493 |
Average estimated value of housing units in 2-unit structures in 2021 (26.8% of all units):
| This neighborhood: | $1,079,167 |
| San Francisco: | $1,685,431 |
Average estimated '21 value of housing units in 3-to-4-unit structures (16.9% of all units):
| Bernal Heights North: | $1,135,641 |
| city: | $1,521,789 |
Average estimated '21 value of housing units in 5-or-more-unit structures (4.5% of all units):
| Bernal Heights North: | $796,479 |
| San Francisco: | $1,317,001 |
Most popular occupations of males: management occupations (except farmers) (16.6%); service occupations (11.5%); sales and office occupations (10.8%); computer and mathematical occupations (9.3%); business and financial operations occupations (9.1%); construction, extraction, and maintenance occupations (8.9%); arts, design, entertainment, sports, and media occupations (8.6%)
Most popular occupations of females: management occupations (except farmers) (19.1%); sales and office occupations (16.7%); business and financial operations occupations (15.7%); service occupations (12.1%); healthcare practitioners and technical occupations (7.3%); education, training, and library occupations (7.1%); arts, design, entertainment, sports, and media occupations (6.9%)
Limited-access highways (interstate or state) in this neighborhood: US Hwy 101 (James Lick Fwy).
Roads and streets: Precita Ave; Peralta Ave; Bernal Hts Blvd; Mullen Ave; Holladay Ave; Esmeralda Ave; Mission St; Montcalm St; Prospect Ave; Coleridge St; Ripley St; Winfield St; Elsie St; Folsom St; Rutledge St; Franconia St; Coso Ave; Alabama St; Eugenia Ave; Virginia Ave; Lundys Ln; Brewster St; Bonview St; Mirabel Ave; Montezuma St; Harrison St; Manchester St; Stoneman St; Shotwell St; Treat Ave; Kingston St; York St; Adam St; Fair Ave; Bessie St; Aztec St; Costa St; Norwich St; Faith St; Bay Shore Blvd; Godeus St; Powers Ave; Florida St; Samoset St; Massasoit St; Heyman Ave; Waltham St; Joy St; Wright St; Macedonia St; Peters Ave; Eve St; Emmet Ct (Emmett Ct); Bradford St; Hwy 101 S Off Rmp (Bay Shore Blvd).
Bernal Heights North neighborhood detailed profile
Bernal Heights Park neighborhood in San Francisco statistics: (Find on map)
Area: 0.032 square miles
Population: 485
Population density:
Median household income in 2021:
Median rent in in 2021:
Male vs Females
Median age
Most popular occupations of males: education, training, and library occupations (26.1%); management occupations (except farmers) (23.4%); arts, design, entertainment, sports, and media occupations (15.4%); business and financial operations occupations (10.1%); architecture and engineering occupations (7.8%); computer and mathematical occupations (5.3%); sales and office occupations (5.0%)
Most popular occupations of females: management occupations (except farmers) (33.2%); business and financial operations occupations (23.8%); arts, design, entertainment, sports, and media occupations (9.9%); legal occupations (8.6%); healthcare practitioners and technical occupations (5.6%); education, training, and library occupations (5.4%); life, physical, and social science occupations (5.3%)
Roads and streets: Bernal Hts Blvd.
Bernal Heights Park neighborhood detailed profile
Area: 0.032 square miles
Population: 485
Population density:
| Bernal Heights Park: | 15,393 people per square mile |
| San Francisco: | 17,458 people per square mile |
Median household income in 2021:
| Bernal Heights Park: | $217,589 |
| San Francisco: | $121,826 |
Median rent in in 2021:
| Bernal Heights Park: | $1,899 |
| San Francisco: | $2,001 |
Male vs Females
| Males: | 315 |
| Females: | 170 |
Median age
| Males: | 48.7 years |
| Females: | 46.7 years |
Most popular occupations of males: education, training, and library occupations (26.1%); management occupations (except farmers) (23.4%); arts, design, entertainment, sports, and media occupations (15.4%); business and financial operations occupations (10.1%); architecture and engineering occupations (7.8%); computer and mathematical occupations (5.3%); sales and office occupations (5.0%)
Most popular occupations of females: management occupations (except farmers) (33.2%); business and financial operations occupations (23.8%); arts, design, entertainment, sports, and media occupations (9.9%); legal occupations (8.6%); healthcare practitioners and technical occupations (5.6%); education, training, and library occupations (5.4%); life, physical, and social science occupations (5.3%)
Roads and streets: Bernal Hts Blvd.
Bernal Heights Park neighborhood detailed profile
Bernal Heights South neighborhood in San Francisco statistics: (Find on map)
Area: 0.669 square miles
Population: 16,218
Population density:
Median household income in 2021:
Median rent in in 2021:
Male vs Females
Median age
Housing prices:
Average estimated value of detached houses in 2021 (49.7% of all units):
Average estimated value of townhouses or other attached units in 2021 (16.7% of all units):
Average estimated value of housing units in 2-unit structures in 2021 (13.1% of all units):
Average estimated '21 value of housing units in 3-to-4-unit structures (13.2% of all units):
Average estimated '21 value of housing units in 5-or-more-unit structures (3.4% of all units):
Most popular occupations of males: management occupations (except farmers) (19.1%); sales and office occupations (15.8%); service occupations (13.3%); construction, extraction, and maintenance occupations (8.6%); computer and mathematical occupations (7.0%); business and financial operations occupations (6.8%); arts, design, entertainment, sports, and media occupations (6.5%)
Most popular occupations of females: sales and office occupations (17.1%); management occupations (except farmers) (16.4%); service occupations (16.2%); business and financial operations occupations (12.3%); healthcare practitioners and technical occupations (7.4%); arts, design, entertainment, sports, and media occupations (7.3%); education, training, and library occupations (6.1%)
Limited-access highways (interstate or state) in this neighborhood: I- 280; US Hwy 101 (James Lick Fwy).
Roads and streets: Alemany Blvd; Cortland Ave; Crescent Ave; Ellsworth St; Mission St; College Ave; Benton Ave; Powhattan Ave; Gates St; Moultrie St; Folsom St; Anderson St; Andover St; Justin Dr; Banks St; Prentiss St; Jarboe Ave; Richland Ave; Nevada St; Tompkins Ave; Peralta Ave; Park St; Ogden Ave; Holly Park Cir; Bradford St; Bosworth St; Eugenia Ave; Murray St; Highland Ave; Holladay Ave; Bernal Hts Blvd; Putnam St; Bocana St; Bronte St; Santa Marina St; Bennington St; Appleton Ave; Genebern Way; Chapman St; Mayflower St; San Bruno Ave; Leese St; Ellert St; Wool St; Newman St; Calvert Dr; Elsie St; Gladys St; St Marys Ave; Hunter St; Bache St; Porter St; Roscoe St; Marsilly St; Dickinson St; Nebraska St; Cuvier St; Barneveld Ave; Case St; Mojave St; Milton St; Saul St; Agnon Ave; Franconia St; Patton St; Carver St; College Ter; Rousseau St; Arnold Ave; Lyell St; Mirando St (Mirando Way); Mirando Way; Rotteck St; Rosenkranz St; Weldon St; Perasto Ave; Islais St; Danton St; Prospect Ave; Lamartine St; Cayuga Ave.
Bernal Heights South neighborhood detailed profile
Area: 0.669 square miles
Population: 16,218
Population density:
| Bernal Heights South: | 24,241 people per square mile |
| San Francisco: | 17,458 people per square mile |
Median household income in 2021:
| Bernal Heights South: | $153,118 |
| San Francisco: | $121,826 |
Median rent in in 2021:
| Bernal Heights South: | $2,141 |
| San Francisco: | $2,001 |
Male vs Females
| Males: | 8,559 |
| Females: | 7,658 |
Median age
| Males: | 41.7 years |
| Females: | 42.5 years |
Housing prices:
Average estimated value of detached houses in 2021 (49.7% of all units):
| Bernal Heights South: | $1,709,551 |
| San Francisco: | $1,815,784 |
Average estimated value of townhouses or other attached units in 2021 (16.7% of all units):
| This neighborhood: | $1,341,093 |
| city: | $1,506,493 |
Average estimated value of housing units in 2-unit structures in 2021 (13.1% of all units):
| This neighborhood: | $4,426,304 |
| San Francisco: | $1,685,431 |
Average estimated '21 value of housing units in 3-to-4-unit structures (13.2% of all units):
| Bernal Heights South: | $1,143,478 |
| city: | $1,521,789 |
Average estimated '21 value of housing units in 5-or-more-unit structures (3.4% of all units):
| Bernal Heights South: | $735,122 |
| San Francisco: | $1,317,001 |
Most popular occupations of males: management occupations (except farmers) (19.1%); sales and office occupations (15.8%); service occupations (13.3%); construction, extraction, and maintenance occupations (8.6%); computer and mathematical occupations (7.0%); business and financial operations occupations (6.8%); arts, design, entertainment, sports, and media occupations (6.5%)
Most popular occupations of females: sales and office occupations (17.1%); management occupations (except farmers) (16.4%); service occupations (16.2%); business and financial operations occupations (12.3%); healthcare practitioners and technical occupations (7.4%); arts, design, entertainment, sports, and media occupations (7.3%); education, training, and library occupations (6.1%)
Limited-access highways (interstate or state) in this neighborhood: I- 280; US Hwy 101 (James Lick Fwy).
Roads and streets: Alemany Blvd; Cortland Ave; Crescent Ave; Ellsworth St; Mission St; College Ave; Benton Ave; Powhattan Ave; Gates St; Moultrie St; Folsom St; Anderson St; Andover St; Justin Dr; Banks St; Prentiss St; Jarboe Ave; Richland Ave; Nevada St; Tompkins Ave; Peralta Ave; Park St; Ogden Ave; Holly Park Cir; Bradford St; Bosworth St; Eugenia Ave; Murray St; Highland Ave; Holladay Ave; Bernal Hts Blvd; Putnam St; Bocana St; Bronte St; Santa Marina St; Bennington St; Appleton Ave; Genebern Way; Chapman St; Mayflower St; San Bruno Ave; Leese St; Ellert St; Wool St; Newman St; Calvert Dr; Elsie St; Gladys St; St Marys Ave; Hunter St; Bache St; Porter St; Roscoe St; Marsilly St; Dickinson St; Nebraska St; Cuvier St; Barneveld Ave; Case St; Mojave St; Milton St; Saul St; Agnon Ave; Franconia St; Patton St; Carver St; College Ter; Rousseau St; Arnold Ave; Lyell St; Mirando St (Mirando Way); Mirando Way; Rotteck St; Rosenkranz St; Weldon St; Perasto Ave; Islais St; Danton St; Prospect Ave; Lamartine St; Cayuga Ave.
Bernal Heights South neighborhood detailed profile
Buena Vista Park neighborhood in San Francisco statistics: (Find on map)
Area: 0.138 square miles
Population: 2,071
Population density:
Median household income in 2021:
Median rent in in 2021:
Male vs Females
Median age
Housing prices:
Average estimated value of detached houses in 2021 (29.6% of all units):
Average estimated value of townhouses or other attached units in 2021 (5.1% of all units):
Average estimated value of housing units in 2-unit structures in 2021 (19.4% of all units):
Average estimated '21 value of housing units in 3-to-4-unit structures (19.1% of all units):
Average estimated '21 value of housing units in 5-or-more-unit structures (3.7% of all units):
Most popular occupations of males: computer and mathematical occupations (32.3%); business and financial operations occupations (13.6%); management occupations (except farmers) (13.5%); sales and office occupations (13.5%); education, training, and library occupations (7.1%); architecture and engineering occupations (6.4%); legal occupations (6.3%)
Most popular occupations of females: education, training, and library occupations (25.2%); management occupations (except farmers) (23.4%); sales and office occupations (12.7%); computer and mathematical occupations (9.8%); arts, design, entertainment, sports, and media occupations (9.6%); business and financial operations occupations (7.4%); service occupations (5.6%)
Roads and streets: Buena Vista Ave E; Buena Vista Ave W; Alpine Ter; Waller St; Buena Vista Ter; 14th St; Duboce Ave; Central Ave.
Buena Vista Park neighborhood detailed profile
Area: 0.138 square miles
Population: 2,071
Population density:
| Buena Vista Park: | 15,037 people per square mile |
| San Francisco: | 17,458 people per square mile |
Median household income in 2021:
| Buena Vista Park: | $250,001 |
| San Francisco: | $121,826 |
Median rent in in 2021:
| Buena Vista Park: | $2,749 |
| San Francisco: | $2,001 |
Male vs Females
| Males: | 1,219 |
| Females: | 852 |
Median age
| Males: | 39.0 years |
| Females: | 38.5 years |
Housing prices:
Average estimated value of detached houses in 2021 (29.6% of all units):
| Buena Vista Park: | $1,966,012 |
| San Francisco: | $1,815,784 |
Average estimated value of townhouses or other attached units in 2021 (5.1% of all units):
| This neighborhood: | $4,367,140 |
| city: | $1,506,493 |
Average estimated value of housing units in 2-unit structures in 2021 (19.4% of all units):
| This neighborhood: | $1,996,385 |
| San Francisco: | $1,685,431 |
Average estimated '21 value of housing units in 3-to-4-unit structures (19.1% of all units):
| Buena Vista Park: | $2,289,284 |
| city: | $1,521,789 |
Average estimated '21 value of housing units in 5-or-more-unit structures (3.7% of all units):
| Buena Vista Park: | $437,883 |
| San Francisco: | $1,317,001 |
Most popular occupations of males: computer and mathematical occupations (32.3%); business and financial operations occupations (13.6%); management occupations (except farmers) (13.5%); sales and office occupations (13.5%); education, training, and library occupations (7.1%); architecture and engineering occupations (6.4%); legal occupations (6.3%)
Most popular occupations of females: education, training, and library occupations (25.2%); management occupations (except farmers) (23.4%); sales and office occupations (12.7%); computer and mathematical occupations (9.8%); arts, design, entertainment, sports, and media occupations (9.6%); business and financial operations occupations (7.4%); service occupations (5.6%)
Roads and streets: Buena Vista Ave E; Buena Vista Ave W; Alpine Ter; Waller St; Buena Vista Ter; 14th St; Duboce Ave; Central Ave.
Buena Vista Park neighborhood detailed profile
Castro neighborhood in San Francisco statistics: (Find on map)
Area: 0.526 square miles
Population: 13,891
Population density:
Median household income in 2021:
Median rent in in 2021:
Male vs Females
Median age
Housing prices:
Average estimated value of detached houses in 2021 (15.3% of all units):
Average estimated value of townhouses or other attached units in 2021 (10.9% of all units):
Average estimated value of housing units in 2-unit structures in 2021 (15.9% of all units):
Average estimated '21 value of housing units in 3-to-4-unit structures (26.4% of all units):
Average estimated '21 value of housing units in 5-or-more-unit structures (4.3% of all units):
Most popular occupations of males: management occupations (except farmers) (27.0%); computer and mathematical occupations (15.4%); sales and office occupations (12.0%); business and financial operations occupations (9.9%); service occupations (8.8%); education, training, and library occupations (4.1%); healthcare practitioners and technical occupations (3.7%)
Most popular occupations of females: management occupations (except farmers) (22.8%); business and financial operations occupations (17.0%); sales and office occupations (13.7%); legal occupations (8.6%); healthcare practitioners and technical occupations (8.4%); computer and mathematical occupations (6.9%); arts, design, entertainment, sports, and media occupations (5.4%)
Roads and streets: 21st St; 20th St; 19th St; 18th St; Liberty St; Church St; Sanchez St; Noe St; Hill St; Castro St; 17th St; Douglass St; Eureka St; Hartford St; Diamond St; Collingwood St; Caselli Ave; Hancock St; Cumberland St; Guerrero St; Grand View Ave; 16th St; Dolores St; Corwin St; Seward St; Dorland St; Ford St; Romain St; Yukon St; Thorp Ln; Sharon St; Pond St; Prosper St; Danvers St; Clover Ln; Eagle St; 15th St; Grand View Ter; Mono St; Carson St; Clover St; Rayburn St; Lamson Ln; Dehon St; Harlow St.
Castro neighborhood detailed profile
Area: 0.526 square miles
Population: 13,891
Population density:
| Castro (Eureka Valley): | 26,424 people per square mile |
| San Francisco: | 17,458 people per square mile |
Median household income in 2021:
| Castro (Eureka Valley): | $201,418 |
| San Francisco: | $121,826 |
Median rent in in 2021:
| Castro (Eureka Valley): | $2,179 |
| San Francisco: | $2,001 |
Male vs Females
| Males: | 8,634 |
| Females: | 5,256 |
Median age
| Males: | 41.4 years |
| Females: | 39.5 years |
Housing prices:
Average estimated value of detached houses in 2021 (15.3% of all units):
| Castro (Eureka Valley): | $2,277,129 |
| San Francisco: | $1,815,784 |
Average estimated value of townhouses or other attached units in 2021 (10.9% of all units):
| This neighborhood: | $2,423,333 |
| city: | $1,506,493 |
Average estimated value of housing units in 2-unit structures in 2021 (15.9% of all units):
| This neighborhood: | $1,105,594 |
| San Francisco: | $1,685,431 |
Average estimated '21 value of housing units in 3-to-4-unit structures (26.4% of all units):
| Castro (Eureka Valley): | $584,314 |
| city: | $1,521,789 |
Average estimated '21 value of housing units in 5-or-more-unit structures (4.3% of all units):
| Castro (Eureka Valley): | $1,200,538 |
| San Francisco: | $1,317,001 |
Most popular occupations of males: management occupations (except farmers) (27.0%); computer and mathematical occupations (15.4%); sales and office occupations (12.0%); business and financial operations occupations (9.9%); service occupations (8.8%); education, training, and library occupations (4.1%); healthcare practitioners and technical occupations (3.7%)
Most popular occupations of females: management occupations (except farmers) (22.8%); business and financial operations occupations (17.0%); sales and office occupations (13.7%); legal occupations (8.6%); healthcare practitioners and technical occupations (8.4%); computer and mathematical occupations (6.9%); arts, design, entertainment, sports, and media occupations (5.4%)
Roads and streets: 21st St; 20th St; 19th St; 18th St; Liberty St; Church St; Sanchez St; Noe St; Hill St; Castro St; 17th St; Douglass St; Eureka St; Hartford St; Diamond St; Collingwood St; Caselli Ave; Hancock St; Cumberland St; Guerrero St; Grand View Ave; 16th St; Dolores St; Corwin St; Seward St; Dorland St; Ford St; Romain St; Yukon St; Thorp Ln; Sharon St; Pond St; Prosper St; Danvers St; Clover Ln; Eagle St; 15th St; Grand View Ter; Mono St; Carson St; Clover St; Rayburn St; Lamson Ln; Dehon St; Harlow St.
Castro neighborhood detailed profile
Cathedral Hill neighborhood in San Francisco statistics: (Find on map)
Area: 0.095 square miles
Population: 2,197
Population density:
Median household income in 2021:
Median rent in in 2021:
Male vs Females
Median age
Most popular occupations of males: management occupations (except farmers) (17.9%); business and financial operations occupations (17.8%); computer and mathematical occupations (14.1%); arts, design, entertainment, sports, and media occupations (11.0%); sales and office occupations (10.4%); service occupations (8.5%); transportation occupations (6.9%)
Most popular occupations of females: management occupations (except farmers) (29.3%); arts, design, entertainment, sports, and media occupations (21.2%); sales and office occupations (10.7%); service occupations (10.0%); computer and mathematical occupations (9.5%); healthcare practitioners and technical occupations (6.3%); life, physical, and social science occupations (5.2%)
Highways in this neighborhood: US Hwy 101 (Van Ness Ave).
Roads and streets: Geary Blvd; Eddy St; Ellis St; Willow St; Gough St; Franklin St; Starr King Way; Ofarrell St; Alice B Toklas Pl (Myrtle St); Olive St.
Cathedral Hill neighborhood detailed profile
Area: 0.095 square miles
Population: 2,197
Population density:
| Cathedral Hill: | 23,094 people per square mile |
| San Francisco: | 17,458 people per square mile |
Median household income in 2021:
| Cathedral Hill: | $107,293 |
| San Francisco: | $121,826 |
Median rent in in 2021:
| Cathedral Hill: | $1,684 |
| San Francisco: | $2,001 |
Male vs Females
| Males: | 1,125 |
| Females: | 1,071 |
Median age
| Males: | 53.1 years |
| Females: | 52.5 years |
Most popular occupations of males: management occupations (except farmers) (17.9%); business and financial operations occupations (17.8%); computer and mathematical occupations (14.1%); arts, design, entertainment, sports, and media occupations (11.0%); sales and office occupations (10.4%); service occupations (8.5%); transportation occupations (6.9%)
Most popular occupations of females: management occupations (except farmers) (29.3%); arts, design, entertainment, sports, and media occupations (21.2%); sales and office occupations (10.7%); service occupations (10.0%); computer and mathematical occupations (9.5%); healthcare practitioners and technical occupations (6.3%); life, physical, and social science occupations (5.2%)
Highways in this neighborhood: US Hwy 101 (Van Ness Ave).
Roads and streets: Geary Blvd; Eddy St; Ellis St; Willow St; Gough St; Franklin St; Starr King Way; Ofarrell St; Alice B Toklas Pl (Myrtle St); Olive St.
Cathedral Hill neighborhood detailed profile
Cayuga Terrace neighborhood in San Francisco statistics: (Find on map)
Area: 0.192 square miles
Population: 6,107
Population density:
Median household income in 2021:
Median rent in in 2021:
Male vs Females
Median age
Housing prices:
Average estimated value of detached houses in 2021 (50.9% of all units):
Average estimated value of townhouses or other attached units in 2021 (42.2% of all units):
Most popular occupations of males: service occupations (32.3%); computer and mathematical occupations (19.1%); management occupations (except farmers) (11.1%); sales and office occupations (6.1%); transportation occupations (6.0%); arts, design, entertainment, sports, and media occupations (5.4%); business and financial operations occupations (4.9%)
Most popular occupations of females: sales and office occupations (33.1%); service occupations (24.1%); education, training, and library occupations (16.5%); management occupations (except farmers) (8.7%); business and financial operations occupations (5.9%); community and social services occupations (3.6%); healthcare practitioners and technical occupations (3.2%)
Limited-access highways (interstate or state) in this neighborhood: I- 280.
Roads and streets: Alemany Blvd; San Jose Ave; Geneva Ave; Cayuga Ave; Niagara Ave; Rome St; Mount Vernon Ave; Delano Ave; Nahua Ave; Shawnee Ave; Ottawa Ave; Foote Ave; Naglee Ave; Restani Way; Seminole Ave; Whipple Ave; Lawrence Ave; Otega Ave; Modoc Ave; Farragut Ave; Ridge Ln; Chancery Ln.
Cayuga Terrace neighborhood detailed profile
Area: 0.192 square miles
Population: 6,107
Population density:
| Cayuga Terrace: | 31,786 people per square mile |
| San Francisco: | 17,458 people per square mile |
Median household income in 2021:
| Cayuga Terrace: | $107,021 |
| San Francisco: | $121,826 |
Median rent in in 2021:
| Cayuga Terrace: | $1,657 |
| San Francisco: | $2,001 |
Male vs Females
| Males: | 3,562 |
| Females: | 2,544 |
Median age
| Males: | 37.3 years |
| Females: | 46.8 years |
Housing prices:
Average estimated value of detached houses in 2021 (50.9% of all units):
| Cayuga Terrace: | $951,129 |
| San Francisco: | $1,815,784 |
Average estimated value of townhouses or other attached units in 2021 (42.2% of all units):
| This neighborhood: | $1,144,898 |
| city: | $1,506,493 |
Most popular occupations of males: service occupations (32.3%); computer and mathematical occupations (19.1%); management occupations (except farmers) (11.1%); sales and office occupations (6.1%); transportation occupations (6.0%); arts, design, entertainment, sports, and media occupations (5.4%); business and financial operations occupations (4.9%)
Most popular occupations of females: sales and office occupations (33.1%); service occupations (24.1%); education, training, and library occupations (16.5%); management occupations (except farmers) (8.7%); business and financial operations occupations (5.9%); community and social services occupations (3.6%); healthcare practitioners and technical occupations (3.2%)
Limited-access highways (interstate or state) in this neighborhood: I- 280.
Roads and streets: Alemany Blvd; San Jose Ave; Geneva Ave; Cayuga Ave; Niagara Ave; Rome St; Mount Vernon Ave; Delano Ave; Nahua Ave; Shawnee Ave; Ottawa Ave; Foote Ave; Naglee Ave; Restani Way; Seminole Ave; Whipple Ave; Lawrence Ave; Otega Ave; Modoc Ave; Farragut Ave; Ridge Ln; Chancery Ln.
Cayuga Terrace neighborhood detailed profile
Central Richmond neighborhood in San Francisco statistics: (Find on map)
Area: 0.858 square miles
Population: 25,739
Population density:
Median household income in 2021:
Median rent in in 2021:
Male vs Females
Median age
Housing prices:
Average estimated value of detached houses in 2021 (12.9% of all units):
Average estimated value of townhouses or other attached units in 2021 (14.3% of all units):
Average estimated value of housing units in 2-unit structures in 2021 (24.6% of all units):
Average estimated '21 value of housing units in 3-to-4-unit structures (19.5% of all units):
Most popular occupations of males: management occupations (except farmers) (18.1%); sales and office occupations (13.3%); business and financial operations occupations (12.2%); computer and mathematical occupations (10.2%); service occupations (9.1%); arts, design, entertainment, sports, and media occupations (6.6%); legal occupations (5.3%)
Most popular occupations of females: sales and office occupations (21.6%); management occupations (except farmers) (14.4%); service occupations (13.7%); business and financial operations occupations (13.1%); education, training, and library occupations (7.6%); healthcare practitioners and technical occupations (7.3%); arts, design, entertainment, sports, and media occupations (6.9%)
Highways in this neighborhood: State Hwy 1 (Park Presidio Blvd).
Roads and streets: Geary Blvd; Fulton St; Clement St; Cabrillo St; Balboa St; Anza St; 32nd Ave; 24th Ave; 25th Ave; 23rd Ave; 26th Ave; 27th Ave; 28th Ave; 29th Ave; 30th Ave; 18th Ave; 16th Ave; 21st Ave; 15th Ave; 20th Ave; 17th Ave; 22nd Ave; 19th Ave; 14th Ave; 31st Ave; Tacoma St.
Central Richmond neighborhood detailed profile
Area: 0.858 square miles
Population: 25,739
Population density:
| Central Richmond: | 29,993 people per square mile |
| San Francisco: | 17,458 people per square mile |
Median household income in 2021:
| Central Richmond: | $121,361 |
| San Francisco: | $121,826 |
Median rent in in 2021:
| Central Richmond: | $1,985 |
| San Francisco: | $2,001 |
Male vs Females
| Males: | 12,295 |
| Females: | 13,443 |
Median age
| Males: | 41.8 years |
| Females: | 43.0 years |
Housing prices:
Average estimated value of detached houses in 2021 (12.9% of all units):
| Central Richmond: | $1,683,227 |
| San Francisco: | $1,815,784 |
Average estimated value of townhouses or other attached units in 2021 (14.3% of all units):
| This neighborhood: | $1,574,691 |
| city: | $1,506,493 |
Average estimated value of housing units in 2-unit structures in 2021 (24.6% of all units):
| This neighborhood: | $987,361 |
| San Francisco: | $1,685,431 |
Average estimated '21 value of housing units in 3-to-4-unit structures (19.5% of all units):
| Central Richmond: | $1,169,301 |
| city: | $1,521,789 |
Most popular occupations of males: management occupations (except farmers) (18.1%); sales and office occupations (13.3%); business and financial operations occupations (12.2%); computer and mathematical occupations (10.2%); service occupations (9.1%); arts, design, entertainment, sports, and media occupations (6.6%); legal occupations (5.3%)
Most popular occupations of females: sales and office occupations (21.6%); management occupations (except farmers) (14.4%); service occupations (13.7%); business and financial operations occupations (13.1%); education, training, and library occupations (7.6%); healthcare practitioners and technical occupations (7.3%); arts, design, entertainment, sports, and media occupations (6.9%)
Highways in this neighborhood: State Hwy 1 (Park Presidio Blvd).
Roads and streets: Geary Blvd; Fulton St; Clement St; Cabrillo St; Balboa St; Anza St; 32nd Ave; 24th Ave; 25th Ave; 23rd Ave; 26th Ave; 27th Ave; 28th Ave; 29th Ave; 30th Ave; 18th Ave; 16th Ave; 21st Ave; 15th Ave; 20th Ave; 17th Ave; 22nd Ave; 19th Ave; 14th Ave; 31st Ave; Tacoma St.
Central Richmond neighborhood detailed profile
Central Sunset neighborhood in San Francisco statistics: (Find on map)
Area: 0.934 square miles
Population: 19,949
Population density:
Median household income in 2021:
Median rent in in 2021:
Male vs Females
Median age
Housing prices:
Average estimated value of detached houses in 2021 (32.7% of all units):
Average estimated value of townhouses or other attached units in 2021 (42.2% of all units):
Most popular occupations of males: service occupations (19.9%); sales and office occupations (13.6%); management occupations (except farmers) (12.7%); business and financial operations occupations (7.1%); architecture and engineering occupations (7.1%); computer and mathematical occupations (5.5%); arts, design, entertainment, sports, and media occupations (4.9%)
Most popular occupations of females: management occupations (except farmers) (23.7%); sales and office occupations (21.1%); healthcare practitioners and technical occupations (14.0%); business and financial operations occupations (11.5%); life, physical, and social science occupations (8.5%); service occupations (7.4%); education, training, and library occupations (4.2%)
Roads and streets: Lincoln Way; Irving St; Judah St; Ortega St; Kirkham St; Lawton St; Noriega St; Moraga St; 32nd Ave; 31st Ave; 30th Ave; 23rd Ave; 26th Ave; 35th Ave; 27th Ave; 34th Ave; 22nd Ave; 36th Ave; 24th Ave; 33rd Ave; 20th Ave; 21st Ave; 29th Ave; 28th Ave; 25th Ave; Pino Aly.
Central Sunset neighborhood detailed profile
Area: 0.934 square miles
Population: 19,949
Population density:
| Central Sunset: | 21,355 people per square mile |
| San Francisco: | 17,458 people per square mile |
Median household income in 2021:
| Central Sunset: | $151,578 |
| San Francisco: | $121,826 |
Median rent in in 2021:
| Central Sunset: | $1,876 |
| San Francisco: | $2,001 |
Male vs Females
| Males: | 9,756 |
| Females: | 10,193 |
Median age
| Males: | 46.0 years |
| Females: | 49.6 years |
Housing prices:
Average estimated value of detached houses in 2021 (32.7% of all units):
| Central Sunset: | $1,129,031 |
| San Francisco: | $1,815,784 |
Average estimated value of townhouses or other attached units in 2021 (42.2% of all units):
| This neighborhood: | $1,315,706 |
| city: | $1,506,493 |
Most popular occupations of males: service occupations (19.9%); sales and office occupations (13.6%); management occupations (except farmers) (12.7%); business and financial operations occupations (7.1%); architecture and engineering occupations (7.1%); computer and mathematical occupations (5.5%); arts, design, entertainment, sports, and media occupations (4.9%)
Most popular occupations of females: management occupations (except farmers) (23.7%); sales and office occupations (21.1%); healthcare practitioners and technical occupations (14.0%); business and financial operations occupations (11.5%); life, physical, and social science occupations (8.5%); service occupations (7.4%); education, training, and library occupations (4.2%)
Roads and streets: Lincoln Way; Irving St; Judah St; Ortega St; Kirkham St; Lawton St; Noriega St; Moraga St; 32nd Ave; 31st Ave; 30th Ave; 23rd Ave; 26th Ave; 35th Ave; 27th Ave; 34th Ave; 22nd Ave; 36th Ave; 24th Ave; 33rd Ave; 20th Ave; 21st Ave; 29th Ave; 28th Ave; 25th Ave; Pino Aly.
Central Sunset neighborhood detailed profile
Chinatown neighborhood in San Francisco statistics: (Find on map)
Area: 0.168 square miles
Population: 7,860
Population density:
Median household income in 2021:
Median rent in in 2021:
Male vs Females
Median age
Average estimated '21 value of housing units in 5-or-more-unit structures (25.2% of all units):
Most popular occupations of males: service occupations (19.6%); sales and office occupations (18.4%); computer and mathematical occupations (11.0%); business and financial operations occupations (7.1%); management occupations (except farmers) (6.7%); construction, extraction, and maintenance occupations (5.9%); arts, design, entertainment, sports, and media occupations (4.6%)
Most popular occupations of females: service occupations (31.3%); sales and office occupations (26.3%); management occupations (except farmers) (17.2%); education, training, and library occupations (6.7%); business and financial operations occupations (6.6%); production occupations (4.3%); healthcare practitioners and technical occupations (2.4%)
Roads and streets: Stockton St; Powell St; Grant Ave; Kearny St; Washington St; Pacific Ave; Pine St; Jackson St; Bush St; California St; Sacramento St; Clay St; Broadway St (Broadway); Columbus Ave; Joice St; Vallejo St; Waverly Pl; Trenton St; Commercial St; Turk Murphy Ln; Quincy St; St George Aly; Dashiell Hammett St (Monore); Hangah St; Beckett St; Spofford St; Ross Aly; Wentworth Pl (Wentworth St); Stone St; Walter U Lum Pl; Cordelia St; Jack Kerouac Aly; Stark St; Fella Pl; Card Aly; Collier St; Vinton Ct; Sabin Pl; Emma St; Fisher Aly; Emery Ln; Kenneth Rexroth Pl (Tracy Pl); Chatham Pl; Saint Louis Aly; Miller Pl; Bedford Pl; Cooper Aly; Parkhurst Aly; Jason Ct; James Pl; Adele Ct; Duncombe Aly; Pratt Pl; Miles Ct; Brooklyn Pl; Old Chinatown Ln; Pelton Pl; Pontiac St; Saroyan Pl; Pagoda Pl.
Chinatown neighborhood detailed profile
Area: 0.168 square miles
Population: 7,860
Population density:
| Chinatown: | 46,772 people per square mile |
| San Francisco: | 17,458 people per square mile |
Median household income in 2021:
| Chinatown: | $64,563 |
| San Francisco: | $121,826 |
Median rent in in 2021:
| Chinatown: | $806 |
| San Francisco: | $2,001 |
Male vs Females
| Males: | 3,628 |
| Females: | 4,232 |
Median age
| Males: | 45.3 years |
| Females: | 49.1 years |
Average estimated '21 value of housing units in 5-or-more-unit structures (25.2% of all units):
| Chinatown: | $1,094,033 |
| San Francisco: | $1,317,001 |
Most popular occupations of males: service occupations (19.6%); sales and office occupations (18.4%); computer and mathematical occupations (11.0%); business and financial operations occupations (7.1%); management occupations (except farmers) (6.7%); construction, extraction, and maintenance occupations (5.9%); arts, design, entertainment, sports, and media occupations (4.6%)
Most popular occupations of females: service occupations (31.3%); sales and office occupations (26.3%); management occupations (except farmers) (17.2%); education, training, and library occupations (6.7%); business and financial operations occupations (6.6%); production occupations (4.3%); healthcare practitioners and technical occupations (2.4%)
Roads and streets: Stockton St; Powell St; Grant Ave; Kearny St; Washington St; Pacific Ave; Pine St; Jackson St; Bush St; California St; Sacramento St; Clay St; Broadway St (Broadway); Columbus Ave; Joice St; Vallejo St; Waverly Pl; Trenton St; Commercial St; Turk Murphy Ln; Quincy St; St George Aly; Dashiell Hammett St (Monore); Hangah St; Beckett St; Spofford St; Ross Aly; Wentworth Pl (Wentworth St); Stone St; Walter U Lum Pl; Cordelia St; Jack Kerouac Aly; Stark St; Fella Pl; Card Aly; Collier St; Vinton Ct; Sabin Pl; Emma St; Fisher Aly; Emery Ln; Kenneth Rexroth Pl (Tracy Pl); Chatham Pl; Saint Louis Aly; Miller Pl; Bedford Pl; Cooper Aly; Parkhurst Aly; Jason Ct; James Pl; Adele Ct; Duncombe Aly; Pratt Pl; Miles Ct; Brooklyn Pl; Old Chinatown Ln; Pelton Pl; Pontiac St; Saroyan Pl; Pagoda Pl.
Chinatown neighborhood detailed profile
Civic Center neighborhood in San Francisco statistics: (Find on map)
Area: 0.391 square miles
Population: 10,497
Population density:
Median household income in 2021:
Median rent in in 2021:
Male vs Females
Median age
Most popular occupations of males: computer and mathematical occupations (26.0%); business and financial operations occupations (21.6%); management occupations (except farmers) (19.7%); sales and office occupations (11.1%); service occupations (6.9%); arts, design, entertainment, sports, and media occupations (3.3%); architecture and engineering occupations (2.6%)
Most popular occupations of females: management occupations (except farmers) (23.6%); sales and office occupations (21.2%); business and financial operations occupations (15.8%); service occupations (10.3%); computer and mathematical occupations (9.0%); education, training, and library occupations (5.2%); arts, design, entertainment, sports, and media occupations (4.8%)
Highways in this neighborhood: US Hwy 101 (Van Ness Ave).
Roads and streets: Market St; Gough St; Franklin St; McAllister St; Polk St; Grove St; Hayes St; Fell St; Ellis St; Sutter St; Post St; Bush St; Pine St; Turk Blvd (Turk St); Eddy St; Fulton St; Golden Gate Ave; Willow St; Fern St; Austin St; Geary Blvd; Ofarrell St; Ivy St; Hickory St; Oak St; Elm St; Alice B Toklas Pl (Myrtle St); Olive St; Hemlock St; Larkin St; Redwood St; Page St; Hyde St; Starr King Way; Peter Yorke Way; Dr Carlton P Goodlett Pl; Geary St; Linden St; Lily St; Larch St; Cedar St; Ash St; Rose St; Leavenworth St; 7th St; Haight St; Jones St.
Civic Center neighborhood detailed profile
Area: 0.391 square miles
Population: 10,497
Population density:
| Civic Center: | 26,862 people per square mile |
| San Francisco: | 17,458 people per square mile |
Median household income in 2021:
| Civic Center: | $119,889 |
| San Francisco: | $121,826 |
Median rent in in 2021:
| Civic Center: | $2,126 |
| San Francisco: | $2,001 |
Male vs Females
| Males: | 6,017 |
| Females: | 4,480 |
Median age
| Males: | 47.8 years |
| Females: | 46.9 years |
Most popular occupations of males: computer and mathematical occupations (26.0%); business and financial operations occupations (21.6%); management occupations (except farmers) (19.7%); sales and office occupations (11.1%); service occupations (6.9%); arts, design, entertainment, sports, and media occupations (3.3%); architecture and engineering occupations (2.6%)
Most popular occupations of females: management occupations (except farmers) (23.6%); sales and office occupations (21.2%); business and financial operations occupations (15.8%); service occupations (10.3%); computer and mathematical occupations (9.0%); education, training, and library occupations (5.2%); arts, design, entertainment, sports, and media occupations (4.8%)
Highways in this neighborhood: US Hwy 101 (Van Ness Ave).
Roads and streets: Market St; Gough St; Franklin St; McAllister St; Polk St; Grove St; Hayes St; Fell St; Ellis St; Sutter St; Post St; Bush St; Pine St; Turk Blvd (Turk St); Eddy St; Fulton St; Golden Gate Ave; Willow St; Fern St; Austin St; Geary Blvd; Ofarrell St; Ivy St; Hickory St; Oak St; Elm St; Alice B Toklas Pl (Myrtle St); Olive St; Hemlock St; Larkin St; Redwood St; Page St; Hyde St; Starr King Way; Peter Yorke Way; Dr Carlton P Goodlett Pl; Geary St; Linden St; Lily St; Larch St; Cedar St; Ash St; Rose St; Leavenworth St; 7th St; Haight St; Jones St.
Civic Center neighborhood detailed profile
Clarendon Heights neighborhood in San Francisco statistics: (Find on map)
Area: 0.082 square miles
Population: 1,170
Population density:
Median household income in 2021:
Median rent in in 2021:
Male vs Females
Median age
Housing prices:
Average estimated value of detached houses in 2021 (23.2% of all units):
Average estimated value of townhouses or other attached units in 2021 (3.3% of all units):
Average estimated value of housing units in 2-unit structures in 2021 (29.3% of all units):
Most popular occupations of males: computer and mathematical occupations (18.8%); life, physical, and social science occupations (15.2%); healthcare practitioners and technical occupations (11.8%); sales and office occupations (10.9%); management occupations (except farmers) (10.7%); education, training, and library occupations (5.6%); arts, design, entertainment, sports, and media occupations (5.5%)
Most popular occupations of females: healthcare practitioners and technical occupations (38.3%); service occupations (11.3%); management occupations (except farmers) (10.2%); education, training, and library occupations (8.7%); sales and office occupations (7.4%); architecture and engineering occupations (6.3%); life, physical, and social science occupations (4.4%)
Roads and streets: Twin Peaks Blvd; Palo Alto Ave; St Germain Ave; Mountain Spring Ave; Belgrave Ave; Clarendon Ave; Glenbrook Ave; Pemberton Pl; Raccoon Dr; la Avanzada St; Clayton St; Crown Ter; Graystone Ter; Stanyan St; Crown Ct; Villa Ter; Bigler Ave.
Clarendon Heights neighborhood detailed profile
Area: 0.082 square miles
Population: 1,170
Population density:
| Clarendon Heights: | 14,185 people per square mile |
| San Francisco: | 17,458 people per square mile |
Median household income in 2021:
| Clarendon Heights: | $188,013 |
| San Francisco: | $121,826 |
Median rent in in 2021:
| Clarendon Heights: | $2,990 |
| San Francisco: | $2,001 |
Male vs Females
| Males: | 605 |
| Females: | 565 |
Median age
| Males: | 40.9 years |
| Females: | 41.4 years |
Housing prices:
Average estimated value of detached houses in 2021 (23.2% of all units):
| Clarendon Heights: | $2,054,292 |
| San Francisco: | $1,815,784 |
Average estimated value of townhouses or other attached units in 2021 (3.3% of all units):
| This neighborhood: | $1,043,631 |
| city: | $1,506,493 |
Average estimated value of housing units in 2-unit structures in 2021 (29.3% of all units):
| This neighborhood: | $1,866,667 |
| San Francisco: | $1,685,431 |
Most popular occupations of males: computer and mathematical occupations (18.8%); life, physical, and social science occupations (15.2%); healthcare practitioners and technical occupations (11.8%); sales and office occupations (10.9%); management occupations (except farmers) (10.7%); education, training, and library occupations (5.6%); arts, design, entertainment, sports, and media occupations (5.5%)
Most popular occupations of females: healthcare practitioners and technical occupations (38.3%); service occupations (11.3%); management occupations (except farmers) (10.2%); education, training, and library occupations (8.7%); sales and office occupations (7.4%); architecture and engineering occupations (6.3%); life, physical, and social science occupations (4.4%)
Roads and streets: Twin Peaks Blvd; Palo Alto Ave; St Germain Ave; Mountain Spring Ave; Belgrave Ave; Clarendon Ave; Glenbrook Ave; Pemberton Pl; Raccoon Dr; la Avanzada St; Clayton St; Crown Ter; Graystone Ter; Stanyan St; Crown Ct; Villa Ter; Bigler Ave.
Clarendon Heights neighborhood detailed profile
Cole Valley neighborhood in San Francisco statistics: (Find on map)
Area: 0.135 square miles
Population: 3,276
Population density:
Median household income in 2021:
Median rent in in 2021:
Male vs Females
Median age
Housing prices:
Average estimated value of detached houses in 2021 (12.3% of all units):
Average estimated value of townhouses or other attached units in 2021 (13.5% of all units):
Average estimated value of housing units in 2-unit structures in 2021 (17.1% of all units):
Average estimated '21 value of housing units in 3-to-4-unit structures (7.5% of all units):
Average estimated '21 value of housing units in 5-or-more-unit structures (43.1% of all units):
Most popular occupations of males: computer and mathematical occupations (19.1%); life, physical, and social science occupations (15.9%); healthcare practitioners and technical occupations (12.9%); sales and office occupations (11.3%); management occupations (except farmers) (10.2%); business and financial operations occupations (5.8%); arts, design, entertainment, sports, and media occupations (5.7%)
Most popular occupations of females: healthcare practitioners and technical occupations (33.5%); business and financial operations occupations (13.1%); service occupations (12.7%); sales and office occupations (8.9%); management occupations (except farmers) (8.3%); legal occupations (5.5%); education, training, and library occupations (5.1%)
Roads and streets: Cole St; Clayton St; Shrader St; 17th St; Carl St; Parnassus Ave; Belvedere St; Frederick St; Grattan St; Alma St; Rivoli St; Beulah St.
Cole Valley neighborhood detailed profile
Area: 0.135 square miles
Population: 3,276
Population density:
| Cole Valley: | 24,343 people per square mile |
| San Francisco: | 17,458 people per square mile |
Median household income in 2021:
| Cole Valley: | $175,986 |
| San Francisco: | $121,826 |
Median rent in in 2021:
| Cole Valley: | $2,778 |
| San Francisco: | $2,001 |
Male vs Females
| Males: | 1,432 |
| Females: | 1,844 |
Median age
| Males: | 40.5 years |
| Females: | 35.8 years |
Housing prices:
Average estimated value of detached houses in 2021 (12.3% of all units):
| Cole Valley: | $1,893,087 |
| San Francisco: | $1,815,784 |
Average estimated value of townhouses or other attached units in 2021 (13.5% of all units):
| This neighborhood: | $1,043,631 |
| city: | $1,506,493 |
Average estimated value of housing units in 2-unit structures in 2021 (17.1% of all units):
| This neighborhood: | $1,866,667 |
| San Francisco: | $1,685,431 |
Average estimated '21 value of housing units in 3-to-4-unit structures (7.5% of all units):
| Cole Valley: | $1,276,190 |
| city: | $1,521,789 |
Average estimated '21 value of housing units in 5-or-more-unit structures (43.1% of all units):
| Cole Valley: | $715,625 |
| San Francisco: | $1,317,001 |
Most popular occupations of males: computer and mathematical occupations (19.1%); life, physical, and social science occupations (15.9%); healthcare practitioners and technical occupations (12.9%); sales and office occupations (11.3%); management occupations (except farmers) (10.2%); business and financial operations occupations (5.8%); arts, design, entertainment, sports, and media occupations (5.7%)
Most popular occupations of females: healthcare practitioners and technical occupations (33.5%); business and financial operations occupations (13.1%); service occupations (12.7%); sales and office occupations (8.9%); management occupations (except farmers) (8.3%); legal occupations (5.5%); education, training, and library occupations (5.1%)
Roads and streets: Cole St; Clayton St; Shrader St; 17th St; Carl St; Parnassus Ave; Belvedere St; Frederick St; Grattan St; Alma St; Rivoli St; Beulah St.
Cole Valley neighborhood detailed profile
Corona Heights neighborhood in San Francisco statistics: (Find on map)
Area: 0.174 square miles
Population: 2,852
Population density:
Median household income in 2021:
Median rent in in 2021:
Male vs Females
Median age
Housing prices:
Average estimated value of detached houses in 2021 (22.8% of all units):
Average estimated value of townhouses or other attached units in 2021 (10.5% of all units):
Average estimated value of housing units in 2-unit structures in 2021 (24.1% of all units):
Average estimated '21 value of housing units in 3-to-4-unit structures (15.3% of all units):
Average estimated '21 value of housing units in 5-or-more-unit structures (17.3% of all units):
Most popular occupations of males: sales and office occupations (21.5%); management occupations (except farmers) (19.5%); computer and mathematical occupations (16.1%); business and financial operations occupations (10.4%); legal occupations (5.2%); arts, design, entertainment, sports, and media occupations (5.2%); service occupations (5.2%)
Most popular occupations of females: business and financial operations occupations (17.3%); healthcare practitioners and technical occupations (15.4%); sales and office occupations (12.8%); management occupations (except farmers) (10.4%); education, training, and library occupations (9.4%); architecture and engineering occupations (7.8%); computer and mathematical occupations (6.2%)
Roads and streets: Market St; 17th St; Corbett Ave; States St; Roosevelt Way; Saturn St; Museum Way; 15th St; Levant St; Ord St; Douglass St; Vulcan Stairway; Mars St; Ord Ct; Uranus Ter; Lower Ter; Flint St; Beaver St; Merritt St; 19th St; Danvers St; 16th St; Fairbanks St; Temple St; Hattie St; Eureka St; Buena Vista Ter; Diamond St; de Forest Way; Deming St; Collingwood St; Corbin Pl.
Corona Heights neighborhood detailed profile
Area: 0.174 square miles
Population: 2,852
Population density:
| Corona Heights: | 16,353 people per square mile |
| San Francisco: | 17,458 people per square mile |
Median household income in 2021:
| Corona Heights: | $222,678 |
| San Francisco: | $121,826 |
Median rent in in 2021:
| Corona Heights: | $2,804 |
| San Francisco: | $2,001 |
Male vs Females
| Males: | 1,784 |
| Females: | 1,068 |
Median age
| Males: | 40.9 years |
| Females: | 38.1 years |
Housing prices:
Average estimated value of detached houses in 2021 (22.8% of all units):
| Corona Heights: | $2,112,245 |
| San Francisco: | $1,815,784 |
Average estimated value of townhouses or other attached units in 2021 (10.5% of all units):
| This neighborhood: | $7,150,439 |
| city: | $1,506,493 |
Average estimated value of housing units in 2-unit structures in 2021 (24.1% of all units):
| This neighborhood: | $1,866,667 |
| San Francisco: | $1,685,431 |
Average estimated '21 value of housing units in 3-to-4-unit structures (15.3% of all units):
| Corona Heights: | $605,362 |
| city: | $1,521,789 |
Average estimated '21 value of housing units in 5-or-more-unit structures (17.3% of all units):
| Corona Heights: | $640,086 |
| San Francisco: | $1,317,001 |
Most popular occupations of males: sales and office occupations (21.5%); management occupations (except farmers) (19.5%); computer and mathematical occupations (16.1%); business and financial operations occupations (10.4%); legal occupations (5.2%); arts, design, entertainment, sports, and media occupations (5.2%); service occupations (5.2%)
Most popular occupations of females: business and financial operations occupations (17.3%); healthcare practitioners and technical occupations (15.4%); sales and office occupations (12.8%); management occupations (except farmers) (10.4%); education, training, and library occupations (9.4%); architecture and engineering occupations (7.8%); computer and mathematical occupations (6.2%)
Roads and streets: Market St; 17th St; Corbett Ave; States St; Roosevelt Way; Saturn St; Museum Way; 15th St; Levant St; Ord St; Douglass St; Vulcan Stairway; Mars St; Ord Ct; Uranus Ter; Lower Ter; Flint St; Beaver St; Merritt St; 19th St; Danvers St; 16th St; Fairbanks St; Temple St; Hattie St; Eureka St; Buena Vista Ter; Diamond St; de Forest Way; Deming St; Collingwood St; Corbin Pl.
Corona Heights neighborhood detailed profile
Cow Hollow neighborhood in San Francisco statistics: (Find on map)
Area: 0.282 square miles
Population: 73
Population density:
Median household income in 2021:
Median rent in in 2021:
Male vs Females
Median age
Most popular occupations of males: management occupations (except farmers) (28.9%); service occupations (14.2%); sales and office occupations (13.8%); architecture and engineering occupations (8.2%); life, physical, and social science occupations (7.7%); business and financial operations occupations (6.7%); transportation occupations (5.4%)
Most popular occupations of females: sales and office occupations (29.1%); education, training, and library occupations (13.0%); business and financial operations occupations (12.8%); service occupations (11.4%); management occupations (except farmers) (8.7%); arts, design, entertainment, sports, and media occupations (7.3%); legal occupations (5.3%)
Highways in this neighborhood: US Hwy 101 (Richardson Ave); US Hwy 101 (Van Ness Ave).
Roads and streets: Lombard St; Union St; Filbert St; Greenwich St; Lyon St; Moulton St; Pixley St; Baker St; Pierce St; Steiner St; Webster St; Broderick St; Fillmore St; Octavia St; Buchanan St; Laguna St; Gough St; Divisadero St; Scott St; Franklin St; Chestnut St; Harris Pl; Service St; Miley St; Imperial Ave; Blackstone Ct; Francisco St.
Cow Hollow neighborhood detailed profile
Area: 0.282 square miles
Population: 73
Population density:
| Cow Hollow: | 259 people per square mile |
| San Francisco: | 17,458 people per square mile |
Median household income in 2021:
| Cow Hollow: | $259,249 |
| San Francisco: | $121,826 |
Median rent in in 2021:
| Cow Hollow: | $4,361 |
| San Francisco: | $2,001 |
Male vs Females
| Males: | 30 |
| Females: | 43 |
Median age
| Males: | 41.0 years |
| Females: | 42.5 years |
Most popular occupations of males: management occupations (except farmers) (28.9%); service occupations (14.2%); sales and office occupations (13.8%); architecture and engineering occupations (8.2%); life, physical, and social science occupations (7.7%); business and financial operations occupations (6.7%); transportation occupations (5.4%)
Most popular occupations of females: sales and office occupations (29.1%); education, training, and library occupations (13.0%); business and financial operations occupations (12.8%); service occupations (11.4%); management occupations (except farmers) (8.7%); arts, design, entertainment, sports, and media occupations (7.3%); legal occupations (5.3%)
Highways in this neighborhood: US Hwy 101 (Richardson Ave); US Hwy 101 (Van Ness Ave).
Roads and streets: Lombard St; Union St; Filbert St; Greenwich St; Lyon St; Moulton St; Pixley St; Baker St; Pierce St; Steiner St; Webster St; Broderick St; Fillmore St; Octavia St; Buchanan St; Laguna St; Gough St; Divisadero St; Scott St; Franklin St; Chestnut St; Harris Pl; Service St; Miley St; Imperial Ave; Blackstone Ct; Francisco St.
Cow Hollow neighborhood detailed profile
Crocker-Amazon neighborhood in San Francisco statistics: (Find on map)
Area: 0.451 square miles
Population: 9,505
Population density:
Median household income in 2021:
Median rent in in 2021:
Male vs Females
Median age
Housing prices:
Average estimated value of detached houses in 2021 (57.8% of all units):
Average estimated value of townhouses or other attached units in 2021 (26.9% of all units):
Most popular occupations of males: service occupations (23.1%); sales and office occupations (18.2%); construction, extraction, and maintenance occupations (9.8%); management occupations (except farmers) (7.4%); architecture and engineering occupations (5.2%); transportation occupations (5.0%); material moving occupations (5.0%)
Most popular occupations of females: service occupations (35.6%); sales and office occupations (25.9%); education, training, and library occupations (10.1%); healthcare practitioners and technical occupations (9.3%); business and financial operations occupations (5.4%); management occupations (except farmers) (3.7%); computer and mathematical occupations (2.6%)
Roads and streets: Rolph St; Mission St; Brunswick St; Morse St; Winding Way; Prague St; Pope St; Baltimore Way; Chicago Way; Munich St; Curtis St; Canyon Dr; S Hill Blvd; Allison St; Cordova St; Hanover St; Guttenberg St; Concord St; Seville St; Lowell St; Lapham Way; Drake St; Newton St; Naylor St; Naples St; Florentine St; Saddleback Dr; Athens St; Whittier St; Cross St; Robinson Dr; Stoneridge Ln; Byron Ct; Cassandra Ct; Oliver St; Polaris Way; Pretor Way; Ridge Ct; Toyon Ln; Watt Ave; Birchwood Ct; Lincoln Ct; Roemer Way; Hollywood Ct; Linda Vista Steps St; Crescio Ct; Royal Ln; Knott Ct; Bellevue Ave; Aspen Ct; Nadell Ct; Red Leaf Ct.
Roads and streets: Bellevue Ave; Pope St.
Crocker-Amazon neighborhood detailed profile
Area: 0.451 square miles
Population: 9,505
Population density:
| Crocker-Amazon: | 21,058 people per square mile |
| San Francisco: | 17,458 people per square mile |
Median household income in 2021:
| Crocker-Amazon: | $111,690 |
| San Francisco: | $121,826 |
Median rent in in 2021:
| Crocker-Amazon: | $1,728 |
| San Francisco: | $2,001 |
Male vs Females
| Males: | 4,950 |
| Females: | 4,554 |
Median age
| Males: | 41.1 years |
| Females: | 45.4 years |
Housing prices:
Average estimated value of detached houses in 2021 (57.8% of all units):
| Crocker-Amazon: | $919,159 |
| San Francisco: | $1,815,784 |
Average estimated value of townhouses or other attached units in 2021 (26.9% of all units):
| This neighborhood: | $968,112 |
| city: | $1,506,493 |
Most popular occupations of males: service occupations (23.1%); sales and office occupations (18.2%); construction, extraction, and maintenance occupations (9.8%); management occupations (except farmers) (7.4%); architecture and engineering occupations (5.2%); transportation occupations (5.0%); material moving occupations (5.0%)
Most popular occupations of females: service occupations (35.6%); sales and office occupations (25.9%); education, training, and library occupations (10.1%); healthcare practitioners and technical occupations (9.3%); business and financial operations occupations (5.4%); management occupations (except farmers) (3.7%); computer and mathematical occupations (2.6%)
Roads and streets: Rolph St; Mission St; Brunswick St; Morse St; Winding Way; Prague St; Pope St; Baltimore Way; Chicago Way; Munich St; Curtis St; Canyon Dr; S Hill Blvd; Allison St; Cordova St; Hanover St; Guttenberg St; Concord St; Seville St; Lowell St; Lapham Way; Drake St; Newton St; Naylor St; Naples St; Florentine St; Saddleback Dr; Athens St; Whittier St; Cross St; Robinson Dr; Stoneridge Ln; Byron Ct; Cassandra Ct; Oliver St; Polaris Way; Pretor Way; Ridge Ct; Toyon Ln; Watt Ave; Birchwood Ct; Lincoln Ct; Roemer Way; Hollywood Ct; Linda Vista Steps St; Crescio Ct; Royal Ln; Knott Ct; Bellevue Ave; Aspen Ct; Nadell Ct; Red Leaf Ct.
Roads and streets: Bellevue Ave; Pope St.
Crocker-Amazon neighborhood detailed profile
Deco Ghetto neighborhood in San Francisco statistics: (Find on map)
Area: 0.073 square miles
Roads and streets: Duboce Ave; Stevenson St; Valencia St; Clinton Park; McCoppin St; 14th St; Brosnan St; Elgin Park; Woodward St; Gough St; Pearl St; Colton St; Mission St; Jessie St; Guerrero St; Brady St; Pink Aly.
Deco Ghetto neighborhood detailed profile
Area: 0.073 square miles
Roads and streets: Duboce Ave; Stevenson St; Valencia St; Clinton Park; McCoppin St; 14th St; Brosnan St; Elgin Park; Woodward St; Gough St; Pearl St; Colton St; Mission St; Jessie St; Guerrero St; Brady St; Pink Aly.
Deco Ghetto neighborhood detailed profile
Diamond Heights neighborhood in San Francisco statistics: (Find on map)
Area: 0.347 square miles
Population: 1,519
Population density:
Median household income in 2021:
Median rent in in 2021:
Male vs Females
Median age
Housing prices:
Average estimated value of detached houses in 2021 (25.8% of all units):
Average estimated value of townhouses or other attached units in 2021 (22.8% of all units):
Average estimated value of housing units in 2-unit structures in 2021 (3.0% of all units):
Average estimated '21 value of housing units in 5-or-more-unit structures (8.3% of all units):
Most popular occupations of males: management occupations (except farmers) (25.0%); healthcare practitioners and technical occupations (16.1%); business and financial operations occupations (13.4%); sales and office occupations (11.3%); computer and mathematical occupations (8.5%); arts, design, entertainment, sports, and media occupations (7.7%); service occupations (4.6%)
Most popular occupations of females: management occupations (except farmers) (34.2%); sales and office occupations (18.9%); education, training, and library occupations (16.0%); business and financial operations occupations (7.5%); arts, design, entertainment, sports, and media occupations (7.4%); service occupations (7.3%); healthcare practitioners and technical occupations (4.9%)
Roads and streets: O'Shaughnessy Blvd; Portola Dr; Oshaughnessy Blvd; Amber Dr; Gold Mine Dr; Turquoise Way; Topaz Way; Bosworth St; Ora Way; Berkeley Way; Cameo Way; Duncan St; Red Rock Way; Amethyst Way; Onique Ln; Crags Ct; Quartz Way; Coralino Ln; Elk St; Jade Pl; Clipper St; Opalo Ln.
Diamond Heights neighborhood detailed profile
Area: 0.347 square miles
Population: 1,519
Population density:
| Diamond Heights: | 4,382 people per square mile |
| San Francisco: | 17,458 people per square mile |
Median household income in 2021:
| Diamond Heights: | $169,823 |
| San Francisco: | $121,826 |
Median rent in in 2021:
| Diamond Heights: | $2,888 |
| San Francisco: | $2,001 |
Male vs Females
| Males: | 765 |
| Females: | 754 |
Median age
| Males: | 46.7 years |
| Females: | 50.7 years |
Housing prices:
Average estimated value of detached houses in 2021 (25.8% of all units):
| Diamond Heights: | $1,345,853 |
| San Francisco: | $1,815,784 |
Average estimated value of townhouses or other attached units in 2021 (22.8% of all units):
| This neighborhood: | $1,305,561 |
| city: | $1,506,493 |
Average estimated value of housing units in 2-unit structures in 2021 (3.0% of all units):
| This neighborhood: | $6,425,907 |
| San Francisco: | $1,685,431 |
Average estimated '21 value of housing units in 5-or-more-unit structures (8.3% of all units):
| Diamond Heights: | $332,765 |
| San Francisco: | $1,317,001 |
Most popular occupations of males: management occupations (except farmers) (25.0%); healthcare practitioners and technical occupations (16.1%); business and financial operations occupations (13.4%); sales and office occupations (11.3%); computer and mathematical occupations (8.5%); arts, design, entertainment, sports, and media occupations (7.7%); service occupations (4.6%)
Most popular occupations of females: management occupations (except farmers) (34.2%); sales and office occupations (18.9%); education, training, and library occupations (16.0%); business and financial operations occupations (7.5%); arts, design, entertainment, sports, and media occupations (7.4%); service occupations (7.3%); healthcare practitioners and technical occupations (4.9%)
Roads and streets: O'Shaughnessy Blvd; Portola Dr; Oshaughnessy Blvd; Amber Dr; Gold Mine Dr; Turquoise Way; Topaz Way; Bosworth St; Ora Way; Berkeley Way; Cameo Way; Duncan St; Red Rock Way; Amethyst Way; Onique Ln; Crags Ct; Quartz Way; Coralino Ln; Elk St; Jade Pl; Clipper St; Opalo Ln.
Diamond Heights neighborhood detailed profile
Dogpatch neighborhood in San Francisco statistics: (Find on map)
Area: 0.175 square miles
Population: 1,584
Population density:
Median household income in 2021:
Median rent in in 2021:
Male vs Females
Median age
Housing prices:
Average estimated value of detached houses in 2021 (4.7% of all units):
Average estimated value of townhouses or other attached units in 2021 (2.3% of all units):
Average estimated value of housing units in 2-unit structures in 2021 (6.4% of all units):
Average estimated '21 value of housing units in 3-to-4-unit structures (4.4% of all units):
Average estimated '21 value of housing units in 5-or-more-unit structures (55.6% of all units):
Most popular occupations of males: management occupations (except farmers) (29.6%); computer and mathematical occupations (20.9%); sales and office occupations (8.1%); business and financial operations occupations (7.5%); arts, design, entertainment, sports, and media occupations (7.0%); service occupations (5.7%); life, physical, and social science occupations (5.2%)
Most popular occupations of females: management occupations (except farmers) (24.6%); healthcare practitioners and technical occupations (15.0%); computer and mathematical occupations (14.2%); business and financial operations occupations (11.5%); arts, design, entertainment, sports, and media occupations (7.6%); service occupations (7.3%); life, physical, and social science occupations (6.6%)
Limited-access highways (interstate or state) in this neighborhood: I- 280.
Roads and streets: 3rd St; Iowa St; Indiana St; Tennessee St; Illinois St; Minnesota St; 20th St; 19th St; 22nd St; 18th St; Mariposa St; Tubbs St.
Railroad features: Union Pacific RR.
Dogpatch neighborhood detailed profile
Area: 0.175 square miles
Population: 1,584
Population density:
| Dogpatch: | 9,036 people per square mile |
| San Francisco: | 17,458 people per square mile |
Median household income in 2021:
| Dogpatch: | $214,617 |
| San Francisco: | $121,826 |
Median rent in in 2021:
| Dogpatch: | $3,071 |
| San Francisco: | $2,001 |
Male vs Females
| Males: | 865 |
| Females: | 719 |
Median age
| Males: | 33.2 years |
| Females: | 35.8 years |
Housing prices:
Average estimated value of detached houses in 2021 (4.7% of all units):
| Dogpatch: | $1,319,055 |
| San Francisco: | $1,815,784 |
Average estimated value of townhouses or other attached units in 2021 (2.3% of all units):
| This neighborhood: | $2,001,961 |
| city: | $1,506,493 |
Average estimated value of housing units in 2-unit structures in 2021 (6.4% of all units):
| This neighborhood: | $1,845,283 |
| San Francisco: | $1,685,431 |
Average estimated '21 value of housing units in 3-to-4-unit structures (4.4% of all units):
| Dogpatch: | $1,876,596 |
| city: | $1,521,789 |
Average estimated '21 value of housing units in 5-or-more-unit structures (55.6% of all units):
| Dogpatch: | $1,109,028 |
| San Francisco: | $1,317,001 |
Most popular occupations of males: management occupations (except farmers) (29.6%); computer and mathematical occupations (20.9%); sales and office occupations (8.1%); business and financial operations occupations (7.5%); arts, design, entertainment, sports, and media occupations (7.0%); service occupations (5.7%); life, physical, and social science occupations (5.2%)
Most popular occupations of females: management occupations (except farmers) (24.6%); healthcare practitioners and technical occupations (15.0%); computer and mathematical occupations (14.2%); business and financial operations occupations (11.5%); arts, design, entertainment, sports, and media occupations (7.6%); service occupations (7.3%); life, physical, and social science occupations (6.6%)
Limited-access highways (interstate or state) in this neighborhood: I- 280.
Roads and streets: 3rd St; Iowa St; Indiana St; Tennessee St; Illinois St; Minnesota St; 20th St; 19th St; 22nd St; 18th St; Mariposa St; Tubbs St.
Railroad features: Union Pacific RR.
Dogpatch neighborhood detailed profile
Downtown neighborhood in San Francisco statistics: (Find on map)
Area: 0.338 square miles
Population: 8,153
Population density:
Median household income in 2021:
Median rent in in 2021:
Male vs Females
Median age
Average estimated '21 value of housing units in 5-or-more-unit structures (14.9% of all units):
Most popular occupations of males: management occupations (except farmers) (19.6%); service occupations (15.6%); business and financial operations occupations (14.3%); computer and mathematical occupations (11.5%); sales and office occupations (6.5%); education, training, and library occupations (6.4%); arts, design, entertainment, sports, and media occupations (4.3%)
Most popular occupations of females: sales and office occupations (22.7%); community and social services occupations (13.9%); business and financial operations occupations (12.6%); management occupations (except farmers) (11.3%); arts, design, entertainment, sports, and media occupations (9.6%); service occupations (6.9%); legal occupations (6.1%)
Roads and streets: Post St; Geary St; Market St; Sutter St; Bush St; Pine St; Mason St; Stockton St; Powell St; Ofarrell St; Leavenworth St; Hyde St; Jones St; Taylor St; Larkin St; Ellis St; Grant Ave; Cyril Magnin St; Eddy St; Cosmo Pl; Campton Pl; Maiden Ln; Derby St; Shannon St; Dashiell Hammett St (Monore); Hallidie Plz; Elwood St; Nob Hill Cir; Isadora Duncan Ln; Fella Pl; Anson Pl; Savings Union Pl; Burritt St; Tillman Pl; Robert Kirk Ln; Vine Ter; Meacham Pl; Nob Hill Pl; Hobart Aly; Colin Pl; Chelsea Pl; Turk Blvd (Turk St); Cable Car Turnaround; Touchard St; Trader Vic Aly; Ophir Aly; 4th St.
Downtown neighborhood detailed profile
Area: 0.338 square miles
Population: 8,153
Population density:
| Downtown: | 24,101 people per square mile |
| San Francisco: | 17,458 people per square mile |
Median household income in 2021:
| Downtown: | $73,960 |
| San Francisco: | $121,826 |
Median rent in in 2021:
| Downtown: | $1,631 |
| San Francisco: | $2,001 |
Male vs Females
| Males: | 4,103 |
| Females: | 4,049 |
Median age
| Males: | 40.5 years |
| Females: | 35.6 years |
Average estimated '21 value of housing units in 5-or-more-unit structures (14.9% of all units):
| Downtown: | $2,056,207 |
| San Francisco: | $1,317,001 |
Most popular occupations of males: management occupations (except farmers) (19.6%); service occupations (15.6%); business and financial operations occupations (14.3%); computer and mathematical occupations (11.5%); sales and office occupations (6.5%); education, training, and library occupations (6.4%); arts, design, entertainment, sports, and media occupations (4.3%)
Most popular occupations of females: sales and office occupations (22.7%); community and social services occupations (13.9%); business and financial operations occupations (12.6%); management occupations (except farmers) (11.3%); arts, design, entertainment, sports, and media occupations (9.6%); service occupations (6.9%); legal occupations (6.1%)
Roads and streets: Post St; Geary St; Market St; Sutter St; Bush St; Pine St; Mason St; Stockton St; Powell St; Ofarrell St; Leavenworth St; Hyde St; Jones St; Taylor St; Larkin St; Ellis St; Grant Ave; Cyril Magnin St; Eddy St; Cosmo Pl; Campton Pl; Maiden Ln; Derby St; Shannon St; Dashiell Hammett St (Monore); Hallidie Plz; Elwood St; Nob Hill Cir; Isadora Duncan Ln; Fella Pl; Anson Pl; Savings Union Pl; Burritt St; Tillman Pl; Robert Kirk Ln; Vine Ter; Meacham Pl; Nob Hill Pl; Hobart Aly; Colin Pl; Chelsea Pl; Turk Blvd (Turk St); Cable Car Turnaround; Touchard St; Trader Vic Aly; Ophir Aly; 4th St.
Downtown neighborhood detailed profile
Duboce Triangle neighborhood in San Francisco statistics: (Find on map)
Area: 0.141 square miles
Population: 2,892
Population density:
Median household income in 2021:
Median rent in in 2021:
Male vs Females
Median age
Housing prices:
Average estimated value of detached houses in 2021 (11.1% of all units):
Average estimated value of townhouses or other attached units in 2021 (4.6% of all units):
Average estimated value of housing units in 2-unit structures in 2021 (11.7% of all units):
Average estimated '21 value of housing units in 3-to-4-unit structures (22.7% of all units):
Average estimated '21 value of housing units in 5-or-more-unit structures (24.9% of all units):
Most popular occupations of males: management occupations (except farmers) (25.2%); computer and mathematical occupations (15.2%); sales and office occupations (13.1%); business and financial operations occupations (10.9%); service occupations (10.5%); arts, design, entertainment, sports, and media occupations (9.9%); legal occupations (3.1%)
Most popular occupations of females: management occupations (except farmers) (27.9%); business and financial operations occupations (16.5%); education, training, and library occupations (9.6%); arts, design, entertainment, sports, and media occupations (7.8%); computer and mathematical occupations (7.7%); healthcare practitioners and technical occupations (7.6%); service occupations (7.6%)
Roads and streets: Market St; Duboce Ave; Castro St; 14th St; Noe St; 15th St; Henry St; Sanchez St; 16th St; Beaver St; Belcher St; Church St; Walter St; Reservoir St; Divisadero St; Boynton Ct; Dolores St.
Duboce Triangle neighborhood detailed profile
Area: 0.141 square miles
Population: 2,892
Population density:
| Duboce Triangle: | 20,482 people per square mile |
| San Francisco: | 17,458 people per square mile |
Median household income in 2021:
| Duboce Triangle: | $202,665 |
| San Francisco: | $121,826 |
Median rent in in 2021:
| Duboce Triangle: | $1,833 |
| San Francisco: | $2,001 |
Male vs Females
| Males: | 1,817 |
| Females: | 1,075 |
Median age
| Males: | 39.0 years |
| Females: | 39.6 years |
Housing prices:
Average estimated value of detached houses in 2021 (11.1% of all units):
| Duboce Triangle: | $898,966 |
| San Francisco: | $1,815,784 |
Average estimated value of townhouses or other attached units in 2021 (4.6% of all units):
| This neighborhood: | $2,397,455 |
| city: | $1,506,493 |
Average estimated value of housing units in 2-unit structures in 2021 (11.7% of all units):
| This neighborhood: | $883,333 |
| San Francisco: | $1,685,431 |
Average estimated '21 value of housing units in 3-to-4-unit structures (22.7% of all units):
| Duboce Triangle: | $584,314 |
| city: | $1,521,789 |
Average estimated '21 value of housing units in 5-or-more-unit structures (24.9% of all units):
| Duboce Triangle: | $1,200,538 |
| San Francisco: | $1,317,001 |
Most popular occupations of males: management occupations (except farmers) (25.2%); computer and mathematical occupations (15.2%); sales and office occupations (13.1%); business and financial operations occupations (10.9%); service occupations (10.5%); arts, design, entertainment, sports, and media occupations (9.9%); legal occupations (3.1%)
Most popular occupations of females: management occupations (except farmers) (27.9%); business and financial operations occupations (16.5%); education, training, and library occupations (9.6%); arts, design, entertainment, sports, and media occupations (7.8%); computer and mathematical occupations (7.7%); healthcare practitioners and technical occupations (7.6%); service occupations (7.6%)
Roads and streets: Market St; Duboce Ave; Castro St; 14th St; Noe St; 15th St; Henry St; Sanchez St; 16th St; Beaver St; Belcher St; Church St; Walter St; Reservoir St; Divisadero St; Boynton Ct; Dolores St.
Duboce Triangle neighborhood detailed profile
Embarcadero neighborhood in San Francisco statistics: (Find on map)
Area: 0.280 square miles
Population: 1,599
Population density:
Median household income in 2021:
Median rent in in 2021:
Male vs Females
Median age
Average estimated '21 value of housing units in 5-or-more-unit structures (69.5% of all units):
Most popular occupations of males: management occupations (except farmers) (21.8%); computer and mathematical occupations (18.8%); service occupations (13.4%); business and financial operations occupations (13.0%); legal occupations (10.4%); sales and office occupations (9.1%); arts, design, entertainment, sports, and media occupations (6.3%)
Most popular occupations of females: sales and office occupations (27.1%); service occupations (18.9%); healthcare practitioners and technical occupations (13.5%); management occupations (except farmers) (10.0%); business and financial operations occupations (10.0%); computer and mathematical occupations (7.8%); legal occupations (4.4%)
Roads and streets: The Embarcadero; Front St; Market St; Davis St; Sacramento St; Clay St; Drumm St; California St; Hinckley Walk (Hinckle Walk, Washington St); Pine St; Battery St; Pacific Ave; Jackson St; Broadway St (Broadway); Steuart St; Vallejo St; Halleck St; Green St; Mission St; The Embarcadero (Pier); Davis Ct; Union St.
Embarcadero neighborhood detailed profile
Area: 0.280 square miles
Population: 1,599
Population density:
| Embarcadero: | 5,703 people per square mile |
| San Francisco: | 17,458 people per square mile |
Median household income in 2021:
| Embarcadero: | $155,028 |
| San Francisco: | $121,826 |
Median rent in in 2021:
| Embarcadero: | $2,909 |
| San Francisco: | $2,001 |
Male vs Females
| Males: | 846 |
| Females: | 752 |
Median age
| Males: | 43.5 years |
| Females: | 42.7 years |
Average estimated '21 value of housing units in 5-or-more-unit structures (69.5% of all units):
| Embarcadero: | $1,380,758 |
| San Francisco: | $1,317,001 |
Most popular occupations of males: management occupations (except farmers) (21.8%); computer and mathematical occupations (18.8%); service occupations (13.4%); business and financial operations occupations (13.0%); legal occupations (10.4%); sales and office occupations (9.1%); arts, design, entertainment, sports, and media occupations (6.3%)
Most popular occupations of females: sales and office occupations (27.1%); service occupations (18.9%); healthcare practitioners and technical occupations (13.5%); management occupations (except farmers) (10.0%); business and financial operations occupations (10.0%); computer and mathematical occupations (7.8%); legal occupations (4.4%)
Roads and streets: The Embarcadero; Front St; Market St; Davis St; Sacramento St; Clay St; Drumm St; California St; Hinckley Walk (Hinckle Walk, Washington St); Pine St; Battery St; Pacific Ave; Jackson St; Broadway St (Broadway); Steuart St; Vallejo St; Halleck St; Green St; Mission St; The Embarcadero (Pier); Davis Ct; Union St.
Embarcadero neighborhood detailed profile
Excelsior neighborhood in San Francisco statistics: (Find on map)
Area: 1.073 square miles
Population: 28,906
Population density:
Median household income in 2021:
Median rent in in 2021:
Male vs Females
Median age
Housing prices:
Average estimated value of detached houses in 2021 (51.6% of all units):
Average estimated value of townhouses or other attached units in 2021 (32.1% of all units):
Most popular occupations of males: service occupations (23.5%); sales and office occupations (15.5%); management occupations (except farmers) (10.1%); construction, extraction, and maintenance occupations (9.3%); computer and mathematical occupations (8.6%); transportation occupations (5.2%); production occupations (5.1%)
Most popular occupations of females: service occupations (25.2%); sales and office occupations (24.4%); management occupations (except farmers) (9.8%); education, training, and library occupations (8.5%); business and financial operations occupations (7.1%); healthcare practitioners and technical occupations (5.3%); production occupations (4.7%)
Limited-access highways (interstate or state) in this neighborhood: I- 280.
Roads and streets: Mission St; Geneva Ave; Vienna St; Athens St; Naples St; Edinburgh St; Madrid St; Lisbon St; Persia Ave; Brazil Ave; London St; Paris St; Moscow St; Silver Ave; Russia Ave; Avalon Ave; Excelsior Ave; Maynard St; France Ave; Amazon Ave; Italy Ave; Peru Ave; Trumbull St; Munich St; Prague St; Ney St; Gladstone Dr; Madison St; Cambridge St; la Grande Ave; Dublin St; Alemany Blvd; Valmar Ter; Congdon St; Mansell St; Ina Ct; Burrows St; Stoneybrook Ave; Craut St; Stoneyford Ave; W View Ave; Silliman St; Felton St; Kenny Aly; Sunglow Ln; Davenport Ln; Mansfield St; Stoneridge Ln.
Excelsior neighborhood detailed profile
Area: 1.073 square miles
Population: 28,906
Population density:
| Excelsior: | 26,935 people per square mile |
| San Francisco: | 17,458 people per square mile |
Median household income in 2021:
| Excelsior: | $109,071 |
| San Francisco: | $121,826 |
Median rent in in 2021:
| Excelsior: | $1,949 |
| San Francisco: | $2,001 |
Male vs Females
| Males: | 14,248 |
| Females: | 14,658 |
Median age
| Males: | 40.3 years |
| Females: | 44.1 years |
Housing prices:
Average estimated value of detached houses in 2021 (51.6% of all units):
| Excelsior: | $1,011,306 |
| San Francisco: | $1,815,784 |
Average estimated value of townhouses or other attached units in 2021 (32.1% of all units):
| This neighborhood: | $1,015,358 |
| city: | $1,506,493 |
Most popular occupations of males: service occupations (23.5%); sales and office occupations (15.5%); management occupations (except farmers) (10.1%); construction, extraction, and maintenance occupations (9.3%); computer and mathematical occupations (8.6%); transportation occupations (5.2%); production occupations (5.1%)
Most popular occupations of females: service occupations (25.2%); sales and office occupations (24.4%); management occupations (except farmers) (9.8%); education, training, and library occupations (8.5%); business and financial operations occupations (7.1%); healthcare practitioners and technical occupations (5.3%); production occupations (4.7%)
Limited-access highways (interstate or state) in this neighborhood: I- 280.
Roads and streets: Mission St; Geneva Ave; Vienna St; Athens St; Naples St; Edinburgh St; Madrid St; Lisbon St; Persia Ave; Brazil Ave; London St; Paris St; Moscow St; Silver Ave; Russia Ave; Avalon Ave; Excelsior Ave; Maynard St; France Ave; Amazon Ave; Italy Ave; Peru Ave; Trumbull St; Munich St; Prague St; Ney St; Gladstone Dr; Madison St; Cambridge St; la Grande Ave; Dublin St; Alemany Blvd; Valmar Ter; Congdon St; Mansell St; Ina Ct; Burrows St; Stoneybrook Ave; Craut St; Stoneyford Ave; W View Ave; Silliman St; Felton St; Kenny Aly; Sunglow Ln; Davenport Ln; Mansfield St; Stoneridge Ln.
Excelsior neighborhood detailed profile
Financial District neighborhood in San Francisco statistics: (Find on map)
Area: 0.460 square miles
Population: 4,980
Population density:
Median household income in 2021:
Median rent in in 2021:
Male vs Females
Median age
Average estimated '21 value of housing units in 5-or-more-unit structures (37.1% of all units):
Most popular occupations of males: sales and office occupations (18.4%); service occupations (15.6%); computer and mathematical occupations (12.2%); management occupations (except farmers) (10.8%); arts, design, entertainment, sports, and media occupations (6.8%); business and financial operations occupations (6.6%); construction, extraction, and maintenance occupations (6.6%)
Most popular occupations of females: service occupations (25.5%); sales and office occupations (25.1%); management occupations (except farmers) (13.2%); education, training, and library occupations (8.8%); business and financial operations occupations (6.2%); healthcare practitioners and technical occupations (6.0%); production occupations (5.3%)
Roads and streets: Market St; Stockton St; Sacramento St; Clay St; Grant Ave; California St; Pacific Ave; Jackson St; Kearny St; Pine St; Broadway St (Broadway); Montgomery St; Sansome St; Bush St; Battery St; Washington St; Sutter St; Commercial St; Hinckley Walk (Hinckle Walk, Washington St); Front St; Davis St; The Embarcadero; Post St; Columbus Ave; Drumm St; Merchant St; Halleck St; Maiden Ln; Geary St; Leidesdorff St; Ofarrell St; Waverly Pl; Gold St; Campton Pl; Quincy St; Harlan Pl; Lick Pl; Belden Pl; Petrarch Pl; St George Aly; Claude Ln; Trinity Pl (Trinity St); Spring St; Osgood Pl; Custom House Pl; Hotaling Pl (Hotaling St); Hangah St; Beckett St; Spofford St; Ross Aly; Wentworth Pl (Wentworth St); Walter U Lum Pl; Ils Ln; The Embarcadero (Pier); Jack Kerouac Aly; Stevens Aly; Nottingham Pl; Hardie Pl; Stark St; Vinton Ct; Gibb St; Sabin Pl; Bartol St; Rowland St; Savings Union Pl; Emma St; Tillman Pl; Mark Ln; Robert Kirk Ln; Treasury Pl; Mills Pl; Century Pl; Chatham Pl; Vermehr Pl; Saint Louis Aly; Cooper Aly; Jason Ct; Duncombe Aly; Davis Ct; Exchange St; Brooklyn Pl; Old Chinatown Ln; Pelton Pl; Pontiac St; Verdi Pl; Saroyan Pl; 4th St.
Financial District neighborhood detailed profile
Area: 0.460 square miles
Population: 4,980
Population density:
| Financial District (FiDi): | 10,826 people per square mile |
| San Francisco: | 17,458 people per square mile |
Median household income in 2021:
| Financial District (FiDi): | $75,395 |
| San Francisco: | $121,826 |
Median rent in in 2021:
| Financial District (FiDi): | $1,368 |
| San Francisco: | $2,001 |
Male vs Females
| Males: | 2,496 |
| Females: | 2,484 |
Median age
| Males: | 46.0 years |
| Females: | 49.0 years |
Average estimated '21 value of housing units in 5-or-more-unit structures (37.1% of all units):
| Financial District (FiDi): | $1,063,432 |
| San Francisco: | $1,317,001 |
Most popular occupations of males: sales and office occupations (18.4%); service occupations (15.6%); computer and mathematical occupations (12.2%); management occupations (except farmers) (10.8%); arts, design, entertainment, sports, and media occupations (6.8%); business and financial operations occupations (6.6%); construction, extraction, and maintenance occupations (6.6%)
Most popular occupations of females: service occupations (25.5%); sales and office occupations (25.1%); management occupations (except farmers) (13.2%); education, training, and library occupations (8.8%); business and financial operations occupations (6.2%); healthcare practitioners and technical occupations (6.0%); production occupations (5.3%)
Roads and streets: Market St; Stockton St; Sacramento St; Clay St; Grant Ave; California St; Pacific Ave; Jackson St; Kearny St; Pine St; Broadway St (Broadway); Montgomery St; Sansome St; Bush St; Battery St; Washington St; Sutter St; Commercial St; Hinckley Walk (Hinckle Walk, Washington St); Front St; Davis St; The Embarcadero; Post St; Columbus Ave; Drumm St; Merchant St; Halleck St; Maiden Ln; Geary St; Leidesdorff St; Ofarrell St; Waverly Pl; Gold St; Campton Pl; Quincy St; Harlan Pl; Lick Pl; Belden Pl; Petrarch Pl; St George Aly; Claude Ln; Trinity Pl (Trinity St); Spring St; Osgood Pl; Custom House Pl; Hotaling Pl (Hotaling St); Hangah St; Beckett St; Spofford St; Ross Aly; Wentworth Pl (Wentworth St); Walter U Lum Pl; Ils Ln; The Embarcadero (Pier); Jack Kerouac Aly; Stevens Aly; Nottingham Pl; Hardie Pl; Stark St; Vinton Ct; Gibb St; Sabin Pl; Bartol St; Rowland St; Savings Union Pl; Emma St; Tillman Pl; Mark Ln; Robert Kirk Ln; Treasury Pl; Mills Pl; Century Pl; Chatham Pl; Vermehr Pl; Saint Louis Aly; Cooper Aly; Jason Ct; Duncombe Aly; Davis Ct; Exchange St; Brooklyn Pl; Old Chinatown Ln; Pelton Pl; Pontiac St; Verdi Pl; Saroyan Pl; 4th St.
Financial District neighborhood detailed profile
Financial District South neighborhood in San Francisco statistics: (Find on map)
Area: 0.552 square miles
Population: 3,792
Population density:
Median household income in 2021:
Median rent in in 2021:
Male vs Females
Median age
Most popular occupations of males: service occupations (41.1%); management occupations (except farmers) (23.4%); computer and mathematical occupations (13.4%); education, training, and library occupations (6.7%); business and financial operations occupations (4.8%); transportation occupations (4.4%); sales and office occupations (2.1%)
Most popular occupations of females: sales and office occupations (24.2%); service occupations (20.1%); healthcare practitioners and technical occupations (12.4%); business and financial operations occupations (12.1%); management occupations (except farmers) (11.9%); education, training, and library occupations (4.6%); computer and mathematical occupations (4.0%)
Limited-access highways (interstate or state) in this neighborhood: I- 80 (James Lick Fwy).
Roads and streets: Howard St; Mission St; Folsom St; Harrison St; 3rd St; 2nd St; 4th St; Jessie St; 5th St; Bryant St; Minna St; 1st St; Perry St; Clementina St; Stevenson St; Tehama St; Natoma St; Beale St; S Park Ave; Stillman St; Fremont St; Hawthorne St; Welsh St; Freelon St; New Montgomery St; Shipley St; Clara St; Rizal St; Essex St; Guy Pl; Lansing St; Varney Pl; Ecker Pl (Ecker St); Masset Pl; Zoe St; Annie St; Ritch St (Lapu St); Jack London Aly (Center St); Bonifacio St; Saint Francis Pl; Holland Ct; Dow Pl; Aldrich Aly; Ecker St; Anthony St; Elim St; Hampton Pl; Grote Pl; Zeno Pl; Opera Aly; Malden Aly; Mabini St; Shaw Aly; Vassar Pl; Kaplan Ln; Gallagher Ln; Tandang Sora St; Tenny Pl; Oscar Aly; Sloan Aly.
Financial District South neighborhood detailed profile
Area: 0.552 square miles
Population: 3,792
Population density:
| Financial District South: | 6,873 people per square mile |
| San Francisco: | 17,458 people per square mile |
Median household income in 2021:
| Financial District South: | $110,071 |
| San Francisco: | $121,826 |
Median rent in in 2021:
| Financial District South: | $1,468 |
| San Francisco: | $2,001 |
Male vs Females
| Males: | 2,294 |
| Females: | 1,497 |
Median age
| Males: | 39.5 years |
| Females: | 36.8 years |
Most popular occupations of males: service occupations (41.1%); management occupations (except farmers) (23.4%); computer and mathematical occupations (13.4%); education, training, and library occupations (6.7%); business and financial operations occupations (4.8%); transportation occupations (4.4%); sales and office occupations (2.1%)
Most popular occupations of females: sales and office occupations (24.2%); service occupations (20.1%); healthcare practitioners and technical occupations (12.4%); business and financial operations occupations (12.1%); management occupations (except farmers) (11.9%); education, training, and library occupations (4.6%); computer and mathematical occupations (4.0%)
Limited-access highways (interstate or state) in this neighborhood: I- 80 (James Lick Fwy).
Roads and streets: Howard St; Mission St; Folsom St; Harrison St; 3rd St; 2nd St; 4th St; Jessie St; 5th St; Bryant St; Minna St; 1st St; Perry St; Clementina St; Stevenson St; Tehama St; Natoma St; Beale St; S Park Ave; Stillman St; Fremont St; Hawthorne St; Welsh St; Freelon St; New Montgomery St; Shipley St; Clara St; Rizal St; Essex St; Guy Pl; Lansing St; Varney Pl; Ecker Pl (Ecker St); Masset Pl; Zoe St; Annie St; Ritch St (Lapu St); Jack London Aly (Center St); Bonifacio St; Saint Francis Pl; Holland Ct; Dow Pl; Aldrich Aly; Ecker St; Anthony St; Elim St; Hampton Pl; Grote Pl; Zeno Pl; Opera Aly; Malden Aly; Mabini St; Shaw Aly; Vassar Pl; Kaplan Ln; Gallagher Ln; Tandang Sora St; Tenny Pl; Oscar Aly; Sloan Aly.
Financial District South neighborhood detailed profile
Fisherman's Wharf neighborhood in San Francisco statistics: (Find on map)
Area: 0.222 square miles
Population: 4,863
Population density:
Median household income in 2021:
Median rent in in 2021:
Male vs Females
Median age
Most popular occupations of males: management occupations (except farmers) (20.8%); transportation occupations (15.7%); architecture and engineering occupations (14.6%); business and financial operations occupations (12.3%); community and social services occupations (10.6%); service occupations (9.3%); computer and mathematical occupations (6.6%)
Most popular occupations of females: legal occupations (39.3%); business and financial operations occupations (23.7%); sales and office occupations (22.9%); education, training, and library occupations (11.4%); management occupations (except farmers) (10.7%); healthcare practitioners and technical occupations (8.6%); service occupations (8.6%)
Roads and streets: The Embarcadero; N Point St; Beach St; Jefferson St; Hyde St; Taylor St; Fishermans Wharf; Leavenworth St; Jones St; Powell St; Mason St; Columbus Ave; Polk St; Stockton St; Grant Ave; Larkin St; Tonquin St.
Fisherman's Wharf neighborhood detailed profile
Area: 0.222 square miles
Population: 4,863
Population density:
| Fisherman's Wharf: | 21,952 people per square mile |
| San Francisco: | 17,458 people per square mile |
Median household income in 2021:
| Fisherman's Wharf: | $136,643 |
| San Francisco: | $121,826 |
Median rent in in 2021:
| Fisherman's Wharf: | $1,300 |
| San Francisco: | $2,001 |
Male vs Females
| Males: | 2,971 |
| Females: | 1,891 |
Median age
| Males: | 49.7 years |
| Females: | 60.4 years |
Most popular occupations of males: management occupations (except farmers) (20.8%); transportation occupations (15.7%); architecture and engineering occupations (14.6%); business and financial operations occupations (12.3%); community and social services occupations (10.6%); service occupations (9.3%); computer and mathematical occupations (6.6%)
Most popular occupations of females: legal occupations (39.3%); business and financial operations occupations (23.7%); sales and office occupations (22.9%); education, training, and library occupations (11.4%); management occupations (except farmers) (10.7%); healthcare practitioners and technical occupations (8.6%); service occupations (8.6%)
Roads and streets: The Embarcadero; N Point St; Beach St; Jefferson St; Hyde St; Taylor St; Fishermans Wharf; Leavenworth St; Jones St; Powell St; Mason St; Columbus Ave; Polk St; Stockton St; Grant Ave; Larkin St; Tonquin St.
Fisherman's Wharf neighborhood detailed profile
Forest Hill neighborhood in San Francisco statistics: (Find on map)
Area: 0.285 square miles
Population: 3,317
Population density:
Median household income in 2021:
Median rent in in 2021:
Male vs Females
Median age
Housing prices:
Average estimated value of detached houses in 2021 (76.1% of all units):
Average estimated value of townhouses or other attached units in 2021 (26.9% of all units):
Average estimated value of housing units in 2-unit structures in 2021 (11.2% of all units):
Most popular occupations of males: computer and mathematical occupations (21.4%); legal occupations (13.6%); management occupations (except farmers) (12.3%); service occupations (9.7%); healthcare practitioners and technical occupations (9.2%); business and financial operations occupations (9.0%); sales and office occupations (8.4%)
Most popular occupations of females: healthcare practitioners and technical occupations (19.5%); sales and office occupations (16.7%); management occupations (except farmers) (12.7%); legal occupations (11.5%); business and financial operations occupations (11.2%); education, training, and library occupations (6.2%); service occupations (5.8%)
Roads and streets: Magellan Ave; Pacheco St; Laguna Honda Blvd; Castenada Ave; 9th Ave; San Marcos Ave; Dorantes Ave; Mendosa Ave; 12th Ave; Alton Ave; Sotelo Ave; 10th Ave; Dewey Blvd; 8th Ave; Quintara St; Marcela Ave; Lopez Ave; Montalvo Ave; Santa Rita Ave; Linares Ave; Ventura Ave; Path St; Forest Hill Path; Sola Ave; Mesa Ave; Cortes Ave; Plaza St; Cragmont Ave; Gateview Ct.
Forest Hill neighborhood detailed profile
Area: 0.285 square miles
Population: 3,317
Population density:
| Forest Hill: | 11,645 people per square mile |
| San Francisco: | 17,458 people per square mile |
Median household income in 2021:
| Forest Hill: | $172,261 |
| San Francisco: | $121,826 |
Median rent in in 2021:
| Forest Hill: | $2,418 |
| San Francisco: | $2,001 |
Male vs Females
| Males: | 1,628 |
| Females: | 1,689 |
Median age
| Males: | 48.8 years |
| Females: | 52.4 years |
Housing prices:
Average estimated value of detached houses in 2021 (76.1% of all units):
| Forest Hill: | $2,140,879 |
| San Francisco: | $1,815,784 |
Average estimated value of townhouses or other attached units in 2021 (26.9% of all units):
| This neighborhood: | $1,586,364 |
| city: | $1,506,493 |
Average estimated value of housing units in 2-unit structures in 2021 (11.2% of all units):
| This neighborhood: | $658,080 |
| San Francisco: | $1,685,431 |
Most popular occupations of males: computer and mathematical occupations (21.4%); legal occupations (13.6%); management occupations (except farmers) (12.3%); service occupations (9.7%); healthcare practitioners and technical occupations (9.2%); business and financial operations occupations (9.0%); sales and office occupations (8.4%)
Most popular occupations of females: healthcare practitioners and technical occupations (19.5%); sales and office occupations (16.7%); management occupations (except farmers) (12.7%); legal occupations (11.5%); business and financial operations occupations (11.2%); education, training, and library occupations (6.2%); service occupations (5.8%)
Roads and streets: Magellan Ave; Pacheco St; Laguna Honda Blvd; Castenada Ave; 9th Ave; San Marcos Ave; Dorantes Ave; Mendosa Ave; 12th Ave; Alton Ave; Sotelo Ave; 10th Ave; Dewey Blvd; 8th Ave; Quintara St; Marcela Ave; Lopez Ave; Montalvo Ave; Santa Rita Ave; Linares Ave; Ventura Ave; Path St; Forest Hill Path; Sola Ave; Mesa Ave; Cortes Ave; Plaza St; Cragmont Ave; Gateview Ct.
Forest Hill neighborhood detailed profile
Forest Knolls neighborhood in San Francisco statistics: (Find on map)
Area: 0.334 square miles
Population: 1,673
Population density:
Median household income in 2021:
Median rent in in 2021:
Male vs Females
Median age
Housing prices:
Average estimated value of detached houses in 2021 (52.0% of all units):
Average estimated value of townhouses or other attached units in 2021 (11.1% of all units):
Average estimated value of housing units in 2-unit structures in 2021 (24.1% of all units):
Average estimated '21 value of housing units in 3-to-4-unit structures (3.8% of all units):
Average estimated '21 value of housing units in 5-or-more-unit structures (26.8% of all units):
Most popular occupations of males: management occupations (except farmers) (29.1%); computer and mathematical occupations (22.2%); life, physical, and social science occupations (8.6%); arts, design, entertainment, sports, and media occupations (8.5%); healthcare practitioners and technical occupations (7.9%); business and financial operations occupations (7.4%); education, training, and library occupations (4.9%)
Most popular occupations of females: business and financial operations occupations (22.8%); management occupations (except farmers) (21.2%); sales and office occupations (16.9%); healthcare practitioners and technical occupations (14.5%); education, training, and library occupations (6.3%); computer and mathematical occupations (5.1%); arts, design, entertainment, sports, and media occupations (5.0%)
Roads and streets: Clarendon Ave; Warren Dr; Oak Park Dr; Christopher Dr; Crestmont Dr; Upper Svc Rd; Galewood Cir; Johnstone Dr; Locksley Ave; Behr Ave; Forest Knolls Dr; Devonshire Way; Clarendon Woods Ave; Ashwood Ln; Oakhurst Ln; Blairwood Ln; Woodhaven Ct; Adolph Sutro Ct; Glenhaven Ln; Lake Forest Ct.
Forest Knolls neighborhood detailed profile
Area: 0.334 square miles
Population: 1,673
Population density:
| Forest Knolls: | 5,013 people per square mile |
| San Francisco: | 17,458 people per square mile |
Median household income in 2021:
| Forest Knolls: | $192,587 |
| San Francisco: | $121,826 |
Median rent in in 2021:
| Forest Knolls: | $3,089 |
| San Francisco: | $2,001 |
Male vs Females
| Males: | 751 |
| Females: | 921 |
Median age
| Males: | 45.5 years |
| Females: | 48.8 years |
Housing prices:
Average estimated value of detached houses in 2021 (52.0% of all units):
| Forest Knolls: | $1,362,231 |
| San Francisco: | $1,815,784 |
Average estimated value of townhouses or other attached units in 2021 (11.1% of all units):
| This neighborhood: | $1,043,631 |
| city: | $1,506,493 |
Average estimated value of housing units in 2-unit structures in 2021 (24.1% of all units):
| This neighborhood: | $1,072,894 |
| San Francisco: | $1,685,431 |
Average estimated '21 value of housing units in 3-to-4-unit structures (3.8% of all units):
| Forest Knolls: | $1,276,190 |
| city: | $1,521,789 |
Average estimated '21 value of housing units in 5-or-more-unit structures (26.8% of all units):
| Forest Knolls: | $578,550 |
| San Francisco: | $1,317,001 |
Most popular occupations of males: management occupations (except farmers) (29.1%); computer and mathematical occupations (22.2%); life, physical, and social science occupations (8.6%); arts, design, entertainment, sports, and media occupations (8.5%); healthcare practitioners and technical occupations (7.9%); business and financial operations occupations (7.4%); education, training, and library occupations (4.9%)
Most popular occupations of females: business and financial operations occupations (22.8%); management occupations (except farmers) (21.2%); sales and office occupations (16.9%); healthcare practitioners and technical occupations (14.5%); education, training, and library occupations (6.3%); computer and mathematical occupations (5.1%); arts, design, entertainment, sports, and media occupations (5.0%)
Roads and streets: Clarendon Ave; Warren Dr; Oak Park Dr; Christopher Dr; Crestmont Dr; Upper Svc Rd; Galewood Cir; Johnstone Dr; Locksley Ave; Behr Ave; Forest Knolls Dr; Devonshire Way; Clarendon Woods Ave; Ashwood Ln; Oakhurst Ln; Blairwood Ln; Woodhaven Ct; Adolph Sutro Ct; Glenhaven Ln; Lake Forest Ct.
Forest Knolls neighborhood detailed profile
Fort Mason neighborhood in San Francisco statistics: (Find on map)
Area: 0.132 square miles
Roads and streets: Van Ness Ave; Bay St; Pope Rd; McDowell Ave; Macarthur Ave; Franklin St (Funston Rd); Fort Mason 10; Fort Mason 11; Franklin St; Fort Mason 12; Schofield Rd; Fort Mason 13; Fort Mason 16.
Fort Mason neighborhood detailed profile
Area: 0.132 square miles
Roads and streets: Van Ness Ave; Bay St; Pope Rd; McDowell Ave; Macarthur Ave; Franklin St (Funston Rd); Fort Mason 10; Fort Mason 11; Franklin St; Fort Mason 12; Schofield Rd; Fort Mason 13; Fort Mason 16.
Fort Mason neighborhood detailed profile
French Quarter neighborhood in San Francisco statistics: (Find on map)
Area: 0.002 square miles
Population: 7
Population density:
Median household income in 2021:
Median rent in in 2021:
Male vs Females
Median age
Average estimated '21 value of housing units in 5-or-more-unit structures (50.0% of all units):
Most popular occupations of males: sales and office occupations (47.5%); computer and mathematical occupations (35.8%); education, training, and library occupations (24.6%); legal occupations (22.9%); production occupations (19.3%); service occupations (18.2%); material moving occupations (12.9%)
Most popular occupations of females: sales and office occupations (33.1%); service occupations (31.6%); education, training, and library occupations (9.5%); production occupations (7.0%); legal occupations (6.3%); arts, design, entertainment, sports, and media occupations (5.2%); business and financial operations occupations (3.8%)
Roads and streets: Bush St.
French Quarter neighborhood detailed profile
Area: 0.002 square miles
Population: 7
Population density:
| French Quarter: | 3,954 people per square mile |
| San Francisco: | 17,458 people per square mile |
Median household income in 2021:
| French Quarter: | $44,000 |
| San Francisco: | $121,826 |
Median rent in in 2021:
| French Quarter: | $785 |
| San Francisco: | $2,001 |
Male vs Females
| Males: | 4 |
| Females: | 3 |
Median age
| Males: | 48.4 years |
| Females: | 45.2 years |
Average estimated '21 value of housing units in 5-or-more-unit structures (50.0% of all units):
| French Quarter: | $2,056,207 |
| San Francisco: | $1,317,001 |
Most popular occupations of males: sales and office occupations (47.5%); computer and mathematical occupations (35.8%); education, training, and library occupations (24.6%); legal occupations (22.9%); production occupations (19.3%); service occupations (18.2%); material moving occupations (12.9%)
Most popular occupations of females: sales and office occupations (33.1%); service occupations (31.6%); education, training, and library occupations (9.5%); production occupations (7.0%); legal occupations (6.3%); arts, design, entertainment, sports, and media occupations (5.2%); business and financial operations occupations (3.8%)
Roads and streets: Bush St.
French Quarter neighborhood detailed profile
Ghirardelli Square neighborhood in San Francisco statistics: (Find on map)
Area: 0.005 square miles
Ghirardelli Square neighborhood detailed profile
Area: 0.005 square miles
Ghirardelli Square neighborhood detailed profile
Glen Park neighborhood in San Francisco statistics: (Find on map)
Area: 0.385 square miles
Population: 6,685
Population density:
Median household income in 2021:
Median rent in in 2021:
Male vs Females
Median age
Housing prices:
Average estimated value of detached houses in 2021 (39.0% of all units):
Average estimated value of townhouses or other attached units in 2021 (17.9% of all units):
Average estimated value of housing units in 2-unit structures in 2021 (24.9% of all units):
Average estimated '21 value of housing units in 3-to-4-unit structures (14.5% of all units):
Average estimated '21 value of housing units in 5-or-more-unit structures (1.7% of all units):
Most popular occupations of males: management occupations (except farmers) (20.4%); computer and mathematical occupations (16.1%); arts, design, entertainment, sports, and media occupations (13.5%); business and financial operations occupations (8.8%); service occupations (6.9%); architecture and engineering occupations (5.7%); healthcare practitioners and technical occupations (4.8%)
Most popular occupations of females: management occupations (except farmers) (21.0%); business and financial operations occupations (15.3%); education, training, and library occupations (14.9%); sales and office occupations (13.9%); service occupations (9.8%); healthcare practitioners and technical occupations (7.5%); arts, design, entertainment, sports, and media occupations (6.3%)
Roads and streets: San Jose Ave; Chenery St; Laidley St; Arlington St; Diamond Heights Blvd; Diamond St; Sussex St; Addison St; Surrey St; Randall St; Arbor St; Miguel St; Beacon St; Everson St; Bemis St; Poppy Ln; Moffitt St; Fairmount St; Digby St; Whitney St; Roanoke St; Mateo St; Wilder St; Farnum St; Penny Ln; Swiss Ave; Moreland St; Conrad St; Thor Ave; Amatista Ln; Ohlone Way; Mizpah St; Elk St; Castro St; Harry St; Hiliritas Ave; Van Buren St; Lippard Ave; Natick St; Kern St; Charles St; Harper St; Burnside Ave; Brompton Ave; Carrie St; Saint Mary's Ave; Highland Ave; Richland Ave.
Glen Park neighborhood detailed profile
Area: 0.385 square miles
Population: 6,685
Population density:
| Glen Park: | 17,359 people per square mile |
| San Francisco: | 17,458 people per square mile |
Median household income in 2021:
| Glen Park: | $182,627 |
| San Francisco: | $121,826 |
Median rent in in 2021:
| Glen Park: | $2,410 |
| San Francisco: | $2,001 |
Male vs Females
| Males: | 3,114 |
| Females: | 3,570 |
Median age
| Males: | 38.3 years |
| Females: | 39.1 years |
Housing prices:
Average estimated value of detached houses in 2021 (39.0% of all units):
| Glen Park: | $1,655,883 |
| San Francisco: | $1,815,784 |
Average estimated value of townhouses or other attached units in 2021 (17.9% of all units):
| This neighborhood: | $1,455,312 |
| city: | $1,506,493 |
Average estimated value of housing units in 2-unit structures in 2021 (24.9% of all units):
| This neighborhood: | $1,415,820 |
| San Francisco: | $1,685,431 |
Average estimated '21 value of housing units in 3-to-4-unit structures (14.5% of all units):
| Glen Park: | $1,439,327 |
| city: | $1,521,789 |
Average estimated '21 value of housing units in 5-or-more-unit structures (1.7% of all units):
| Glen Park: | $347,930 |
| San Francisco: | $1,317,001 |
Most popular occupations of males: management occupations (except farmers) (20.4%); computer and mathematical occupations (16.1%); arts, design, entertainment, sports, and media occupations (13.5%); business and financial operations occupations (8.8%); service occupations (6.9%); architecture and engineering occupations (5.7%); healthcare practitioners and technical occupations (4.8%)
Most popular occupations of females: management occupations (except farmers) (21.0%); business and financial operations occupations (15.3%); education, training, and library occupations (14.9%); sales and office occupations (13.9%); service occupations (9.8%); healthcare practitioners and technical occupations (7.5%); arts, design, entertainment, sports, and media occupations (6.3%)
Roads and streets: San Jose Ave; Chenery St; Laidley St; Arlington St; Diamond Heights Blvd; Diamond St; Sussex St; Addison St; Surrey St; Randall St; Arbor St; Miguel St; Beacon St; Everson St; Bemis St; Poppy Ln; Moffitt St; Fairmount St; Digby St; Whitney St; Roanoke St; Mateo St; Wilder St; Farnum St; Penny Ln; Swiss Ave; Moreland St; Conrad St; Thor Ave; Amatista Ln; Ohlone Way; Mizpah St; Elk St; Castro St; Harry St; Hiliritas Ave; Van Buren St; Lippard Ave; Natick St; Kern St; Charles St; Harper St; Burnside Ave; Brompton Ave; Carrie St; Saint Mary's Ave; Highland Ave; Richland Ave.
Glen Park neighborhood detailed profile
Golden Gate Heights neighborhood in San Francisco statistics: (Find on map)
Area: 0.162 square miles
Population: 2,781
Population density:
Median household income in 2021:
Median rent in in 2021:
Male vs Females
Median age
Housing prices:
Average estimated value of detached houses in 2021 (49.6% of all units):
Average estimated value of townhouses or other attached units in 2021 (26.9% of all units):
Average estimated value of housing units in 2-unit structures in 2021 (13.0% of all units):
Most popular occupations of males: management occupations (except farmers) (19.0%); computer and mathematical occupations (15.3%); sales and office occupations (14.3%); healthcare practitioners and technical occupations (10.8%); legal occupations (10.1%); service occupations (8.5%); education, training, and library occupations (5.7%)
Most popular occupations of females: management occupations (except farmers) (20.6%); healthcare practitioners and technical occupations (15.8%); business and financial operations occupations (11.9%); service occupations (10.4%); computer and mathematical occupations (9.4%); education, training, and library occupations (9.3%); arts, design, entertainment, sports, and media occupations (7.8%)
Roads and streets: 14th Ave; Noriega St; Ortega St; Funston Ave; 15th Ave; Rockridge Dr; Pacheco St; Aloha Ave; 12th Ave; 11th Ave; Aerial Way; Lawton St; Ortega Way; Rivera St; Mount Ln; Cragmont Ave; Quintara St; Sheldon Ter; Encinal Walk; Moraga St; Cascade Walk; Oriole Way; Radio Ter; Crestwell Walk.
Golden Gate Heights neighborhood detailed profile
Area: 0.162 square miles
Population: 2,781
Population density:
| Golden Gate Heights: | 17,193 people per square mile |
| San Francisco: | 17,458 people per square mile |
Median household income in 2021:
| Golden Gate Heights: | $142,777 |
| San Francisco: | $121,826 |
Median rent in in 2021:
| Golden Gate Heights: | $3,130 |
| San Francisco: | $2,001 |
Male vs Females
| Males: | 1,429 |
| Females: | 1,352 |
Median age
| Males: | 48.1 years |
| Females: | 47.8 years |
Housing prices:
Average estimated value of detached houses in 2021 (49.6% of all units):
| Golden Gate Heights: | $1,960,073 |
| San Francisco: | $1,815,784 |
Average estimated value of townhouses or other attached units in 2021 (26.9% of all units):
| This neighborhood: | $1,586,364 |
| city: | $1,506,493 |
Average estimated value of housing units in 2-unit structures in 2021 (13.0% of all units):
| This neighborhood: | $580,049 |
| San Francisco: | $1,685,431 |
Most popular occupations of males: management occupations (except farmers) (19.0%); computer and mathematical occupations (15.3%); sales and office occupations (14.3%); healthcare practitioners and technical occupations (10.8%); legal occupations (10.1%); service occupations (8.5%); education, training, and library occupations (5.7%)
Most popular occupations of females: management occupations (except farmers) (20.6%); healthcare practitioners and technical occupations (15.8%); business and financial operations occupations (11.9%); service occupations (10.4%); computer and mathematical occupations (9.4%); education, training, and library occupations (9.3%); arts, design, entertainment, sports, and media occupations (7.8%)
Roads and streets: 14th Ave; Noriega St; Ortega St; Funston Ave; 15th Ave; Rockridge Dr; Pacheco St; Aloha Ave; 12th Ave; 11th Ave; Aerial Way; Lawton St; Ortega Way; Rivera St; Mount Ln; Cragmont Ave; Quintara St; Sheldon Ter; Encinal Walk; Moraga St; Cascade Walk; Oriole Way; Radio Ter; Crestwell Walk.
Golden Gate Heights neighborhood detailed profile
Golden Gate Park neighborhood in San Francisco statistics: (Find on map)
Area: 1.635 square miles
Roads and streets: John F Kennedy Dr; South Dr; Middle Dr W; Crossover Dr; Kezar Dr; Stow Lake Dr; Concourse Dr; Middle Dr E; Stow Lake Dr E; Transverse Dr; Chain of Lakes Dr E; Spreckels Lake Dr; Overlook Dr; Conservatory Dr E; Tea Garden Dr (S Tea Garden Dr); Chain of Lakes Dr W; Martin Luther King Jr Dr; Ggp Access Rd; Bowling Green Dr; Conservatory Dr W; Marx Meadow Dr; Metson Rd; Conservatory Access Rd; Pompei Cir; 26th Ave; Chain of Lakes Dr; 30th Ave.
Golden Gate Park neighborhood detailed profile
Haight-Ashbury neighborhood in San Francisco statistics: (Find on map)
Area: 0.309 square miles
Population: 11,587
Population density:
Median household income in 2021:
Median rent in in 2021:
Male vs Females
Median age
Housing prices:
Average estimated value of detached houses in 2021 (7.2% of all units):
Average estimated value of townhouses or other attached units in 2021 (18.6% of all units):
Average estimated value of housing units in 2-unit structures in 2021 (10.5% of all units):
Average estimated '21 value of housing units in 3-to-4-unit structures (20.2% of all units):
Average estimated '21 value of housing units in 5-or-more-unit structures (2.4% of all units):
Most popular occupations of males: management occupations (except farmers) (14.9%); sales and office occupations (14.8%); business and financial operations occupations (14.0%); computer and mathematical occupations (12.8%); architecture and engineering occupations (9.2%); service occupations (8.6%); production occupations (4.2%)
Most popular occupations of females: healthcare practitioners and technical occupations (25.4%); sales and office occupations (16.9%); business and financial operations occupations (15.9%); service occupations (12.8%); management occupations (except farmers) (10.1%); legal occupations (7.8%); arts, design, entertainment, sports, and media occupations (2.6%)
Roads and streets: Oak St; Haight St; Page St; Waller St; Carl St; Stanyan St; Cole St; Frederick St; Shrader St; Masonic Ave; Clayton St; Ashbury St; Beulah St; Belvedere St; Central Ave; Broderick St; Lyon St; Baker St; Kezar Dr; Willard St.
Haight-Ashbury neighborhood detailed profile
Area: 0.309 square miles
Population: 11,587
Population density:
| Haight-Ashbury: | 37,439 people per square mile |
| San Francisco: | 17,458 people per square mile |
Median household income in 2021:
| Haight-Ashbury: | $176,901 |
| San Francisco: | $121,826 |
Median rent in in 2021:
| Haight-Ashbury: | $2,226 |
| San Francisco: | $2,001 |
Male vs Females
| Males: | 4,531 |
| Females: | 7,055 |
Median age
| Males: | 39.4 years |
| Females: | 33.6 years |
Housing prices:
Average estimated value of detached houses in 2021 (7.2% of all units):
| Haight-Ashbury: | $1,649,530 |
| San Francisco: | $1,815,784 |
Average estimated value of townhouses or other attached units in 2021 (18.6% of all units):
| This neighborhood: | $1,176,730 |
| city: | $1,506,493 |
Average estimated value of housing units in 2-unit structures in 2021 (10.5% of all units):
| This neighborhood: | $2,188,337 |
| San Francisco: | $1,685,431 |
Average estimated '21 value of housing units in 3-to-4-unit structures (20.2% of all units):
| Haight-Ashbury: | $1,303,251 |
| city: | $1,521,789 |
Average estimated '21 value of housing units in 5-or-more-unit structures (2.4% of all units):
| Haight-Ashbury: | $709,990 |
| San Francisco: | $1,317,001 |
Most popular occupations of males: management occupations (except farmers) (14.9%); sales and office occupations (14.8%); business and financial operations occupations (14.0%); computer and mathematical occupations (12.8%); architecture and engineering occupations (9.2%); service occupations (8.6%); production occupations (4.2%)
Most popular occupations of females: healthcare practitioners and technical occupations (25.4%); sales and office occupations (16.9%); business and financial operations occupations (15.9%); service occupations (12.8%); management occupations (except farmers) (10.1%); legal occupations (7.8%); arts, design, entertainment, sports, and media occupations (2.6%)
Roads and streets: Oak St; Haight St; Page St; Waller St; Carl St; Stanyan St; Cole St; Frederick St; Shrader St; Masonic Ave; Clayton St; Ashbury St; Beulah St; Belvedere St; Central Ave; Broderick St; Lyon St; Baker St; Kezar Dr; Willard St.
Haight-Ashbury neighborhood detailed profile
Hayes Valley neighborhood in San Francisco statistics: (Find on map)
Area: 0.143 square miles
Population: 5,260
Population density:
Median household income in 2021:
Median rent in in 2021:
Male vs Females
Median age
Most popular occupations of males: computer and mathematical occupations (23.9%); management occupations (except farmers) (19.7%); business and financial operations occupations (16.3%); education, training, and library occupations (10.2%); arts, design, entertainment, sports, and media occupations (7.1%); service occupations (6.9%); sales and office occupations (3.8%)
Most popular occupations of females: sales and office occupations (19.1%); education, training, and library occupations (14.6%); service occupations (14.4%); business and financial operations occupations (12.5%); management occupations (except farmers) (9.3%); arts, design, entertainment, sports, and media occupations (8.3%); computer and mathematical occupations (5.9%)
Roads and streets: Hickory St; Linden St; Hayes St; Oak St; Fell St; Ivy St; Grove St; Webster St; Laguna St; Octavia St; Buchanan St; Birch St; Gough St; Franklin St.
Hayes Valley neighborhood detailed profile
Area: 0.143 square miles
Population: 5,260
Population density:
| Hayes Valley: | 36,762 people per square mile |
| San Francisco: | 17,458 people per square mile |
Median household income in 2021:
| Hayes Valley: | $144,492 |
| San Francisco: | $121,826 |
Median rent in in 2021:
| Hayes Valley: | $2,085 |
| San Francisco: | $2,001 |
Male vs Females
| Males: | 2,883 |
| Females: | 2,376 |
Median age
| Males: | 42.0 years |
| Females: | 41.7 years |
Most popular occupations of males: computer and mathematical occupations (23.9%); management occupations (except farmers) (19.7%); business and financial operations occupations (16.3%); education, training, and library occupations (10.2%); arts, design, entertainment, sports, and media occupations (7.1%); service occupations (6.9%); sales and office occupations (3.8%)
Most popular occupations of females: sales and office occupations (19.1%); education, training, and library occupations (14.6%); service occupations (14.4%); business and financial operations occupations (12.5%); management occupations (except farmers) (9.3%); arts, design, entertainment, sports, and media occupations (8.3%); computer and mathematical occupations (5.9%)
Roads and streets: Hickory St; Linden St; Hayes St; Oak St; Fell St; Ivy St; Grove St; Webster St; Laguna St; Octavia St; Buchanan St; Birch St; Gough St; Franklin St.
Hayes Valley neighborhood detailed profile
Holly Park neighborhood in San Francisco statistics: (Find on map)
Area: 0.013 square miles
Population: 369
Population density:
Median household income in 2021:
Median rent in in 2021:
Male vs Females
Median age
Most popular occupations of males: service occupations (29.2%); healthcare practitioners and technical occupations (14.9%); sales and office occupations (12.1%); management occupations (except farmers) (5.9%); business and financial operations occupations (5.9%); arts, design, entertainment, sports, and media occupations (5.1%); computer and mathematical occupations (4.8%)
Most popular occupations of females: business and financial operations occupations (26.6%); service occupations (21.7%); sales and office occupations (16.6%); management occupations (except farmers) (14.4%); arts, design, entertainment, sports, and media occupations (7.4%); production occupations (4.7%); community and social services occupations (3.6%)
Holly Park neighborhood detailed profile
Area: 0.013 square miles
Population: 369
Population density:
| Holly Park: | 27,622 people per square mile |
| San Francisco: | 17,458 people per square mile |
Median household income in 2021:
| Holly Park: | $160,142 |
| San Francisco: | $121,826 |
Median rent in in 2021:
| Holly Park: | $2,414 |
| San Francisco: | $2,001 |
Male vs Females
| Males: | 194 |
| Females: | 175 |
Median age
| Males: | 35.8 years |
| Females: | 38.6 years |
Most popular occupations of males: service occupations (29.2%); healthcare practitioners and technical occupations (14.9%); sales and office occupations (12.1%); management occupations (except farmers) (5.9%); business and financial operations occupations (5.9%); arts, design, entertainment, sports, and media occupations (5.1%); computer and mathematical occupations (4.8%)
Most popular occupations of females: business and financial operations occupations (26.6%); service occupations (21.7%); sales and office occupations (16.6%); management occupations (except farmers) (14.4%); arts, design, entertainment, sports, and media occupations (7.4%); production occupations (4.7%); community and social services occupations (3.6%)
Holly Park neighborhood detailed profile
Hunters Point neighborhood in San Francisco statistics: (Find on map)
Area: 1.694 square miles
Population: 6,539
Population density:
Median household income in 2021:
Median rent in in 2021:
Male vs Females
Median age
Average estimated value of townhouses or other attached units in 2021 (4.6% of all units):
Most popular occupations of males: service occupations (36.7%); management occupations (except farmers) (15.3%); transportation occupations (12.9%); sales and office occupations (12.7%); material moving occupations (10.6%); education, training, and library occupations (9.2%); healthcare practitioners and technical occupations (4.9%)
Most popular occupations of females: sales and office occupations (50.3%); service occupations (38.1%); education, training, and library occupations (6.8%); community and social services occupations (5.7%); management occupations (except farmers) (2.1%); material moving occupations (1.2%)
Roads and streets: Evans Ave; Cargo Way; Spear Ave; Innes Ave; J St; 3rd St; Hudson Ave; H St; Galvez Ave; Crisp Rd; Hussey St; Fairfax Ave; Lockwood St; Manseau St; Newhall St; Hill Dr; I St; Morrell St; Navy Rd; Earl St; Fischer Ave; Burke Ave; Pier; Nimitz Ave; Harbor Rd; Mendell St; W Point Rd; Donahue St; Jerrold Ave; Kirkwood Ave; Hunters Point Blvd; Amador St; Cochrane St; Robinson St; Northridge Rd; Mahan St; 6th Ave; Fitch St; Middle Point Rd; Griffith St; Horn Ave; Jennings St; Van Keuran Ave; C St; R St; India St; E St; Oakdale Ave; Friedell St; Kiska Rd; Blandy St; Coleman St; McCann St; Cleo Rand Ln; English St; Ingalls St; Hawes St; la Salle Ave; Rebecca Ln; Keith St; Nautilus Ct; Baldwin Ct; Bowman Ct; Marlin Ct; Reardon Rd; A St; Albatross Ct; Dolphin Ct; D St; Wills St; Dormitory Rd; Lakewood St (Lockwood St); Hare St; Marist St; Atoll Cir; Oaksdale Ave; Lane St; Coral Ct; Islais St.
Hunters Point neighborhood detailed profile
Area: 1.694 square miles
Population: 6,539
Population density:
| Hunters Point: | 3,860 people per square mile |
| San Francisco: | 17,458 people per square mile |
Median household income in 2021:
| Hunters Point: | $43,193 |
| San Francisco: | $121,826 |
Median rent in in 2021:
| Hunters Point: | $889 |
| San Francisco: | $2,001 |
Male vs Females
| Males: | 3,057 |
| Females: | 3,481 |
Median age
| Males: | 31.2 years |
| Females: | 32.9 years |
Average estimated value of townhouses or other attached units in 2021 (4.6% of all units):
| This neighborhood: | $16,074 |
| city: | $1,506,493 |
Most popular occupations of males: service occupations (36.7%); management occupations (except farmers) (15.3%); transportation occupations (12.9%); sales and office occupations (12.7%); material moving occupations (10.6%); education, training, and library occupations (9.2%); healthcare practitioners and technical occupations (4.9%)
Most popular occupations of females: sales and office occupations (50.3%); service occupations (38.1%); education, training, and library occupations (6.8%); community and social services occupations (5.7%); management occupations (except farmers) (2.1%); material moving occupations (1.2%)
Roads and streets: Evans Ave; Cargo Way; Spear Ave; Innes Ave; J St; 3rd St; Hudson Ave; H St; Galvez Ave; Crisp Rd; Hussey St; Fairfax Ave; Lockwood St; Manseau St; Newhall St; Hill Dr; I St; Morrell St; Navy Rd; Earl St; Fischer Ave; Burke Ave; Pier; Nimitz Ave; Harbor Rd; Mendell St; W Point Rd; Donahue St; Jerrold Ave; Kirkwood Ave; Hunters Point Blvd; Amador St; Cochrane St; Robinson St; Northridge Rd; Mahan St; 6th Ave; Fitch St; Middle Point Rd; Griffith St; Horn Ave; Jennings St; Van Keuran Ave; C St; R St; India St; E St; Oakdale Ave; Friedell St; Kiska Rd; Blandy St; Coleman St; McCann St; Cleo Rand Ln; English St; Ingalls St; Hawes St; la Salle Ave; Rebecca Ln; Keith St; Nautilus Ct; Baldwin Ct; Bowman Ct; Marlin Ct; Reardon Rd; A St; Albatross Ct; Dolphin Ct; D St; Wills St; Dormitory Rd; Lakewood St (Lockwood St); Hare St; Marist St; Atoll Cir; Oaksdale Ave; Lane St; Coral Ct; Islais St.
Hunters Point neighborhood detailed profile
India Basin neighborhood in San Francisco statistics: (Find on map)
Area: 0.368 square miles
Population: 1,239
Population density:
Median household income in 2021:
Median rent in in 2021:
Male vs Females
Median age
Most popular occupations of males: service occupations (46.9%); management occupations (except farmers) (17.0%); transportation occupations (16.2%); material moving occupations (15.6%); education, training, and library occupations (13.6%); production occupations (9.4%); sales and office occupations (6.8%)
Most popular occupations of females: sales and office occupations (53.8%); service occupations (39.6%); education, training, and library occupations (6.6%); community and social services occupations (5.7%); management occupations (except farmers) (1.1%)
Roads and streets: Innes Ave; India St; Hudson Ave; Evans Ave; Earl St; Fitch St; Donahue St; Burke Ave; Galvez Ave; Newhall St; Fairfax Ave; Jennings St; Hawes St; Griffith St; Ingalls St; Lakewood St (Lockwood St); Friedell St.
India Basin neighborhood detailed profile
Area: 0.368 square miles
Population: 1,239
Population density:
| India Basin: | 3,367 people per square mile |
| San Francisco: | 17,458 people per square mile |
Median household income in 2021:
| India Basin: | $27,075 |
| San Francisco: | $121,826 |
Median rent in in 2021:
| India Basin: | $942 |
| San Francisco: | $2,001 |
Male vs Females
| Males: | 577 |
| Females: | 661 |
Median age
| Males: | 22.9 years |
| Females: | 30.9 years |
Most popular occupations of males: service occupations (46.9%); management occupations (except farmers) (17.0%); transportation occupations (16.2%); material moving occupations (15.6%); education, training, and library occupations (13.6%); production occupations (9.4%); sales and office occupations (6.8%)
Most popular occupations of females: sales and office occupations (53.8%); service occupations (39.6%); education, training, and library occupations (6.6%); community and social services occupations (5.7%); management occupations (except farmers) (1.1%)
Roads and streets: Innes Ave; India St; Hudson Ave; Evans Ave; Earl St; Fitch St; Donahue St; Burke Ave; Galvez Ave; Newhall St; Fairfax Ave; Jennings St; Hawes St; Griffith St; Ingalls St; Lakewood St (Lockwood St); Friedell St.
India Basin neighborhood detailed profile
Ingleside neighborhood in San Francisco statistics: (Find on map)
Area: 0.329 square miles
Population: 5,242
Population density:
Median household income in 2021:
Median rent in in 2021:
Male vs Females
Median age
Housing prices:
Average estimated value of detached houses in 2021 (58.5% of all units):
Average estimated value of townhouses or other attached units in 2021 (27.2% of all units):
Most popular occupations of males: service occupations (27.2%); sales and office occupations (15.8%); management occupations (except farmers) (10.4%); construction, extraction, and maintenance occupations (8.1%); community and social services occupations (6.1%); production occupations (6.1%); transportation occupations (5.2%)
Most popular occupations of females: service occupations (32.7%); sales and office occupations (29.2%); community and social services occupations (11.7%); business and financial operations occupations (11.0%); management occupations (except farmers) (6.0%); healthcare practitioners and technical occupations (2.9%); education, training, and library occupations (2.6%)
Limited-access highways (interstate or state) in this neighborhood: I- 280.
Roads and streets: Ocean Ave; Lakeview Ave; Geneva Ave; Grafton Ave; Holloway Ave; Jules Ave; Faxon Ave; Capitol Ave; Miramar Ave; Granada Ave; Plymouth Ave; Tara St; Brighton Ave; Lee Ave; Howth St; Harold Ave; Mount Vernon Ave; Niagara Ave; Louisburg St; Ridge Ln; de Montfort Ave; San Miguel St; Caine Ave; Bruce Ave; Majestic Ave; Edgar Pl; Margaret Ave; Williar Ave; Josiah Ave; San Jose Ave; Getz St.
Ingleside neighborhood detailed profile
Area: 0.329 square miles
Population: 5,242
Population density:
| Ingleside: | 15,928 people per square mile |
| San Francisco: | 17,458 people per square mile |
Median household income in 2021:
| Ingleside: | $129,658 |
| San Francisco: | $121,826 |
Median rent in in 2021:
| Ingleside: | $1,491 |
| San Francisco: | $2,001 |
Male vs Females
| Males: | 2,502 |
| Females: | 2,739 |
Median age
| Males: | 40.5 years |
| Females: | 48.3 years |
Housing prices:
Average estimated value of detached houses in 2021 (58.5% of all units):
| Ingleside: | $951,129 |
| San Francisco: | $1,815,784 |
Average estimated value of townhouses or other attached units in 2021 (27.2% of all units):
| This neighborhood: | $1,144,898 |
| city: | $1,506,493 |
Most popular occupations of males: service occupations (27.2%); sales and office occupations (15.8%); management occupations (except farmers) (10.4%); construction, extraction, and maintenance occupations (8.1%); community and social services occupations (6.1%); production occupations (6.1%); transportation occupations (5.2%)
Most popular occupations of females: service occupations (32.7%); sales and office occupations (29.2%); community and social services occupations (11.7%); business and financial operations occupations (11.0%); management occupations (except farmers) (6.0%); healthcare practitioners and technical occupations (2.9%); education, training, and library occupations (2.6%)
Limited-access highways (interstate or state) in this neighborhood: I- 280.
Roads and streets: Ocean Ave; Lakeview Ave; Geneva Ave; Grafton Ave; Holloway Ave; Jules Ave; Faxon Ave; Capitol Ave; Miramar Ave; Granada Ave; Plymouth Ave; Tara St; Brighton Ave; Lee Ave; Howth St; Harold Ave; Mount Vernon Ave; Niagara Ave; Louisburg St; Ridge Ln; de Montfort Ave; San Miguel St; Caine Ave; Bruce Ave; Majestic Ave; Edgar Pl; Margaret Ave; Williar Ave; Josiah Ave; San Jose Ave; Getz St.
Ingleside neighborhood detailed profile
Ingleside Heights neighborhood in San Francisco statistics: (Find on map)
Area: 0.343 square miles
Population: 1,117
Population density:
Median household income in 2021:
Median rent in in 2021:
Male vs Females
Median age
Average estimated value of detached houses in 2021 (96.6% of all units):
Most popular occupations of males: sales and office occupations (19.2%); computer and mathematical occupations (16.6%); management occupations (except farmers) (12.7%); material moving occupations (10.5%); healthcare practitioners and technical occupations (10.3%); production occupations (8.2%); architecture and engineering occupations (6.8%)
Most popular occupations of females: sales and office occupations (33.1%); business and financial operations occupations (32.2%); healthcare practitioners and technical occupations (11.1%); education, training, and library occupations (8.5%); management occupations (except farmers) (7.0%); community and social services occupations (2.5%); service occupations (2.0%)
Limited-access highways (interstate or state) in this neighborhood: I- 280.
Highways in this neighborhood: State Hwy 1 (Junipero Serra Blvd).
Roads and streets: Alemany Blvd; Brotherhood Way; Randolph St; Shields St; Palmetto Ave; Sargent St; Head St; Ralston St; Victoria St; de Long St; Bright St; Orizaba Ave; Ramsell St; Vernon St; Arch St; 19th Ave; Chester Ave; St Charles Ave; Niantic Ave; Byxbee St; Monticello St; Shakespeare St; Ocean View Ter; Stanley St; Panama St; Beverly St; San Luis Ave; Belle Ave; Kempton Ave; Santa Barbara Ave; Worcester Ave; Payson St; San Diego Ave; Saint Charles Ave; Sagamore St; Santa Cruz Ave.
Ingleside Heights neighborhood detailed profile
Area: 0.343 square miles
Population: 1,117
Population density:
| Ingleside Heights: | 3,256 people per square mile |
| San Francisco: | 17,458 people per square mile |
Median household income in 2021:
| Ingleside Heights: | $100,665 |
| San Francisco: | $121,826 |
Median rent in in 2021:
| Ingleside Heights: | $3,053 |
| San Francisco: | $2,001 |
Male vs Females
| Males: | 400 |
| Females: | 717 |
Median age
| Males: | 38.9 years |
| Females: | 41.6 years |
Average estimated value of detached houses in 2021 (96.6% of all units):
| Ingleside Heights: | $1,264,241 |
| San Francisco: | $1,815,784 |
Most popular occupations of males: sales and office occupations (19.2%); computer and mathematical occupations (16.6%); management occupations (except farmers) (12.7%); material moving occupations (10.5%); healthcare practitioners and technical occupations (10.3%); production occupations (8.2%); architecture and engineering occupations (6.8%)
Most popular occupations of females: sales and office occupations (33.1%); business and financial operations occupations (32.2%); healthcare practitioners and technical occupations (11.1%); education, training, and library occupations (8.5%); management occupations (except farmers) (7.0%); community and social services occupations (2.5%); service occupations (2.0%)
Limited-access highways (interstate or state) in this neighborhood: I- 280.
Highways in this neighborhood: State Hwy 1 (Junipero Serra Blvd).
Roads and streets: Alemany Blvd; Brotherhood Way; Randolph St; Shields St; Palmetto Ave; Sargent St; Head St; Ralston St; Victoria St; de Long St; Bright St; Orizaba Ave; Ramsell St; Vernon St; Arch St; 19th Ave; Chester Ave; St Charles Ave; Niantic Ave; Byxbee St; Monticello St; Shakespeare St; Ocean View Ter; Stanley St; Panama St; Beverly St; San Luis Ave; Belle Ave; Kempton Ave; Santa Barbara Ave; Worcester Ave; Payson St; San Diego Ave; Saint Charles Ave; Sagamore St; Santa Cruz Ave.
Ingleside Heights neighborhood detailed profile
Ingleside Terrace neighborhood in San Francisco statistics: (Find on map)
Area: 0.261 square miles
Population: 2,468
Population density:
Median household income in 2021:
Median rent in in 2021:
Male vs Females
Median age
Average estimated value of detached houses in 2021 (93.7% of all units):
Most popular occupations of males: sales and office occupations (26.1%); management occupations (except farmers) (17.1%); transportation occupations (9.5%); computer and mathematical occupations (9.1%); construction, extraction, and maintenance occupations (8.9%); education, training, and library occupations (7.7%); arts, design, entertainment, sports, and media occupations (7.7%)
Most popular occupations of females: sales and office occupations (30.6%); healthcare practitioners and technical occupations (14.0%); management occupations (except farmers) (11.5%); arts, design, entertainment, sports, and media occupations (11.4%); legal occupations (10.1%); business and financial operations occupations (9.6%); computer and mathematical occupations (6.9%)
Roads and streets: Junipero Serra Blvd; Urbano Dr; Holloway Ave; Moncada Way; Corona St; Lunado Way; Borica St; Entrada Ct; de Soto St; Victoria St; Mercedes Way; Ashton Ave; Estero Ave; Head St; Paloma Ave; Alviso St; Cerritos Ave; Monticello St; el Plazuela St (el Plazuela Way); Legion Ct; Cedro Ave; Pico Ave; Lunado Ct.
Ingleside Terrace neighborhood detailed profile
Area: 0.261 square miles
Population: 2,468
Population density:
| Ingleside Terrace: | 9,444 people per square mile |
| San Francisco: | 17,458 people per square mile |
Median household income in 2021:
| Ingleside Terrace: | $153,471 |
| San Francisco: | $121,826 |
Median rent in in 2021:
| Ingleside Terrace: | $2,391 |
| San Francisco: | $2,001 |
Male vs Females
| Males: | 1,299 |
| Females: | 1,168 |
Median age
| Males: | 52.2 years |
| Females: | 49.6 years |
Average estimated value of detached houses in 2021 (93.7% of all units):
| Ingleside Terrace: | $1,395,051 |
| San Francisco: | $1,815,784 |
Most popular occupations of males: sales and office occupations (26.1%); management occupations (except farmers) (17.1%); transportation occupations (9.5%); computer and mathematical occupations (9.1%); construction, extraction, and maintenance occupations (8.9%); education, training, and library occupations (7.7%); arts, design, entertainment, sports, and media occupations (7.7%)
Most popular occupations of females: sales and office occupations (30.6%); healthcare practitioners and technical occupations (14.0%); management occupations (except farmers) (11.5%); arts, design, entertainment, sports, and media occupations (11.4%); legal occupations (10.1%); business and financial operations occupations (9.6%); computer and mathematical occupations (6.9%)
Roads and streets: Junipero Serra Blvd; Urbano Dr; Holloway Ave; Moncada Way; Corona St; Lunado Way; Borica St; Entrada Ct; de Soto St; Victoria St; Mercedes Way; Ashton Ave; Estero Ave; Head St; Paloma Ave; Alviso St; Cerritos Ave; Monticello St; el Plazuela St (el Plazuela Way); Legion Ct; Cedro Ave; Pico Ave; Lunado Ct.
Ingleside Terrace neighborhood detailed profile
Inner Parkside neighborhood in San Francisco statistics: (Find on map)
Area: 0.276 square miles
Population: 5,061
Population density:
Median household income in 2021:
Median rent in in 2021:
Male vs Females
Median age
Housing prices:
Average estimated value of detached houses in 2021 (54.1% of all units):
Average estimated value of townhouses or other attached units in 2021 (29.9% of all units):
Average estimated value of housing units in 2-unit structures in 2021 (9.3% of all units):
Average estimated '21 value of housing units in 5-or-more-unit structures (8.1% of all units):
Most popular occupations of males: sales and office occupations (15.2%); management occupations (except farmers) (14.4%); computer and mathematical occupations (11.3%); service occupations (10.4%); business and financial operations occupations (7.1%); transportation occupations (6.9%); architecture and engineering occupations (5.1%)
Most popular occupations of females: sales and office occupations (25.0%); service occupations (11.7%); arts, design, entertainment, sports, and media occupations (11.1%); management occupations (except farmers) (11.0%); business and financial operations occupations (10.5%); healthcare practitioners and technical occupations (8.8%); education, training, and library occupations (6.7%)
Highways in this neighborhood: State Hwy 1 (19th Ave).
Roads and streets: 16th Ave; 15th Ave; 18th Ave; 17th Ave; Rivera St; Wawona St; Vicente St; Ulloa St; Taraval St; Santiago St; Pacheco St; Quintara St; Cecilia Ave; Fanning Way; Anglo Aly.
Inner Parkside neighborhood detailed profile
Area: 0.276 square miles
Population: 5,061
Population density:
| Inner Parkside: | 18,325 people per square mile |
| San Francisco: | 17,458 people per square mile |
Median household income in 2021:
| Inner Parkside: | $125,169 |
| San Francisco: | $121,826 |
Median rent in in 2021:
| Inner Parkside: | $2,280 |
| San Francisco: | $2,001 |
Male vs Females
| Males: | 2,420 |
| Females: | 2,640 |
Median age
| Males: | 45.6 years |
| Females: | 50.4 years |
Housing prices:
Average estimated value of detached houses in 2021 (54.1% of all units):
| Inner Parkside: | $1,992,772 |
| San Francisco: | $1,815,784 |
Average estimated value of townhouses or other attached units in 2021 (29.9% of all units):
| This neighborhood: | $1,426,942 |
| city: | $1,506,493 |
Average estimated value of housing units in 2-unit structures in 2021 (9.3% of all units):
| This neighborhood: | $906,061 |
| San Francisco: | $1,685,431 |
Average estimated '21 value of housing units in 5-or-more-unit structures (8.1% of all units):
| Inner Parkside: | $920,105 |
| San Francisco: | $1,317,001 |
Most popular occupations of males: sales and office occupations (15.2%); management occupations (except farmers) (14.4%); computer and mathematical occupations (11.3%); service occupations (10.4%); business and financial operations occupations (7.1%); transportation occupations (6.9%); architecture and engineering occupations (5.1%)
Most popular occupations of females: sales and office occupations (25.0%); service occupations (11.7%); arts, design, entertainment, sports, and media occupations (11.1%); management occupations (except farmers) (11.0%); business and financial operations occupations (10.5%); healthcare practitioners and technical occupations (8.8%); education, training, and library occupations (6.7%)
Highways in this neighborhood: State Hwy 1 (19th Ave).
Roads and streets: 16th Ave; 15th Ave; 18th Ave; 17th Ave; Rivera St; Wawona St; Vicente St; Ulloa St; Taraval St; Santiago St; Pacheco St; Quintara St; Cecilia Ave; Fanning Way; Anglo Aly.
Inner Parkside neighborhood detailed profile
Inner Richmond neighborhood in San Francisco statistics: (Find on map)
Area: 0.561 square miles
Population: 18,054
Population density:
Median household income in 2021:
Median rent in in 2021:
Male vs Females
Median age
Housing prices:
Average estimated value of detached houses in 2021 (10.8% of all units):
Average estimated value of townhouses or other attached units in 2021 (8.3% of all units):
Average estimated value of housing units in 2-unit structures in 2021 (18.7% of all units):
Average estimated '21 value of housing units in 3-to-4-unit structures (23.6% of all units):
Average estimated '21 value of housing units in 5-or-more-unit structures (5.5% of all units):
Most popular occupations of males: computer and mathematical occupations (22.9%); management occupations (except farmers) (17.9%); sales and office occupations (11.8%); service occupations (10.3%); architecture and engineering occupations (7.8%); arts, design, entertainment, sports, and media occupations (7.3%); business and financial operations occupations (6.2%)
Most popular occupations of females: sales and office occupations (21.1%); management occupations (except farmers) (17.8%); service occupations (16.7%); education, training, and library occupations (11.1%); business and financial operations occupations (9.3%); healthcare practitioners and technical occupations (6.0%); arts, design, entertainment, sports, and media occupations (5.6%)
Roads and streets: Geary Blvd; Fulton St; Cabrillo St; Balboa St; Anza St; Clement St; 8th Ave; 9th Ave; 10th Ave; 11th Ave; 12th Ave; Funston Ave; 7th Ave; 6th Ave; 5th Ave; 4th Ave; 3rd Ave; 2nd Ave.
Inner Richmond neighborhood detailed profile
Area: 0.561 square miles
Population: 18,054
Population density:
| Inner Richmond: | 32,178 people per square mile |
| San Francisco: | 17,458 people per square mile |
Median household income in 2021:
| Inner Richmond: | $144,528 |
| San Francisco: | $121,826 |
Median rent in in 2021:
| Inner Richmond: | $2,269 |
| San Francisco: | $2,001 |
Male vs Females
| Males: | 8,515 |
| Females: | 9,538 |
Median age
| Males: | 36.4 years |
| Females: | 39.8 years |
Housing prices:
Average estimated value of detached houses in 2021 (10.8% of all units):
| Inner Richmond: | $5,597,561 |
| San Francisco: | $1,815,784 |
Average estimated value of townhouses or other attached units in 2021 (8.3% of all units):
| This neighborhood: | $336,961 |
| city: | $1,506,493 |
Average estimated value of housing units in 2-unit structures in 2021 (18.7% of all units):
| This neighborhood: | $965,744 |
| San Francisco: | $1,685,431 |
Average estimated '21 value of housing units in 3-to-4-unit structures (23.6% of all units):
| Inner Richmond: | $1,139,101 |
| city: | $1,521,789 |
Average estimated '21 value of housing units in 5-or-more-unit structures (5.5% of all units):
| Inner Richmond: | $939,125 |
| San Francisco: | $1,317,001 |
Most popular occupations of males: computer and mathematical occupations (22.9%); management occupations (except farmers) (17.9%); sales and office occupations (11.8%); service occupations (10.3%); architecture and engineering occupations (7.8%); arts, design, entertainment, sports, and media occupations (7.3%); business and financial operations occupations (6.2%)
Most popular occupations of females: sales and office occupations (21.1%); management occupations (except farmers) (17.8%); service occupations (16.7%); education, training, and library occupations (11.1%); business and financial operations occupations (9.3%); healthcare practitioners and technical occupations (6.0%); arts, design, entertainment, sports, and media occupations (5.6%)
Roads and streets: Geary Blvd; Fulton St; Cabrillo St; Balboa St; Anza St; Clement St; 8th Ave; 9th Ave; 10th Ave; 11th Ave; 12th Ave; Funston Ave; 7th Ave; 6th Ave; 5th Ave; 4th Ave; 3rd Ave; 2nd Ave.
Inner Richmond neighborhood detailed profile
Inner Sunset neighborhood in San Francisco statistics: (Find on map)
Area: 1.750 square miles
Population: 38,853
Population density:
Median household income in 2021:
Median rent in in 2021:
Male vs Females
Median age
Housing prices:
Average estimated value of detached houses in 2021 (36.0% of all units):
Average estimated value of townhouses or other attached units in 2021 (18.1% of all units):
Average estimated value of housing units in 2-unit structures in 2021 (18.4% of all units):
Average estimated '21 value of housing units in 3-to-4-unit structures (22.1% of all units):
Average estimated '21 value of housing units in 5-or-more-unit structures (7.6% of all units):
Most popular occupations of males: management occupations (except farmers) (18.1%); computer and mathematical occupations (15.2%); service occupations (10.9%); sales and office occupations (10.5%); business and financial operations occupations (7.4%); legal occupations (5.6%); healthcare practitioners and technical occupations (4.8%)
Most popular occupations of females: management occupations (except farmers) (14.9%); sales and office occupations (14.9%); healthcare practitioners and technical occupations (13.5%); business and financial operations occupations (12.2%); service occupations (11.7%); arts, design, entertainment, sports, and media occupations (8.3%); education, training, and library occupations (8.1%)
Highways in this neighborhood: State Hwy 1 (19th Ave).
Roads and streets: Lincoln Way; 14th Ave; 15th Ave; 16th Ave; 18th Ave; 17th Ave; Judah St; Pacheco St; 9th Ave; Noriega St; Laguna Honda Blvd; Irving St; Funston Ave; 12th Ave; 10th Ave; W Portal Ave; Ortega St; 8th Ave; Kirkham St; Lawton St; Magellan Ave; 11th Ave; Wawona St; Moraga St; Taraval St; 7th Ave; Ulloa St; Castenada Ave; Quintara St; Vicente St; 5th Ave; Rivera St; Sloat Blvd; San Marcos Ave; Hugo St; Parnassus Ave; 6th Ave; Dorantes Ave; Dewey Blvd; 4th Ave; Santiago St; Mendosa Ave; Rockridge Dr; Forest Side Ave; Arguello Blvd; Madrone Ave; Aloha Ave; Kezar Dr; Claremont Blvd; 3rd Ave; Cragmont Ave; Cecilia Ave; Lenox Way; Lomita Ave; Montalvo Ave; Alton Ave; Sotelo Ave; Anglo Aly; Briarcliff Ter; Aerial Way; Marcela Ave; Lopez Ave; Santa Rita Ave; Linares Ave; 2nd Ave; Auto Dr; Ventura Ave; Carl St; Lurline St; Locksley Ave; Cortes Ave; Fanning Way; Hillway Ave; Ortega Way; Mount Ln; Verdun Way; Path St; Forest Hill Path; Ardenwood Way; Sola Ave; Sheldon Ter; Mandalay Ln; Encinal Walk; Mesa Ave; Cascade Walk; Oriole Way; Radio Ter; Hill Point Ave; Plaza St; Avon Way; Crestwell Walk; Gateview Ct.
Inner Sunset neighborhood detailed profile
Area: 1.750 square miles
Population: 38,853
Population density:
| Inner Sunset: | 22,208 people per square mile |
| San Francisco: | 17,458 people per square mile |
Median household income in 2021:
| Inner Sunset: | $167,680 |
| San Francisco: | $121,826 |
Median rent in in 2021:
| Inner Sunset: | $2,732 |
| San Francisco: | $2,001 |
Male vs Females
| Males: | 18,513 |
| Females: | 20,339 |
Median age
| Males: | 47.6 years |
| Females: | 47.5 years |
Housing prices:
Average estimated value of detached houses in 2021 (36.0% of all units):
| Inner Sunset: | $1,996,104 |
| San Francisco: | $1,815,784 |
Average estimated value of townhouses or other attached units in 2021 (18.1% of all units):
| This neighborhood: | $1,486,370 |
| city: | $1,506,493 |
Average estimated value of housing units in 2-unit structures in 2021 (18.4% of all units):
| This neighborhood: | $2,223,113 |
| San Francisco: | $1,685,431 |
Average estimated '21 value of housing units in 3-to-4-unit structures (22.1% of all units):
| Inner Sunset: | $1,276,190 |
| city: | $1,521,789 |
Average estimated '21 value of housing units in 5-or-more-unit structures (7.6% of all units):
| Inner Sunset: | $813,477 |
| San Francisco: | $1,317,001 |
Most popular occupations of males: management occupations (except farmers) (18.1%); computer and mathematical occupations (15.2%); service occupations (10.9%); sales and office occupations (10.5%); business and financial operations occupations (7.4%); legal occupations (5.6%); healthcare practitioners and technical occupations (4.8%)
Most popular occupations of females: management occupations (except farmers) (14.9%); sales and office occupations (14.9%); healthcare practitioners and technical occupations (13.5%); business and financial operations occupations (12.2%); service occupations (11.7%); arts, design, entertainment, sports, and media occupations (8.3%); education, training, and library occupations (8.1%)
Highways in this neighborhood: State Hwy 1 (19th Ave).
Roads and streets: Lincoln Way; 14th Ave; 15th Ave; 16th Ave; 18th Ave; 17th Ave; Judah St; Pacheco St; 9th Ave; Noriega St; Laguna Honda Blvd; Irving St; Funston Ave; 12th Ave; 10th Ave; W Portal Ave; Ortega St; 8th Ave; Kirkham St; Lawton St; Magellan Ave; 11th Ave; Wawona St; Moraga St; Taraval St; 7th Ave; Ulloa St; Castenada Ave; Quintara St; Vicente St; 5th Ave; Rivera St; Sloat Blvd; San Marcos Ave; Hugo St; Parnassus Ave; 6th Ave; Dorantes Ave; Dewey Blvd; 4th Ave; Santiago St; Mendosa Ave; Rockridge Dr; Forest Side Ave; Arguello Blvd; Madrone Ave; Aloha Ave; Kezar Dr; Claremont Blvd; 3rd Ave; Cragmont Ave; Cecilia Ave; Lenox Way; Lomita Ave; Montalvo Ave; Alton Ave; Sotelo Ave; Anglo Aly; Briarcliff Ter; Aerial Way; Marcela Ave; Lopez Ave; Santa Rita Ave; Linares Ave; 2nd Ave; Auto Dr; Ventura Ave; Carl St; Lurline St; Locksley Ave; Cortes Ave; Fanning Way; Hillway Ave; Ortega Way; Mount Ln; Verdun Way; Path St; Forest Hill Path; Ardenwood Way; Sola Ave; Sheldon Ter; Mandalay Ln; Encinal Walk; Mesa Ave; Cascade Walk; Oriole Way; Radio Ter; Hill Point Ave; Plaza St; Avon Way; Crestwell Walk; Gateview Ct.
Inner Sunset neighborhood detailed profile
Inset neighborhood in San Francisco statistics: (Find on map)
Area: 0.709 square miles
Population: 18,189
Population density:
Median household income in 2021:
Median rent in in 2021:
Male vs Females
Median age
Housing prices:
Average estimated value of detached houses in 2021 (19.9% of all units):
Average estimated value of townhouses or other attached units in 2021 (12.1% of all units):
Average estimated value of housing units in 2-unit structures in 2021 (18.5% of all units):
Average estimated '21 value of housing units in 3-to-4-unit structures (24.7% of all units):
Average estimated '21 value of housing units in 5-or-more-unit structures (5.0% of all units):
Most popular occupations of males: management occupations (except farmers) (19.7%); computer and mathematical occupations (15.2%); service occupations (12.2%); sales and office occupations (9.3%); business and financial operations occupations (6.8%); architecture and engineering occupations (5.4%); life, physical, and social science occupations (5.4%)
Most popular occupations of females: management occupations (except farmers) (15.9%); service occupations (13.3%); healthcare practitioners and technical occupations (12.9%); sales and office occupations (12.7%); business and financial operations occupations (12.4%); education, training, and library occupations (9.6%); arts, design, entertainment, sports, and media occupations (7.7%)
Highways in this neighborhood: State Hwy 1 (19th Ave).
Roads and streets: Lincoln Way; Judah St; Irving St; Kirkham St; 16th Ave; 10th Ave; 18th Ave; 9th Ave; 17th Ave; 8th Ave; 7th Ave; Lawton St; 12th Ave; 11th Ave; Moraga St; Noriega St; Funston Ave; Hugo St; 15th Ave; 4th Ave; 14th Ave; 5th Ave; 6th Ave; Ortega St; Parnassus Ave; Laguna Honda Blvd; 3rd Ave; Arguello Blvd; 2nd Ave; Auto Dr; Lurline St.
Inset neighborhood detailed profile
Area: 0.709 square miles
Population: 18,189
Population density:
| Inset: | 25,652 people per square mile |
| San Francisco: | 17,458 people per square mile |
Median household income in 2021:
| Inset: | $154,008 |
| San Francisco: | $121,826 |
Median rent in in 2021:
| Inset: | $2,513 |
| San Francisco: | $2,001 |
Male vs Females
| Males: | 8,666 |
| Females: | 9,522 |
Median age
| Males: | 40.6 years |
| Females: | 39.4 years |
Housing prices:
Average estimated value of detached houses in 2021 (19.9% of all units):
| Inset: | $1,418,034 |
| San Francisco: | $1,815,784 |
Average estimated value of townhouses or other attached units in 2021 (12.1% of all units):
| This neighborhood: | $1,043,631 |
| city: | $1,506,493 |
Average estimated value of housing units in 2-unit structures in 2021 (18.5% of all units):
| This neighborhood: | $2,623,549 |
| San Francisco: | $1,685,431 |
Average estimated '21 value of housing units in 3-to-4-unit structures (24.7% of all units):
| Inset: | $1,276,190 |
| city: | $1,521,789 |
Average estimated '21 value of housing units in 5-or-more-unit structures (5.0% of all units):
| Inset: | $715,625 |
| San Francisco: | $1,317,001 |
Most popular occupations of males: management occupations (except farmers) (19.7%); computer and mathematical occupations (15.2%); service occupations (12.2%); sales and office occupations (9.3%); business and financial operations occupations (6.8%); architecture and engineering occupations (5.4%); life, physical, and social science occupations (5.4%)
Most popular occupations of females: management occupations (except farmers) (15.9%); service occupations (13.3%); healthcare practitioners and technical occupations (12.9%); sales and office occupations (12.7%); business and financial operations occupations (12.4%); education, training, and library occupations (9.6%); arts, design, entertainment, sports, and media occupations (7.7%)
Highways in this neighborhood: State Hwy 1 (19th Ave).
Roads and streets: Lincoln Way; Judah St; Irving St; Kirkham St; 16th Ave; 10th Ave; 18th Ave; 9th Ave; 17th Ave; 8th Ave; 7th Ave; Lawton St; 12th Ave; 11th Ave; Moraga St; Noriega St; Funston Ave; Hugo St; 15th Ave; 4th Ave; 14th Ave; 5th Ave; 6th Ave; Ortega St; Parnassus Ave; Laguna Honda Blvd; 3rd Ave; Arguello Blvd; 2nd Ave; Auto Dr; Lurline St.
Inset neighborhood detailed profile
Intermission neighborhood in San Francisco statistics: (Find on map)
Area: 0.039 square miles
Population: 1,666
Population density:
Median household income in 2021:
Median rent in in 2021:
Male vs Females
Median age
Most popular occupations of males: management occupations (except farmers) (29.4%); business and financial operations occupations (24.0%); computer and mathematical occupations (15.8%); service occupations (9.2%); sales and office occupations (9.1%); education, training, and library occupations (5.1%); life, physical, and social science occupations (4.2%)
Most popular occupations of females: sales and office occupations (39.8%); service occupations (18.7%); business and financial operations occupations (11.3%); computer and mathematical occupations (10.2%); management occupations (except farmers) (8.2%); life, physical, and social science occupations (5.5%); community and social services occupations (3.8%)
Highways in this neighborhood: US Hwy 101 (Van Ness Ave).
Roads and streets: Market St; Franklin St; Fell St; Oak St; Hickory St; Page St.
Intermission neighborhood detailed profile
Area: 0.039 square miles
Population: 1,666
Population density:
| Intermission: | 43,043 people per square mile |
| San Francisco: | 17,458 people per square mile |
Median household income in 2021:
| Intermission: | $192,574 |
| San Francisco: | $121,826 |
Median rent in in 2021:
| Intermission: | $2,225 |
| San Francisco: | $2,001 |
Male vs Females
| Males: | 1,036 |
| Females: | 630 |
Median age
| Males: | 39.7 years |
| Females: | 35.4 years |
Most popular occupations of males: management occupations (except farmers) (29.4%); business and financial operations occupations (24.0%); computer and mathematical occupations (15.8%); service occupations (9.2%); sales and office occupations (9.1%); education, training, and library occupations (5.1%); life, physical, and social science occupations (4.2%)
Most popular occupations of females: sales and office occupations (39.8%); service occupations (18.7%); business and financial operations occupations (11.3%); computer and mathematical occupations (10.2%); management occupations (except farmers) (8.2%); life, physical, and social science occupations (5.5%); community and social services occupations (3.8%)
Highways in this neighborhood: US Hwy 101 (Van Ness Ave).
Roads and streets: Market St; Franklin St; Fell St; Oak St; Hickory St; Page St.
Intermission neighborhood detailed profile
Jackson Square neighborhood in San Francisco statistics: (Find on map)
Area: 0.029 square miles
Population: 756
Population density:
Median household income in 2021:
Median rent in in 2021:
Male vs Females
Median age
Most popular occupations of males: sales and office occupations (24.1%); computer and mathematical occupations (16.6%); construction, extraction, and maintenance occupations (13.8%); transportation occupations (12.4%); life, physical, and social science occupations (10.0%); business and financial operations occupations (6.5%); service occupations (5.6%)
Most popular occupations of females: service occupations (25.4%); sales and office occupations (21.0%); management occupations (except farmers) (19.9%); arts, design, entertainment, sports, and media occupations (19.8%); business and financial operations occupations (10.9%); legal occupations (2.5%); architecture and engineering occupations (2.0%)
Roads and streets: Pacific Ave; Jackson St; Sansome St; Battery St; Gold St; Washington St; Custom House Pl; Hotaling Pl (Hotaling St); Montgomery St; Hinckley Walk (Hinckle Walk, Washington St); Jerome Aly.
Jackson Square neighborhood detailed profile
Area: 0.029 square miles
Population: 756
Population density:
| Jackson Square: | 26,235 people per square mile |
| San Francisco: | 17,458 people per square mile |
Median household income in 2021:
| Jackson Square: | $156,490 |
| San Francisco: | $121,826 |
Median rent in in 2021:
| Jackson Square: | $861 |
| San Francisco: | $2,001 |
Male vs Females
| Males: | 379 |
| Females: | 377 |
Median age
| Males: | 49.4 years |
| Females: | 52.0 years |
Most popular occupations of males: sales and office occupations (24.1%); computer and mathematical occupations (16.6%); construction, extraction, and maintenance occupations (13.8%); transportation occupations (12.4%); life, physical, and social science occupations (10.0%); business and financial operations occupations (6.5%); service occupations (5.6%)
Most popular occupations of females: service occupations (25.4%); sales and office occupations (21.0%); management occupations (except farmers) (19.9%); arts, design, entertainment, sports, and media occupations (19.8%); business and financial operations occupations (10.9%); legal occupations (2.5%); architecture and engineering occupations (2.0%)
Roads and streets: Pacific Ave; Jackson St; Sansome St; Battery St; Gold St; Washington St; Custom House Pl; Hotaling Pl (Hotaling St); Montgomery St; Hinckley Walk (Hinckle Walk, Washington St); Jerome Aly.
Jackson Square neighborhood detailed profile
Japantown neighborhood in San Francisco statistics: (Find on map)
Area: 0.036 square miles
Population: 996
Population density:
Median household income in 2021:
Median rent in in 2021:
Male vs Females
Median age
Most popular occupations of males: arts, design, entertainment, sports, and media occupations (20.8%); management occupations (except farmers) (14.7%); construction, extraction, and maintenance occupations (12.4%); computer and mathematical occupations (11.0%); transportation occupations (10.9%); sales and office occupations (10.7%); production occupations (7.1%)
Most popular occupations of females: management occupations (except farmers) (49.9%); healthcare practitioners and technical occupations (20.0%); business and financial operations occupations (9.6%); arts, design, entertainment, sports, and media occupations (9.0%); sales and office occupations (5.5%); computer and mathematical occupations (2.7%); life, physical, and social science occupations (2.2%)
Roads and streets: Sutter St; Webster St; Geary Blvd; Post St; Laguna St; Buchanan St; Hemlock St.
Japantown neighborhood detailed profile
Area: 0.036 square miles
Population: 996
Population density:
| Japantown: | 27,884 people per square mile |
| San Francisco: | 17,458 people per square mile |
Median household income in 2021:
| Japantown: | $124,565 |
| San Francisco: | $121,826 |
Median rent in in 2021:
| Japantown: | $1,675 |
| San Francisco: | $2,001 |
Male vs Females
| Males: | 426 |
| Females: | 570 |
Median age
| Males: | 44.4 years |
| Females: | 44.9 years |
Most popular occupations of males: arts, design, entertainment, sports, and media occupations (20.8%); management occupations (except farmers) (14.7%); construction, extraction, and maintenance occupations (12.4%); computer and mathematical occupations (11.0%); transportation occupations (10.9%); sales and office occupations (10.7%); production occupations (7.1%)
Most popular occupations of females: management occupations (except farmers) (49.9%); healthcare practitioners and technical occupations (20.0%); business and financial operations occupations (9.6%); arts, design, entertainment, sports, and media occupations (9.0%); sales and office occupations (5.5%); computer and mathematical occupations (2.7%); life, physical, and social science occupations (2.2%)
Roads and streets: Sutter St; Webster St; Geary Blvd; Post St; Laguna St; Buchanan St; Hemlock St.
Japantown neighborhood detailed profile
Laguna Honda neighborhood in San Francisco statistics: (Find on map)
Area: 0.143 square miles
Population: 1,793
Population density:
Median household income in 2021:
Median rent in in 2021:
Male vs Females
Median age
Average estimated value of detached houses in 2021 (90.5% of all units):
Most popular occupations of males: management occupations (except farmers) (19.8%); sales and office occupations (18.7%); business and financial operations occupations (14.3%); education, training, and library occupations (10.7%); computer and mathematical occupations (8.1%); transportation occupations (6.6%); service occupations (5.8%)
Most popular occupations of females: sales and office occupations (17.4%); healthcare practitioners and technical occupations (15.3%); business and financial operations occupations (13.9%); arts, design, entertainment, sports, and media occupations (13.2%); management occupations (except farmers) (12.3%); legal occupations (7.3%); education, training, and library occupations (7.0%)
Roads and streets: Woodside Ave; Idora Ave; Edgehill Way; Laguna Honda Blvd; Garcia Ave; Hernandez Ave; Vasquez Ave; Ulloa St; Rockaway Ave; Merced Ave; Pacheco St; Balceta Ave; Knockash Hill; Automobile Pathway; Rockwood Ct; Sydney Way.
Laguna Honda neighborhood detailed profile
Area: 0.143 square miles
Population: 1,793
Population density:
| Laguna Honda: | 12,526 people per square mile |
| San Francisco: | 17,458 people per square mile |
Median household income in 2021:
| Laguna Honda: | $201,770 |
| San Francisco: | $121,826 |
Median rent in in 2021:
| Laguna Honda: | $2,896 |
| San Francisco: | $2,001 |
Male vs Females
| Males: | 964 |
| Females: | 828 |
Median age
| Males: | 50.8 years |
| Females: | 59.9 years |
Average estimated value of detached houses in 2021 (90.5% of all units):
| Laguna Honda: | $976,581 |
| San Francisco: | $1,815,784 |
Most popular occupations of males: management occupations (except farmers) (19.8%); sales and office occupations (18.7%); business and financial operations occupations (14.3%); education, training, and library occupations (10.7%); computer and mathematical occupations (8.1%); transportation occupations (6.6%); service occupations (5.8%)
Most popular occupations of females: sales and office occupations (17.4%); healthcare practitioners and technical occupations (15.3%); business and financial operations occupations (13.9%); arts, design, entertainment, sports, and media occupations (13.2%); management occupations (except farmers) (12.3%); legal occupations (7.3%); education, training, and library occupations (7.0%)
Roads and streets: Woodside Ave; Idora Ave; Edgehill Way; Laguna Honda Blvd; Garcia Ave; Hernandez Ave; Vasquez Ave; Ulloa St; Rockaway Ave; Merced Ave; Pacheco St; Balceta Ave; Knockash Hill; Automobile Pathway; Rockwood Ct; Sydney Way.
Laguna Honda neighborhood detailed profile
Lake neighborhood in San Francisco statistics: (Find on map)
Area: 0.334 square miles
Population: 7,338
Population density:
Median household income in 2021:
Median rent in in 2021:
Male vs Females
Median age
Housing prices:
Average estimated value of detached houses in 2021 (27.5% of all units):
Average estimated value of townhouses or other attached units in 2021 (9.1% of all units):
Average estimated value of housing units in 2-unit structures in 2021 (19.8% of all units):
Average estimated '21 value of housing units in 3-to-4-unit structures (19.9% of all units):
Average estimated '21 value of housing units in 5-or-more-unit structures (3.1% of all units):
Most popular occupations of males: management occupations (except farmers) (16.9%); sales and office occupations (14.9%); service occupations (13.7%); computer and mathematical occupations (13.3%); legal occupations (6.9%); arts, design, entertainment, sports, and media occupations (6.7%); education, training, and library occupations (5.1%)
Most popular occupations of females: sales and office occupations (19.1%); service occupations (16.8%); management occupations (except farmers) (14.0%); healthcare practitioners and technical occupations (12.4%); education, training, and library occupations (9.7%); business and financial operations occupations (7.4%); arts, design, entertainment, sports, and media occupations (6.5%)
Highways in this neighborhood: State Hwy 1 (Park Presidio Blvd); State Hwy 1.
Roads and streets: California St; Lake St; Cornwall St; 5th Ave; 6th Ave; 7th Ave; Pacific Ave; 24th Ave; 22nd Ave; 21st Ave; 20th Ave; 18th Ave; 19th Ave; 17th Ave; 16th Ave; W Clay St; 8th Ave; 10th Ave; 9th Ave; 12th Ave; 11th Ave; Funston Ave; 15th Ave; 14th Ave; 25th Ave; 26th Ave; 27th Ave; 4th Ave; 2nd Ave; 3rd Ave; 23rd Ave.
Lake neighborhood detailed profile
Area: 0.334 square miles
Population: 7,338
Population density:
| Lake: | 21,966 people per square mile |
| San Francisco: | 17,458 people per square mile |
Median household income in 2021:
| Lake: | $151,678 |
| San Francisco: | $121,826 |
Median rent in in 2021:
| Lake: | $2,288 |
| San Francisco: | $2,001 |
Male vs Females
| Males: | 3,490 |
| Females: | 3,847 |
Median age
| Males: | 40.4 years |
| Females: | 41.8 years |
Housing prices:
Average estimated value of detached houses in 2021 (27.5% of all units):
| Lake: | $4,929,789 |
| San Francisco: | $1,815,784 |
Average estimated value of townhouses or other attached units in 2021 (9.1% of all units):
| This neighborhood: | $1,765,000 |
| city: | $1,506,493 |
Average estimated value of housing units in 2-unit structures in 2021 (19.8% of all units):
| This neighborhood: | $419,342 |
| San Francisco: | $1,685,431 |
Average estimated '21 value of housing units in 3-to-4-unit structures (19.9% of all units):
| Lake: | $1,446,667 |
| city: | $1,521,789 |
Average estimated '21 value of housing units in 5-or-more-unit structures (3.1% of all units):
| Lake: | $1,613,641 |
| San Francisco: | $1,317,001 |
Most popular occupations of males: management occupations (except farmers) (16.9%); sales and office occupations (14.9%); service occupations (13.7%); computer and mathematical occupations (13.3%); legal occupations (6.9%); arts, design, entertainment, sports, and media occupations (6.7%); education, training, and library occupations (5.1%)
Most popular occupations of females: sales and office occupations (19.1%); service occupations (16.8%); management occupations (except farmers) (14.0%); healthcare practitioners and technical occupations (12.4%); education, training, and library occupations (9.7%); business and financial operations occupations (7.4%); arts, design, entertainment, sports, and media occupations (6.5%)
Highways in this neighborhood: State Hwy 1 (Park Presidio Blvd); State Hwy 1.
Roads and streets: California St; Lake St; Cornwall St; 5th Ave; 6th Ave; 7th Ave; Pacific Ave; 24th Ave; 22nd Ave; 21st Ave; 20th Ave; 18th Ave; 19th Ave; 17th Ave; 16th Ave; W Clay St; 8th Ave; 10th Ave; 9th Ave; 12th Ave; 11th Ave; Funston Ave; 15th Ave; 14th Ave; 25th Ave; 26th Ave; 27th Ave; 4th Ave; 2nd Ave; 3rd Ave; 23rd Ave.
Lake neighborhood detailed profile
Lake Shore neighborhood in San Francisco statistics: (Find on map)
Area: 2.508 square miles
Population: 4,305
Population density:
Median household income in 2021:
Median rent in in 2021:
Male vs Females
Median age
Housing prices:
Average estimated value of detached houses in 2021 (68.6% of all units):
Average estimated value of townhouses or other attached units in 2021 (153.7% of all units):
Average estimated '21 value of housing units in 5-or-more-unit structures (13.1% of all units):
Most popular occupations of males: sales and office occupations (13.9%); service occupations (13.6%); management occupations (except farmers) (12.0%); business and financial operations occupations (11.8%); healthcare practitioners and technical occupations (9.3%); transportation occupations (6.1%); education, training, and library occupations (5.2%)
Most popular occupations of females: sales and office occupations (25.3%); service occupations (19.3%); business and financial operations occupations (16.6%); education, training, and library occupations (10.8%); healthcare practitioners and technical occupations (9.7%); management occupations (except farmers) (6.2%); arts, design, entertainment, sports, and media occupations (4.6%)
Highways in this neighborhood: State Hwy 35 (Skyline Blvd).
Roads and streets: Lake Merced Blvd; John Muir Dr; Sloat Blvd; Lakeshore Dr; Ocean Ave; Gellert Dr; Harding Rd; Upper Great Hwy (Great Hwy); Country Club Dr; Eucalyptus Dr; Sunset Blvd; Lake Merced Hill So St; Morningside Dr; Middlefield Dr; Clearfield Dr; Armory Rd; Fort Funston Rd; Herbst Rd; Everglade Dr; Riverton Dr; Forest View Dr; Sylvan Dr; Meadowbrook Dr; Huntington Dr; Inverness Dr; Springfield Dr; Lake Merced Hill No St; Emerald Ln; Zoo Rd; Brookhaven Ln; Lake Merced Hill; Westmoorland Dr; Bonnie Brae Ln; Berkshire Way; Havenside Dr; Lancaster Ln; Lakeshore Plz.
Roads and streets: John Muir Dr.
Lake Shore neighborhood detailed profile
Area: 2.508 square miles
Population: 4,305
Population density:
| Lake Shore: | 1,717 people per square mile |
| San Francisco: | 17,458 people per square mile |
Median household income in 2021:
| Lake Shore: | $104,791 |
| San Francisco: | $121,826 |
Median rent in in 2021:
| Lake Shore: | $2,964 |
| San Francisco: | $2,001 |
Male vs Females
| Males: | 2,112 |
| Females: | 2,193 |
Median age
| Males: | 35.6 years |
| Females: | 37.4 years |
Housing prices:
Average estimated value of detached houses in 2021 (68.6% of all units):
| Lake Shore: | $1,613,670 |
| San Francisco: | $1,815,784 |
Average estimated value of townhouses or other attached units in 2021 (153.7% of all units):
| This neighborhood: | $1,361,858 |
| city: | $1,506,493 |
Average estimated '21 value of housing units in 5-or-more-unit structures (13.1% of all units):
| Lake Shore: | $862,037 |
| San Francisco: | $1,317,001 |
Most popular occupations of males: sales and office occupations (13.9%); service occupations (13.6%); management occupations (except farmers) (12.0%); business and financial operations occupations (11.8%); healthcare practitioners and technical occupations (9.3%); transportation occupations (6.1%); education, training, and library occupations (5.2%)
Most popular occupations of females: sales and office occupations (25.3%); service occupations (19.3%); business and financial operations occupations (16.6%); education, training, and library occupations (10.8%); healthcare practitioners and technical occupations (9.7%); management occupations (except farmers) (6.2%); arts, design, entertainment, sports, and media occupations (4.6%)
Highways in this neighborhood: State Hwy 35 (Skyline Blvd).
Roads and streets: Lake Merced Blvd; John Muir Dr; Sloat Blvd; Lakeshore Dr; Ocean Ave; Gellert Dr; Harding Rd; Upper Great Hwy (Great Hwy); Country Club Dr; Eucalyptus Dr; Sunset Blvd; Lake Merced Hill So St; Morningside Dr; Middlefield Dr; Clearfield Dr; Armory Rd; Fort Funston Rd; Herbst Rd; Everglade Dr; Riverton Dr; Forest View Dr; Sylvan Dr; Meadowbrook Dr; Huntington Dr; Inverness Dr; Springfield Dr; Lake Merced Hill No St; Emerald Ln; Zoo Rd; Brookhaven Ln; Lake Merced Hill; Westmoorland Dr; Bonnie Brae Ln; Berkshire Way; Havenside Dr; Lancaster Ln; Lakeshore Plz.
Roads and streets: John Muir Dr.
Lake Shore neighborhood detailed profile
Lakeside neighborhood in San Francisco statistics: (Find on map)
Area: 0.173 square miles
Population: 1,238
Population density:
Median household income in 2021:
Median rent in in 2021:
Male vs Females
Median age
Housing prices:
Average estimated value of detached houses in 2021 (102.5% of all units):
Average estimated value of townhouses or other attached units in 2021 (5.2% of all units):
Average estimated '21 value of housing units in 5-or-more-unit structures (14.4% of all units):
Most popular occupations of males: sales and office occupations (20.4%); management occupations (except farmers) (19.9%); computer and mathematical occupations (15.2%); construction, extraction, and maintenance occupations (11.2%); healthcare practitioners and technical occupations (9.0%); material moving occupations (7.9%); production occupations (7.6%)
Most popular occupations of females: sales and office occupations (32.6%); business and financial operations occupations (28.2%); management occupations (except farmers) (9.5%); healthcare practitioners and technical occupations (9.4%); education, training, and library occupations (8.1%); service occupations (3.3%); life, physical, and social science occupations (2.9%)
Highways in this neighborhood: State Hwy 1 (19th Ave).
Roads and streets: Junipero Serra Blvd; Stonecrest Dr; Stratford Dr; Denslowe Dr; Sloat Blvd; Holloway Ave; Broadmoor Dr; Ocean Ave; Rossmoor Dr; Lagunitas Dr; Eucalyptus Dr; Woodacre Dr; Winston Dr; Wyton Ln; Beachmont Dr; Lyndhurst Dr; Cranleigh Dr; Elmhurst Dr; Banbury Dr; Gladiolus Ln.
Lakeside neighborhood detailed profile
Area: 0.173 square miles
Population: 1,238
Population density:
| Lakeside: | 7,167 people per square mile |
| San Francisco: | 17,458 people per square mile |
Median household income in 2021:
| Lakeside: | $94,009 |
| San Francisco: | $121,826 |
Median rent in in 2021:
| Lakeside: | $2,200 |
| San Francisco: | $2,001 |
Male vs Females
| Males: | 458 |
| Females: | 780 |
Median age
| Males: | 35.1 years |
| Females: | 34.0 years |
Housing prices:
Average estimated value of detached houses in 2021 (102.5% of all units):
| Lakeside: | $1,434,239 |
| San Francisco: | $1,815,784 |
Average estimated value of townhouses or other attached units in 2021 (5.2% of all units):
| This neighborhood: | $1,711,927 |
| city: | $1,506,493 |
Average estimated '21 value of housing units in 5-or-more-unit structures (14.4% of all units):
| Lakeside: | $920,105 |
| San Francisco: | $1,317,001 |
Most popular occupations of males: sales and office occupations (20.4%); management occupations (except farmers) (19.9%); computer and mathematical occupations (15.2%); construction, extraction, and maintenance occupations (11.2%); healthcare practitioners and technical occupations (9.0%); material moving occupations (7.9%); production occupations (7.6%)
Most popular occupations of females: sales and office occupations (32.6%); business and financial operations occupations (28.2%); management occupations (except farmers) (9.5%); healthcare practitioners and technical occupations (9.4%); education, training, and library occupations (8.1%); service occupations (3.3%); life, physical, and social science occupations (2.9%)
Highways in this neighborhood: State Hwy 1 (19th Ave).
Roads and streets: Junipero Serra Blvd; Stonecrest Dr; Stratford Dr; Denslowe Dr; Sloat Blvd; Holloway Ave; Broadmoor Dr; Ocean Ave; Rossmoor Dr; Lagunitas Dr; Eucalyptus Dr; Woodacre Dr; Winston Dr; Wyton Ln; Beachmont Dr; Lyndhurst Dr; Cranleigh Dr; Elmhurst Dr; Banbury Dr; Gladiolus Ln.
Lakeside neighborhood detailed profile
Laurel Heights neighborhood in San Francisco statistics: (Find on map)
Area: 0.211 square miles
Population: 6,044
Population density:
Median household income in 2021:
Median rent in in 2021:
Male vs Females
Median age
Housing prices:
Average estimated value of detached houses in 2021 (3.3% of all units):
Average estimated value of townhouses or other attached units in 2021 (2.5% of all units):
Average estimated value of housing units in 2-unit structures in 2021 (16.6% of all units):
Average estimated '21 value of housing units in 3-to-4-unit structures (30.1% of all units):
Average estimated '21 value of housing units in 5-or-more-unit structures (9.9% of all units):
Most popular occupations of males: arts, design, entertainment, sports, and media occupations (16.8%); architecture and engineering occupations (16.3%); sales and office occupations (12.2%); management occupations (except farmers) (11.2%); computer and mathematical occupations (11.1%); service occupations (10.8%); education, training, and library occupations (5.9%)
Most popular occupations of females: service occupations (26.3%); sales and office occupations (23.1%); healthcare practitioners and technical occupations (12.0%); computer and mathematical occupations (10.3%); management occupations (except farmers) (8.6%); arts, design, entertainment, sports, and media occupations (6.2%); architecture and engineering occupations (5.8%)
Roads and streets: Euclid Ave; Mayfair Dr; Laurel St; Spruce St; Lupine Ave; Arguello Blvd; Iris Ave; Manzanita Ave; Heather Ave; Collins St; Wood St; Dicha Aly (Lupine Ave).
Laurel Heights neighborhood detailed profile
Area: 0.211 square miles
Population: 6,044
Population density:
| Laurel Heights (Jordan Park): | 28,632 people per square mile |
| San Francisco: | 17,458 people per square mile |
Median household income in 2021:
| Laurel Heights (Jordan Park): | $131,705 |
| San Francisco: | $121,826 |
Median rent in in 2021:
| Laurel Heights (Jordan Park): | $2,007 |
| San Francisco: | $2,001 |
Male vs Females
| Males: | 2,687 |
| Females: | 3,356 |
Median age
| Males: | 35.8 years |
| Females: | 35.2 years |
Housing prices:
Average estimated value of detached houses in 2021 (3.3% of all units):
| Laurel Heights (Jordan Park): | $4,126,267 |
| San Francisco: | $1,815,784 |
Average estimated value of townhouses or other attached units in 2021 (2.5% of all units):
| This neighborhood: | $1,076,915 |
| city: | $1,506,493 |
Average estimated value of housing units in 2-unit structures in 2021 (16.6% of all units):
| This neighborhood: | $852,496 |
| San Francisco: | $1,685,431 |
Average estimated '21 value of housing units in 3-to-4-unit structures (30.1% of all units):
| Laurel Heights (Jordan Park): | $1,715,510 |
| city: | $1,521,789 |
Average estimated '21 value of housing units in 5-or-more-unit structures (9.9% of all units):
| Laurel Heights (Jordan Park): | $2,046,216 |
| San Francisco: | $1,317,001 |
Most popular occupations of males: arts, design, entertainment, sports, and media occupations (16.8%); architecture and engineering occupations (16.3%); sales and office occupations (12.2%); management occupations (except farmers) (11.2%); computer and mathematical occupations (11.1%); service occupations (10.8%); education, training, and library occupations (5.9%)
Most popular occupations of females: service occupations (26.3%); sales and office occupations (23.1%); healthcare practitioners and technical occupations (12.0%); computer and mathematical occupations (10.3%); management occupations (except farmers) (8.6%); arts, design, entertainment, sports, and media occupations (6.2%); architecture and engineering occupations (5.8%)
Roads and streets: Euclid Ave; Mayfair Dr; Laurel St; Spruce St; Lupine Ave; Arguello Blvd; Iris Ave; Manzanita Ave; Heather Ave; Collins St; Wood St; Dicha Aly (Lupine Ave).
Laurel Heights neighborhood detailed profile
Laurel Village neighborhood in San Francisco statistics: (Find on map)
Area: 0.015 square miles
Population: 458
Population density:
Median household income in 2021:
Median rent in in 2021:
Male vs Females
Median age
Housing prices:
Average estimated value of detached houses in 2021 (1.5% of all units):
Average estimated value of townhouses or other attached units in 2021 (2.2% of all units):
Average estimated value of housing units in 2-unit structures in 2021 (4.7% of all units):
Average estimated '21 value of housing units in 3-to-4-unit structures (6.9% of all units):
Average estimated '21 value of housing units in 5-or-more-unit structures (54.0% of all units):
Most popular occupations of males: sales and office occupations (24.8%); service occupations (20.2%); arts, design, entertainment, sports, and media occupations (13.6%); management occupations (except farmers) (9.1%); computer and mathematical occupations (8.7%); production occupations (7.9%); healthcare practitioners and technical occupations (5.3%)
Most popular occupations of females: arts, design, entertainment, sports, and media occupations (30.6%); community and social services occupations (27.2%); management occupations (except farmers) (19.7%); business and financial operations occupations (14.3%); service occupations (9.9%); computer and mathematical occupations (9.5%); sales and office occupations (8.2%)
Roads and streets: California St; Mayfair Dr; Laurel St; Spruce St; Locust St.
Laurel Village neighborhood detailed profile
Area: 0.015 square miles
Population: 458
Population density:
| Laurel Village: | 30,046 people per square mile |
| San Francisco: | 17,458 people per square mile |
Median household income in 2021:
| Laurel Village: | $30,568 |
| San Francisco: | $121,826 |
Median rent in in 2021:
| Laurel Village: | $474 |
| San Francisco: | $2,001 |
Male vs Females
| Males: | 180 |
| Females: | 278 |
Median age
| Males: | 44.3 years |
| Females: | 65.1 years |
Housing prices:
Average estimated value of detached houses in 2021 (1.5% of all units):
| Laurel Village: | $6,110,655 |
| San Francisco: | $1,815,784 |
Average estimated value of townhouses or other attached units in 2021 (2.2% of all units):
| This neighborhood: | $4,014,286 |
| city: | $1,506,493 |
Average estimated value of housing units in 2-unit structures in 2021 (4.7% of all units):
| This neighborhood: | $3,240,870 |
| San Francisco: | $1,685,431 |
Average estimated '21 value of housing units in 3-to-4-unit structures (6.9% of all units):
| Laurel Village: | $2,010,000 |
| city: | $1,521,789 |
Average estimated '21 value of housing units in 5-or-more-unit structures (54.0% of all units):
| Laurel Village: | $1,836,871 |
| San Francisco: | $1,317,001 |
Most popular occupations of males: sales and office occupations (24.8%); service occupations (20.2%); arts, design, entertainment, sports, and media occupations (13.6%); management occupations (except farmers) (9.1%); computer and mathematical occupations (8.7%); production occupations (7.9%); healthcare practitioners and technical occupations (5.3%)
Most popular occupations of females: arts, design, entertainment, sports, and media occupations (30.6%); community and social services occupations (27.2%); management occupations (except farmers) (19.7%); business and financial operations occupations (14.3%); service occupations (9.9%); computer and mathematical occupations (9.5%); sales and office occupations (8.2%)
Roads and streets: California St; Mayfair Dr; Laurel St; Spruce St; Locust St.
Laurel Village neighborhood detailed profile
Little Hollywood neighborhood in San Francisco statistics: (Find on map)
Area: 0.098 square miles
Population: 1,056
Population density:
Median household income in 2021:
Median rent in in 2021:
Male vs Females
Median age
Housing prices:
Average estimated value of detached houses in 2021 (35.1% of all units):
Average estimated value of townhouses or other attached units in 2021 (9.1% of all units):
Average estimated value of housing units in 2-unit structures in 2021 (22.5% of all units):
Most popular occupations of males: service occupations (19.8%); sales and office occupations (17.9%); transportation occupations (13.6%); management occupations (except farmers) (10.1%); construction, extraction, and maintenance occupations (6.1%); business and financial operations occupations (4.5%); production occupations (4.5%)
Most popular occupations of females: service occupations (36.9%); sales and office occupations (19.3%); management occupations (except farmers) (13.7%); business and financial operations occupations (8.9%); life, physical, and social science occupations (7.9%); transportation occupations (3.7%); production occupations (2.7%)
Limited-access highways (interstate or state) in this neighborhood: US Hwy 101 (James Lick Fwy).
Roads and streets: Lathrop Ave; Blanken Ave; Tocoloma Ave; Wheeler Ave; Peninsula Ave; Nueva Ave; Gillette Ave; Hester Ave; Tunnel Ave; Nibbi Ct; McKinley Ave.
Little Hollywood neighborhood detailed profile
Area: 0.098 square miles
Population: 1,056
Population density:
| Little Hollywood: | 10,783 people per square mile |
| San Francisco: | 17,458 people per square mile |
Median household income in 2021:
| Little Hollywood: | $89,125 |
| San Francisco: | $121,826 |
Median rent in in 2021:
| Little Hollywood: | $1,350 |
| San Francisco: | $2,001 |
Male vs Females
| Males: | 554 |
| Females: | 501 |
Median age
| Males: | 35.7 years |
| Females: | 32.4 years |
Housing prices:
Average estimated value of detached houses in 2021 (35.1% of all units):
| Little Hollywood: | $1,009,752 |
| San Francisco: | $1,815,784 |
Average estimated value of townhouses or other attached units in 2021 (9.1% of all units):
| This neighborhood: | $1,075,882 |
| city: | $1,506,493 |
Average estimated value of housing units in 2-unit structures in 2021 (22.5% of all units):
| This neighborhood: | $646,124 |
| San Francisco: | $1,685,431 |
Most popular occupations of males: service occupations (19.8%); sales and office occupations (17.9%); transportation occupations (13.6%); management occupations (except farmers) (10.1%); construction, extraction, and maintenance occupations (6.1%); business and financial operations occupations (4.5%); production occupations (4.5%)
Most popular occupations of females: service occupations (36.9%); sales and office occupations (19.3%); management occupations (except farmers) (13.7%); business and financial operations occupations (8.9%); life, physical, and social science occupations (7.9%); transportation occupations (3.7%); production occupations (2.7%)
Limited-access highways (interstate or state) in this neighborhood: US Hwy 101 (James Lick Fwy).
Roads and streets: Lathrop Ave; Blanken Ave; Tocoloma Ave; Wheeler Ave; Peninsula Ave; Nueva Ave; Gillette Ave; Hester Ave; Tunnel Ave; Nibbi Ct; McKinley Ave.
Little Hollywood neighborhood detailed profile
Little Russia neighborhood in San Francisco statistics: (Find on map)
Area: 0.090 square miles
Population: 2,680
Population density:
Median household income in 2021:
Median rent in in 2021:
Male vs Females
Median age
Housing prices:
Average estimated value of detached houses in 2021 (8.1% of all units):
Average estimated value of townhouses or other attached units in 2021 (9.2% of all units):
Average estimated value of housing units in 2-unit structures in 2021 (21.7% of all units):
Average estimated '21 value of housing units in 3-to-4-unit structures (20.5% of all units):
Most popular occupations of males: management occupations (except farmers) (32.2%); business and financial operations occupations (15.4%); sales and office occupations (8.3%); computer and mathematical occupations (7.6%); arts, design, entertainment, sports, and media occupations (7.2%); service occupations (6.3%); community and social services occupations (4.7%)
Most popular occupations of females: sales and office occupations (16.6%); business and financial operations occupations (14.2%); service occupations (14.2%); management occupations (except farmers) (11.9%); education, training, and library occupations (11.5%); healthcare practitioners and technical occupations (9.3%); arts, design, entertainment, sports, and media occupations (7.6%)
Roads and streets: Geary Blvd.
Little Russia neighborhood detailed profile
Area: 0.090 square miles
Population: 2,680
Population density:
| Little Russia: | 29,776 people per square mile |
| San Francisco: | 17,458 people per square mile |
Median household income in 2021:
| Little Russia: | $107,169 |
| San Francisco: | $121,826 |
Median rent in in 2021:
| Little Russia: | $2,129 |
| San Francisco: | $2,001 |
Male vs Females
| Males: | 1,265 |
| Females: | 1,414 |
Median age
| Males: | 37.4 years |
| Females: | 38.7 years |
Housing prices:
Average estimated value of detached houses in 2021 (8.1% of all units):
| Little Russia: | $1,843,749 |
| San Francisco: | $1,815,784 |
Average estimated value of townhouses or other attached units in 2021 (9.2% of all units):
| This neighborhood: | $1,661,765 |
| city: | $1,506,493 |
Average estimated value of housing units in 2-unit structures in 2021 (21.7% of all units):
| This neighborhood: | $916,767 |
| San Francisco: | $1,685,431 |
Average estimated '21 value of housing units in 3-to-4-unit structures (20.5% of all units):
| Little Russia: | $1,098,139 |
| city: | $1,521,789 |
Most popular occupations of males: management occupations (except farmers) (32.2%); business and financial operations occupations (15.4%); sales and office occupations (8.3%); computer and mathematical occupations (7.6%); arts, design, entertainment, sports, and media occupations (7.2%); service occupations (6.3%); community and social services occupations (4.7%)
Most popular occupations of females: sales and office occupations (16.6%); business and financial operations occupations (14.2%); service occupations (14.2%); management occupations (except farmers) (11.9%); education, training, and library occupations (11.5%); healthcare practitioners and technical occupations (9.3%); arts, design, entertainment, sports, and media occupations (7.6%)
Roads and streets: Geary Blvd.
Little Russia neighborhood detailed profile
Little Saigon neighborhood in San Francisco statistics: (Find on map)
Area: 0.009 square miles
Roads and streets: Larkin St.
Little Saigon neighborhood detailed profile
Area: 0.009 square miles
Roads and streets: Larkin St.
Little Saigon neighborhood detailed profile
Lone Mountain neighborhood in San Francisco statistics: (Find on map)
Area: 0.307 square miles
Population: 8,131
Population density:
Median household income in 2021:
Median rent in in 2021:
Male vs Females
Median age
Housing prices:
Average estimated value of detached houses in 2021 (7.1% of all units):
Average estimated value of townhouses or other attached units in 2021 (7.3% of all units):
Average estimated value of housing units in 2-unit structures in 2021 (24.9% of all units):
Average estimated '21 value of housing units in 3-to-4-unit structures (20.8% of all units):
Average estimated '21 value of housing units in 5-or-more-unit structures (19.3% of all units):
Most popular occupations of males: management occupations (except farmers) (18.4%); service occupations (16.6%); computer and mathematical occupations (15.9%); sales and office occupations (12.4%); business and financial operations occupations (9.1%); education, training, and library occupations (5.4%); transportation occupations (4.9%)
Most popular occupations of females: sales and office occupations (22.5%); service occupations (14.5%); management occupations (except farmers) (13.5%); computer and mathematical occupations (13.1%); education, training, and library occupations (9.5%); business and financial operations occupations (9.1%); legal occupations (5.8%)
Roads and streets: Geary Blvd; Fulton St; Turk Blvd (Turk St); Anza St; Golden Gate Ave; Arguello Blvd; Stanyan St; Parker Ave; McAllister St; Beaumont Ave; N Willard St; Ewing Ter; Lone Mountain Ter; Rossi Ave; Edward St; Collins St; Blake St; Cook St; Spruce St; Wood St; Almaden Ct; Temescal Ter; Chabot Ter; Kittredge Ter; Roselyn Ter; Tamalpais Ter; Annapolis Ter; Parsons St; Hemway Ter; Paramount Ter; Atalaya Ter; Loyola Ter; Loraine Ct; Jean Way.
Lone Mountain neighborhood detailed profile
Area: 0.307 square miles
Population: 8,131
Population density:
| Lone Mountain: | 26,506 people per square mile |
| San Francisco: | 17,458 people per square mile |
Median household income in 2021:
| Lone Mountain: | $143,298 |
| San Francisco: | $121,826 |
Median rent in in 2021:
| Lone Mountain: | $1,726 |
| San Francisco: | $2,001 |
Male vs Females
| Males: | 3,989 |
| Females: | 4,141 |
Median age
| Males: | 39.8 years |
| Females: | 39.7 years |
Housing prices:
Average estimated value of detached houses in 2021 (7.1% of all units):
| Lone Mountain: | $4,126,267 |
| San Francisco: | $1,815,784 |
Average estimated value of townhouses or other attached units in 2021 (7.3% of all units):
| This neighborhood: | $3,065,000 |
| city: | $1,506,493 |
Average estimated value of housing units in 2-unit structures in 2021 (24.9% of all units):
| This neighborhood: | $2,034,946 |
| San Francisco: | $1,685,431 |
Average estimated '21 value of housing units in 3-to-4-unit structures (20.8% of all units):
| Lone Mountain: | $1,446,667 |
| city: | $1,521,789 |
Average estimated '21 value of housing units in 5-or-more-unit structures (19.3% of all units):
| Lone Mountain: | $2,046,216 |
| San Francisco: | $1,317,001 |
Most popular occupations of males: management occupations (except farmers) (18.4%); service occupations (16.6%); computer and mathematical occupations (15.9%); sales and office occupations (12.4%); business and financial operations occupations (9.1%); education, training, and library occupations (5.4%); transportation occupations (4.9%)
Most popular occupations of females: sales and office occupations (22.5%); service occupations (14.5%); management occupations (except farmers) (13.5%); computer and mathematical occupations (13.1%); education, training, and library occupations (9.5%); business and financial operations occupations (9.1%); legal occupations (5.8%)
Roads and streets: Geary Blvd; Fulton St; Turk Blvd (Turk St); Anza St; Golden Gate Ave; Arguello Blvd; Stanyan St; Parker Ave; McAllister St; Beaumont Ave; N Willard St; Ewing Ter; Lone Mountain Ter; Rossi Ave; Edward St; Collins St; Blake St; Cook St; Spruce St; Wood St; Almaden Ct; Temescal Ter; Chabot Ter; Kittredge Ter; Roselyn Ter; Tamalpais Ter; Annapolis Ter; Parsons St; Hemway Ter; Paramount Ter; Atalaya Ter; Loyola Ter; Loraine Ct; Jean Way.
Lone Mountain neighborhood detailed profile
Lower Haight neighborhood in San Francisco statistics: (Find on map)
Area: 0.236 square miles
Population: 9,531
Population density:
Median household income in 2021:
Median rent in in 2021:
Male vs Females
Median age
Housing prices:
Average estimated value of detached houses in 2021 (5.0% of all units):
Average estimated value of townhouses or other attached units in 2021 (10.9% of all units):
Average estimated value of housing units in 2-unit structures in 2021 (12.3% of all units):
Average estimated '21 value of housing units in 3-to-4-unit structures (36.0% of all units):
Average estimated '21 value of housing units in 5-or-more-unit structures (4.4% of all units):
Most popular occupations of males: computer and mathematical occupations (24.1%); management occupations (except farmers) (18.2%); business and financial operations occupations (11.8%); sales and office occupations (9.8%); service occupations (6.2%); life, physical, and social science occupations (4.3%); arts, design, entertainment, sports, and media occupations (3.9%)
Most popular occupations of females: sales and office occupations (20.3%); healthcare practitioners and technical occupations (16.9%); management occupations (except farmers) (13.8%); business and financial operations occupations (13.5%); computer and mathematical occupations (8.1%); service occupations (7.9%); architecture and engineering occupations (7.5%)
Roads and streets: Page St; Haight St; Waller St; Hermann St; Market St; Lily St; Laguna St; Scott St; Webster St; Buchanan St; Rose St; Germania St; Laussat St; Octavia St; Pierce St; Fillmore St; Steiner St; Gough St; Potomac St; Divisadero St; Carmelita St; Guerrero St.
Lower Haight neighborhood detailed profile
Area: 0.236 square miles
Population: 9,531
Population density:
| Lower Haight: | 40,341 people per square mile |
| San Francisco: | 17,458 people per square mile |
Median household income in 2021:
| Lower Haight: | $212,904 |
| San Francisco: | $121,826 |
Median rent in in 2021:
| Lower Haight: | $2,246 |
| San Francisco: | $2,001 |
Male vs Females
| Males: | 5,348 |
| Females: | 4,182 |
Median age
| Males: | 34.0 years |
| Females: | 35.1 years |
Housing prices:
Average estimated value of detached houses in 2021 (5.0% of all units):
| Lower Haight: | $1,597,246 |
| San Francisco: | $1,815,784 |
Average estimated value of townhouses or other attached units in 2021 (10.9% of all units):
| This neighborhood: | $1,584,338 |
| city: | $1,506,493 |
Average estimated value of housing units in 2-unit structures in 2021 (12.3% of all units):
| This neighborhood: | $2,855,128 |
| San Francisco: | $1,685,431 |
Average estimated '21 value of housing units in 3-to-4-unit structures (36.0% of all units):
| Lower Haight: | $1,317,389 |
| city: | $1,521,789 |
Average estimated '21 value of housing units in 5-or-more-unit structures (4.4% of all units):
| Lower Haight: | $1,290,545 |
| San Francisco: | $1,317,001 |
Most popular occupations of males: computer and mathematical occupations (24.1%); management occupations (except farmers) (18.2%); business and financial operations occupations (11.8%); sales and office occupations (9.8%); service occupations (6.2%); life, physical, and social science occupations (4.3%); arts, design, entertainment, sports, and media occupations (3.9%)
Most popular occupations of females: sales and office occupations (20.3%); healthcare practitioners and technical occupations (16.9%); management occupations (except farmers) (13.8%); business and financial operations occupations (13.5%); computer and mathematical occupations (8.1%); service occupations (7.9%); architecture and engineering occupations (7.5%)
Roads and streets: Page St; Haight St; Waller St; Hermann St; Market St; Lily St; Laguna St; Scott St; Webster St; Buchanan St; Rose St; Germania St; Laussat St; Octavia St; Pierce St; Fillmore St; Steiner St; Gough St; Potomac St; Divisadero St; Carmelita St; Guerrero St.
Lower Haight neighborhood detailed profile
Lower Nob Hill neighborhood in San Francisco statistics: (Find on map)
Area: 0.273 square miles
Population: 11,520
Population density:
Median household income in 2021:
Median rent in in 2021:
Male vs Females
Median age
Average estimated '21 value of housing units in 5-or-more-unit structures (13.2% of all units):
Most popular occupations of males: management occupations (except farmers) (20.8%); service occupations (14.7%); business and financial operations occupations (14.3%); computer and mathematical occupations (12.1%); sales and office occupations (6.7%); education, training, and library occupations (6.5%); arts, design, entertainment, sports, and media occupations (4.2%)
Most popular occupations of females: sales and office occupations (21.8%); management occupations (except farmers) (14.8%); community and social services occupations (13.6%); business and financial operations occupations (12.4%); arts, design, entertainment, sports, and media occupations (9.9%); healthcare practitioners and technical occupations (6.3%); computer and mathematical occupations (5.3%)
Roads and streets: Post St; Sutter St; Bush St; Pine St; California St; Powell St; Mason St; Taylor St; Larkin St; Polk St; Leavenworth St; Jones St; Hyde St; Hemlock St; Cedar St; Fern St; Frank Norris St (Austin St); Cosmo Pl; Geary St; Derby St; Nob Hill Cir; Isadora Duncan Ln; Helen Pl (Helen St); Acorn Aly; Vine Ter; Meacham Pl; Nob Hill Pl; Hobart Aly; Colin Pl; Touchard St; Trader Vic Aly; Ophir Aly; Shannon St.
Lower Nob Hill neighborhood detailed profile
Area: 0.273 square miles
Population: 11,520
Population density:
| Lower Nob Hill: | 42,232 people per square mile |
| San Francisco: | 17,458 people per square mile |
Median household income in 2021:
| Lower Nob Hill: | $107,114 |
| San Francisco: | $121,826 |
Median rent in in 2021:
| Lower Nob Hill: | $1,872 |
| San Francisco: | $2,001 |
Male vs Females
| Males: | 5,747 |
| Females: | 5,773 |
Median age
| Males: | 39.2 years |
| Females: | 36.1 years |
Average estimated '21 value of housing units in 5-or-more-unit structures (13.2% of all units):
| Lower Nob Hill: | $2,056,207 |
| San Francisco: | $1,317,001 |
Most popular occupations of males: management occupations (except farmers) (20.8%); service occupations (14.7%); business and financial operations occupations (14.3%); computer and mathematical occupations (12.1%); sales and office occupations (6.7%); education, training, and library occupations (6.5%); arts, design, entertainment, sports, and media occupations (4.2%)
Most popular occupations of females: sales and office occupations (21.8%); management occupations (except farmers) (14.8%); community and social services occupations (13.6%); business and financial operations occupations (12.4%); arts, design, entertainment, sports, and media occupations (9.9%); healthcare practitioners and technical occupations (6.3%); computer and mathematical occupations (5.3%)
Roads and streets: Post St; Sutter St; Bush St; Pine St; California St; Powell St; Mason St; Taylor St; Larkin St; Polk St; Leavenworth St; Jones St; Hyde St; Hemlock St; Cedar St; Fern St; Frank Norris St (Austin St); Cosmo Pl; Geary St; Derby St; Nob Hill Cir; Isadora Duncan Ln; Helen Pl (Helen St); Acorn Aly; Vine Ter; Meacham Pl; Nob Hill Pl; Hobart Aly; Colin Pl; Touchard St; Trader Vic Aly; Ophir Aly; Shannon St.
Lower Nob Hill neighborhood detailed profile
Lower Pacific Heights neighborhood in San Francisco statistics: (Find on map)
Area: 0.351 square miles
Population: 8,242
Population density:
Median household income in 2021:
Median rent in in 2021:
Male vs Females
Median age
Most popular occupations of males: business and financial operations occupations (18.8%); management occupations (except farmers) (15.8%); arts, design, entertainment, sports, and media occupations (14.4%); sales and office occupations (14.3%); computer and mathematical occupations (10.6%); construction, extraction, and maintenance occupations (6.4%); transportation occupations (3.8%)
Most popular occupations of females: management occupations (except farmers) (30.9%); business and financial operations occupations (22.3%); healthcare practitioners and technical occupations (13.4%); sales and office occupations (13.3%); arts, design, entertainment, sports, and media occupations (5.5%); education, training, and library occupations (4.8%); legal occupations (1.9%)
Roads and streets: Post St; Bush St; Pine St; Sutter St; Divisadero St; Webster St; Lyon St; Broderick St; Wilmot St; Octavia St; Buchanan St; Fillmore St; Pierce St; Steiner St; Baker St; Scott St; Laguna St; Hemlock St; Garden St; Presidio Ave; Cottage Row; Leona Ter; Avery St; Erkson Ct.
Lower Pacific Heights neighborhood detailed profile
Area: 0.351 square miles
Population: 8,242
Population density:
| Lower Pacific Heights: | 23,484 people per square mile |
| San Francisco: | 17,458 people per square mile |
Median household income in 2021:
| Lower Pacific Heights: | $116,920 |
| San Francisco: | $121,826 |
Median rent in in 2021:
| Lower Pacific Heights: | $2,059 |
| San Francisco: | $2,001 |
Male vs Females
| Males: | 4,143 |
| Females: | 4,099 |
Median age
| Males: | 44.8 years |
| Females: | 50.3 years |
Most popular occupations of males: business and financial operations occupations (18.8%); management occupations (except farmers) (15.8%); arts, design, entertainment, sports, and media occupations (14.4%); sales and office occupations (14.3%); computer and mathematical occupations (10.6%); construction, extraction, and maintenance occupations (6.4%); transportation occupations (3.8%)
Most popular occupations of females: management occupations (except farmers) (30.9%); business and financial operations occupations (22.3%); healthcare practitioners and technical occupations (13.4%); sales and office occupations (13.3%); arts, design, entertainment, sports, and media occupations (5.5%); education, training, and library occupations (4.8%); legal occupations (1.9%)
Roads and streets: Post St; Bush St; Pine St; Sutter St; Divisadero St; Webster St; Lyon St; Broderick St; Wilmot St; Octavia St; Buchanan St; Fillmore St; Pierce St; Steiner St; Baker St; Scott St; Laguna St; Hemlock St; Garden St; Presidio Ave; Cottage Row; Leona Ter; Avery St; Erkson Ct.
Lower Pacific Heights neighborhood detailed profile
Marina District neighborhood in San Francisco statistics: (Find on map)
Area: 0.618 square miles
Population: 11,734
Population density:
Median household income in 2021:
Median rent in in 2021:
Male vs Females
Median age
Most popular occupations of males: management occupations (except farmers) (29.7%); sales and office occupations (27.9%); business and financial operations occupations (17.1%); arts, design, entertainment, sports, and media occupations (8.6%); computer and mathematical occupations (6.8%); architecture and engineering occupations (3.9%); transportation occupations (2.1%)
Most popular occupations of females: management occupations (except farmers) (27.3%); sales and office occupations (22.5%); business and financial operations occupations (11.2%); education, training, and library occupations (10.9%); healthcare practitioners and technical occupations (8.7%); arts, design, entertainment, sports, and media occupations (8.3%); legal occupations (5.9%)
Roads and streets: Marina Blvd; Chestnut St; Bay St; Beach St; Fillmore St; Francisco St; N Point St; Van Ness Ave; Jefferson St; Marina Green Dr; Scott St; Avila St; Cervantes Blvd; Divisadero St; Broderick St; Baker St; Alhambra St; Pope Rd; Yacht Road 1; Mallorca Way; Laguna St; Webster St; Pierce St; McDowell Ave; Franklin St; Macarthur Ave; Magnolia St; Capra Way; Franklin St (Funston Rd); Lyon St; Buchanan St; Fort Mason 10; Rico Way; Retiro Way; Toledo Way; Casa Way; Fort Mason 11; Octavia St; Gough St; Prado St; Fort Mason 12; Schofield Rd; Fort Mason 13; Fort Mason 16.
Marina District neighborhood detailed profile
Area: 0.618 square miles
Population: 11,734
Population density:
| Marina District: | 18,995 people per square mile |
| San Francisco: | 17,458 people per square mile |
Median household income in 2021:
| Marina District: | $217,839 |
| San Francisco: | $121,826 |
Median rent in in 2021:
| Marina District: | $2,785 |
| San Francisco: | $2,001 |
Male vs Females
| Males: | 5,798 |
| Females: | 5,935 |
Median age
| Males: | 34.1 years |
| Females: | 35.0 years |
Most popular occupations of males: management occupations (except farmers) (29.7%); sales and office occupations (27.9%); business and financial operations occupations (17.1%); arts, design, entertainment, sports, and media occupations (8.6%); computer and mathematical occupations (6.8%); architecture and engineering occupations (3.9%); transportation occupations (2.1%)
Most popular occupations of females: management occupations (except farmers) (27.3%); sales and office occupations (22.5%); business and financial operations occupations (11.2%); education, training, and library occupations (10.9%); healthcare practitioners and technical occupations (8.7%); arts, design, entertainment, sports, and media occupations (8.3%); legal occupations (5.9%)
Roads and streets: Marina Blvd; Chestnut St; Bay St; Beach St; Fillmore St; Francisco St; N Point St; Van Ness Ave; Jefferson St; Marina Green Dr; Scott St; Avila St; Cervantes Blvd; Divisadero St; Broderick St; Baker St; Alhambra St; Pope Rd; Yacht Road 1; Mallorca Way; Laguna St; Webster St; Pierce St; McDowell Ave; Franklin St; Macarthur Ave; Magnolia St; Capra Way; Franklin St (Funston Rd); Lyon St; Buchanan St; Fort Mason 10; Rico Way; Retiro Way; Toledo Way; Casa Way; Fort Mason 11; Octavia St; Gough St; Prado St; Fort Mason 12; Schofield Rd; Fort Mason 13; Fort Mason 16.
Marina District neighborhood detailed profile
Mastro neighborhood in San Francisco statistics: (Find on map)
Area: 0.126 square miles
Population: 4,132
Population density:
Median household income in 2021:
Median rent in in 2021:
Male vs Females
Median age
Housing prices:
Average estimated value of detached houses in 2021 (2.5% of all units):
Average estimated value of townhouses or other attached units in 2021 (3.3% of all units):
Average estimated value of housing units in 2-unit structures in 2021 (8.7% of all units):
Average estimated '21 value of housing units in 3-to-4-unit structures (30.7% of all units):
Average estimated '21 value of housing units in 5-or-more-unit structures (13.9% of all units):
Most popular occupations of males: management occupations (except farmers) (33.5%); computer and mathematical occupations (17.2%); service occupations (7.7%); business and financial operations occupations (7.6%); sales and office occupations (7.6%); arts, design, entertainment, sports, and media occupations (5.2%); healthcare practitioners and technical occupations (3.1%)
Most popular occupations of females: business and financial operations occupations (30.8%); sales and office occupations (19.5%); management occupations (except farmers) (12.9%); arts, design, entertainment, sports, and media occupations (10.1%); computer and mathematical occupations (5.5%); education, training, and library occupations (4.5%); healthcare practitioners and technical occupations (3.2%)
Roads and streets: Dolores St; 16th St; 15th St; Landers St; Church St; Chula Ln; Sharon St; Alert Aly; 14th St; 17th St; Abbey St; Dehon St; Harlow St.
Mastro neighborhood detailed profile
Area: 0.126 square miles
Population: 4,132
Population density:
| Mastro: | 32,850 people per square mile |
| San Francisco: | 17,458 people per square mile |
Median household income in 2021:
| Mastro: | $174,816 |
| San Francisco: | $121,826 |
Median rent in in 2021:
| Mastro: | $2,218 |
| San Francisco: | $2,001 |
Male vs Females
| Males: | 2,604 |
| Females: | 1,528 |
Median age
| Males: | 40.8 years |
| Females: | 41.4 years |
Housing prices:
Average estimated value of detached houses in 2021 (2.5% of all units):
| Mastro: | $898,966 |
| San Francisco: | $1,815,784 |
Average estimated value of townhouses or other attached units in 2021 (3.3% of all units):
| This neighborhood: | $1,251,020 |
| city: | $1,506,493 |
Average estimated value of housing units in 2-unit structures in 2021 (8.7% of all units):
| This neighborhood: | $883,333 |
| San Francisco: | $1,685,431 |
Average estimated '21 value of housing units in 3-to-4-unit structures (30.7% of all units):
| Mastro: | $584,314 |
| city: | $1,521,789 |
Average estimated '21 value of housing units in 5-or-more-unit structures (13.9% of all units):
| Mastro: | $1,200,538 |
| San Francisco: | $1,317,001 |
Most popular occupations of males: management occupations (except farmers) (33.5%); computer and mathematical occupations (17.2%); service occupations (7.7%); business and financial operations occupations (7.6%); sales and office occupations (7.6%); arts, design, entertainment, sports, and media occupations (5.2%); healthcare practitioners and technical occupations (3.1%)
Most popular occupations of females: business and financial operations occupations (30.8%); sales and office occupations (19.5%); management occupations (except farmers) (12.9%); arts, design, entertainment, sports, and media occupations (10.1%); computer and mathematical occupations (5.5%); education, training, and library occupations (4.5%); healthcare practitioners and technical occupations (3.2%)
Roads and streets: Dolores St; 16th St; 15th St; Landers St; Church St; Chula Ln; Sharon St; Alert Aly; 14th St; 17th St; Abbey St; Dehon St; Harlow St.
Mastro neighborhood detailed profile
Merced Heights neighborhood in San Francisco statistics: (Find on map)
Area: 0.155 square miles
Population: 1,735
Population density:
Median household income in 2021:
Median rent in in 2021:
Male vs Females
Median age
Average estimated value of detached houses in 2021 (100.0% of all units):
Most popular occupations of males: computer and mathematical occupations (21.7%); sales and office occupations (15.3%); healthcare practitioners and technical occupations (12.7%); management occupations (except farmers) (12.2%); material moving occupations (11.6%); production occupations (11.1%); construction, extraction, and maintenance occupations (9.0%)
Most popular occupations of females: business and financial operations occupations (37.3%); sales and office occupations (30.6%); healthcare practitioners and technical occupations (12.4%); education, training, and library occupations (8.8%); management occupations (except farmers) (6.1%); service occupations (3.3%); community and social services occupations (3.0%)
Roads and streets: Garfield St; Orizaba Ave; Ashton Ave; Junipero Serra Blvd; Grafton Ave; Lakeview Ave.
Merced Heights neighborhood detailed profile
Area: 0.155 square miles
Population: 1,735
Population density:
| Merced Heights: | 11,173 people per square mile |
| San Francisco: | 17,458 people per square mile |
Median household income in 2021:
| Merced Heights: | $138,375 |
| San Francisco: | $121,826 |
Median rent in in 2021:
| Merced Heights: | $3,501 |
| San Francisco: | $2,001 |
Male vs Females
| Males: | 582 |
| Females: | 1,152 |
Median age
| Males: | 45.7 years |
| Females: | 39.7 years |
Average estimated value of detached houses in 2021 (100.0% of all units):
| Merced Heights: | $1,323,625 |
| San Francisco: | $1,815,784 |
Most popular occupations of males: computer and mathematical occupations (21.7%); sales and office occupations (15.3%); healthcare practitioners and technical occupations (12.7%); management occupations (except farmers) (12.2%); material moving occupations (11.6%); production occupations (11.1%); construction, extraction, and maintenance occupations (9.0%)
Most popular occupations of females: business and financial operations occupations (37.3%); sales and office occupations (30.6%); healthcare practitioners and technical occupations (12.4%); education, training, and library occupations (8.8%); management occupations (except farmers) (6.1%); service occupations (3.3%); community and social services occupations (3.0%)
Roads and streets: Garfield St; Orizaba Ave; Ashton Ave; Junipero Serra Blvd; Grafton Ave; Lakeview Ave.
Merced Heights neighborhood detailed profile
Merced Manor neighborhood in San Francisco statistics: (Find on map)
Area: 0.105 square miles
Population: 1,008
Population density:
Median household income in 2021:
Median rent in in 2021:
Male vs Females
Median age
Housing prices:
Average estimated value of detached houses in 2021 (72.2% of all units):
Average estimated value of townhouses or other attached units in 2021 (26.4% of all units):
Most popular occupations of males: sales and office occupations (25.6%); business and financial operations occupations (16.4%); management occupations (except farmers) (16.0%); service occupations (15.1%); architecture and engineering occupations (6.4%); arts, design, entertainment, sports, and media occupations (4.6%); material moving occupations (4.6%)
Most popular occupations of females: business and financial operations occupations (23.2%); service occupations (20.6%); sales and office occupations (20.1%); healthcare practitioners and technical occupations (13.6%); arts, design, entertainment, sports, and media occupations (7.9%); transportation occupations (6.7%); education, training, and library occupations (4.3%)
Roads and streets: Sloat Blvd; Eucalyptus Dr; Ocean Ave; 22nd Ave; 21st Ave; 20th Ave; 23rd Ave; 24th Ave; 26th Ave; 25th Ave; Melba Ave.
Merced Manor neighborhood detailed profile
Area: 0.105 square miles
Population: 1,008
Population density:
| Merced Manor: | 9,622 people per square mile |
| San Francisco: | 17,458 people per square mile |
Median household income in 2021:
| Merced Manor: | $78,410 |
| San Francisco: | $121,826 |
Median rent in in 2021:
| Merced Manor: | $2,576 |
| San Francisco: | $2,001 |
Male vs Females
| Males: | 457 |
| Females: | 551 |
Median age
| Males: | 27.5 years |
| Females: | 27.2 years |
Housing prices:
Average estimated value of detached houses in 2021 (72.2% of all units):
| Merced Manor: | $1,626,043 |
| San Francisco: | $1,815,784 |
Average estimated value of townhouses or other attached units in 2021 (26.4% of all units):
| This neighborhood: | $1,438,579 |
| city: | $1,506,493 |
Most popular occupations of males: sales and office occupations (25.6%); business and financial operations occupations (16.4%); management occupations (except farmers) (16.0%); service occupations (15.1%); architecture and engineering occupations (6.4%); arts, design, entertainment, sports, and media occupations (4.6%); material moving occupations (4.6%)
Most popular occupations of females: business and financial operations occupations (23.2%); service occupations (20.6%); sales and office occupations (20.1%); healthcare practitioners and technical occupations (13.6%); arts, design, entertainment, sports, and media occupations (7.9%); transportation occupations (6.7%); education, training, and library occupations (4.3%)
Roads and streets: Sloat Blvd; Eucalyptus Dr; Ocean Ave; 22nd Ave; 21st Ave; 20th Ave; 23rd Ave; 24th Ave; 26th Ave; 25th Ave; Melba Ave.
Merced Manor neighborhood detailed profile
Midtown Terrace neighborhood in San Francisco statistics: (Find on map)
Area: 0.404 square miles
Population: 3,673
Population density:
Median household income in 2021:
Median rent in in 2021:
Male vs Females
Median age
Average estimated value of detached houses in 2021 (77.4% of all units):
Most popular occupations of males: management occupations (except farmers) (18.0%); sales and office occupations (13.9%); computer and mathematical occupations (12.9%); legal occupations (10.0%); life, physical, and social science occupations (8.8%); community and social services occupations (6.0%); arts, design, entertainment, sports, and media occupations (5.3%)
Most popular occupations of females: healthcare practitioners and technical occupations (19.7%); sales and office occupations (17.5%); architecture and engineering occupations (14.6%); management occupations (except farmers) (13.6%); education, training, and library occupations (11.2%); computer and mathematical occupations (5.7%); legal occupations (5.6%)
Roads and streets: Panorama Dr; Dellbrook Ave; Skyview Way; Glenview Dr; Olympia Way; Starview Way; Twin Peaks Blvd; Marview Way; Knollview Way; Midcrest Way; Aquavista Way; Gladeview Way; Cityview Way; Dawnview Way; Farview Ct; Longview Ct; Clairview Ct; Fredela Ln; Mountview Ct; Greenview Ct; Portola Dr; Lori Ln.
Midtown Terrace neighborhood detailed profile
Area: 0.404 square miles
Population: 3,673
Population density:
| Midtown Terrace: | 9,088 people per square mile |
| San Francisco: | 17,458 people per square mile |
Median household income in 2021:
| Midtown Terrace: | $197,435 |
| San Francisco: | $121,826 |
Median rent in in 2021:
| Midtown Terrace: | $1,999 |
| San Francisco: | $2,001 |
Male vs Females
| Males: | 1,816 |
| Females: | 1,856 |
Median age
| Males: | 53.9 years |
| Females: | 59.3 years |
Average estimated value of detached houses in 2021 (77.4% of all units):
| Midtown Terrace: | $976,581 |
| San Francisco: | $1,815,784 |
Most popular occupations of males: management occupations (except farmers) (18.0%); sales and office occupations (13.9%); computer and mathematical occupations (12.9%); legal occupations (10.0%); life, physical, and social science occupations (8.8%); community and social services occupations (6.0%); arts, design, entertainment, sports, and media occupations (5.3%)
Most popular occupations of females: healthcare practitioners and technical occupations (19.7%); sales and office occupations (17.5%); architecture and engineering occupations (14.6%); management occupations (except farmers) (13.6%); education, training, and library occupations (11.2%); computer and mathematical occupations (5.7%); legal occupations (5.6%)
Roads and streets: Panorama Dr; Dellbrook Ave; Skyview Way; Glenview Dr; Olympia Way; Starview Way; Twin Peaks Blvd; Marview Way; Knollview Way; Midcrest Way; Aquavista Way; Gladeview Way; Cityview Way; Dawnview Way; Farview Ct; Longview Ct; Clairview Ct; Fredela Ln; Mountview Ct; Greenview Ct; Portola Dr; Lori Ln.
Midtown Terrace neighborhood detailed profile
Mint Hill neighborhood in San Francisco statistics: (Find on map)
Area: 0.064 square miles
Population: 2,929
Population density:
Median household income in 2021:
Median rent in in 2021:
Male vs Females
Median age
Most popular occupations of males: management occupations (except farmers) (18.8%); computer and mathematical occupations (18.6%); business and financial operations occupations (16.5%); education, training, and library occupations (14.9%); arts, design, entertainment, sports, and media occupations (9.4%); service occupations (7.4%); sales and office occupations (4.4%)
Most popular occupations of females: sales and office occupations (24.2%); education, training, and library occupations (19.5%); arts, design, entertainment, sports, and media occupations (8.9%); service occupations (8.6%); business and financial operations occupations (8.2%); management occupations (except farmers) (7.3%); life, physical, and social science occupations (6.4%)
Roads and streets: Hickory St; Rose St; Page St; Lily St; Oak St; Fell St; Octavia St; Laguna St; Gough St; Linden St.
Mint Hill neighborhood detailed profile
Area: 0.064 square miles
Population: 2,929
Population density:
| Mint Hill: | 45,874 people per square mile |
| San Francisco: | 17,458 people per square mile |
Median household income in 2021:
| Mint Hill: | $154,904 |
| San Francisco: | $121,826 |
Median rent in in 2021:
| Mint Hill: | $2,490 |
| San Francisco: | $2,001 |
Male vs Females
| Males: | 1,574 |
| Females: | 1,355 |
Median age
| Males: | 39.5 years |
| Females: | 36.5 years |
Most popular occupations of males: management occupations (except farmers) (18.8%); computer and mathematical occupations (18.6%); business and financial operations occupations (16.5%); education, training, and library occupations (14.9%); arts, design, entertainment, sports, and media occupations (9.4%); service occupations (7.4%); sales and office occupations (4.4%)
Most popular occupations of females: sales and office occupations (24.2%); education, training, and library occupations (19.5%); arts, design, entertainment, sports, and media occupations (8.9%); service occupations (8.6%); business and financial operations occupations (8.2%); management occupations (except farmers) (7.3%); life, physical, and social science occupations (6.4%)
Roads and streets: Hickory St; Rose St; Page St; Lily St; Oak St; Fell St; Octavia St; Laguna St; Gough St; Linden St.
Mint Hill neighborhood detailed profile
Miraloma Park neighborhood in San Francisco statistics: (Find on map)
Area: 0.362 square miles
Population: 4,515
Population density:
Median household income in 2021:
Median rent in in 2021:
Male vs Females
Median age
Housing prices:
Average estimated value of detached houses in 2021 (56.8% of all units):
Average estimated value of townhouses or other attached units in 2021 (39.8% of all units):
Most popular occupations of males: management occupations (except farmers) (24.3%); computer and mathematical occupations (14.7%); sales and office occupations (11.3%); architecture and engineering occupations (9.4%); healthcare practitioners and technical occupations (8.3%); business and financial operations occupations (8.1%); education, training, and library occupations (5.9%)
Most popular occupations of females: sales and office occupations (21.0%); service occupations (16.1%); healthcare practitioners and technical occupations (14.6%); management occupations (except farmers) (10.5%); business and financial operations occupations (10.1%); education, training, and library occupations (9.9%); arts, design, entertainment, sports, and media occupations (4.7%)
Roads and streets: Marietta Dr; Teresita Blvd; Portola Dr; Juanita Way; Molimo Dr; Evelyn Way; Bella Vista Way; Los Palmos Dr; Melrose Ave; Rockdale Dr; Foerster St; Malta Dr; Myra Way; Stillings Ave; Agua Way; el Sereno Ct; Sequoia Way; Reposa Way; Arroyo Way; Chaves Ave; Dorcas Way; Fowler Ave; Valletta Ct; Marne Ave; Verna St; Encline Ct; del Sur Ave; Foerster; Gaviota Way; Omar Way; Gatun Aly; la Bica Way; Vista Verde Ct; Stanford Heights Ave; 31st St; Rio Ct; Avoca Aly; Isola Way; Detroit St; Rex Ave; del Vale Ave; Mercato Ct.
Miraloma Park neighborhood detailed profile
Area: 0.362 square miles
Population: 4,515
Population density:
| Miraloma Park: | 12,479 people per square mile |
| San Francisco: | 17,458 people per square mile |
Median household income in 2021:
| Miraloma Park: | $185,526 |
| San Francisco: | $121,826 |
Median rent in in 2021:
| Miraloma Park: | $3,382 |
| San Francisco: | $2,001 |
Male vs Females
| Males: | 2,342 |
| Females: | 2,172 |
Median age
| Males: | 44.0 years |
| Females: | 44.6 years |
Housing prices:
Average estimated value of detached houses in 2021 (56.8% of all units):
| Miraloma Park: | $1,382,383 |
| San Francisco: | $1,815,784 |
Average estimated value of townhouses or other attached units in 2021 (39.8% of all units):
| This neighborhood: | $1,307,198 |
| city: | $1,506,493 |
Most popular occupations of males: management occupations (except farmers) (24.3%); computer and mathematical occupations (14.7%); sales and office occupations (11.3%); architecture and engineering occupations (9.4%); healthcare practitioners and technical occupations (8.3%); business and financial operations occupations (8.1%); education, training, and library occupations (5.9%)
Most popular occupations of females: sales and office occupations (21.0%); service occupations (16.1%); healthcare practitioners and technical occupations (14.6%); management occupations (except farmers) (10.5%); business and financial operations occupations (10.1%); education, training, and library occupations (9.9%); arts, design, entertainment, sports, and media occupations (4.7%)
Roads and streets: Marietta Dr; Teresita Blvd; Portola Dr; Juanita Way; Molimo Dr; Evelyn Way; Bella Vista Way; Los Palmos Dr; Melrose Ave; Rockdale Dr; Foerster St; Malta Dr; Myra Way; Stillings Ave; Agua Way; el Sereno Ct; Sequoia Way; Reposa Way; Arroyo Way; Chaves Ave; Dorcas Way; Fowler Ave; Valletta Ct; Marne Ave; Verna St; Encline Ct; del Sur Ave; Foerster; Gaviota Way; Omar Way; Gatun Aly; la Bica Way; Vista Verde Ct; Stanford Heights Ave; 31st St; Rio Ct; Avoca Aly; Isola Way; Detroit St; Rex Ave; del Vale Ave; Mercato Ct.
Miraloma Park neighborhood detailed profile
Mission Bay neighborhood in San Francisco statistics: (Find on map)
Area: 0.842 square miles
Population: 4,869
Population density:
Median household income in 2021:
Median rent in in 2021:
Male vs Females
Median age
Average estimated '21 value of housing units in 5-or-more-unit structures (52.6% of all units):
Most popular occupations of males: computer and mathematical occupations (29.0%); management occupations (except farmers) (20.9%); sales and office occupations (13.9%); business and financial operations occupations (8.8%); transportation occupations (6.3%); service occupations (5.0%); architecture and engineering occupations (4.6%)
Most popular occupations of females: business and financial operations occupations (25.4%); management occupations (except farmers) (23.8%); computer and mathematical occupations (10.3%); architecture and engineering occupations (8.5%); life, physical, and social science occupations (7.8%); arts, design, entertainment, sports, and media occupations (4.8%); production occupations (4.5%)
Limited-access highways (interstate or state) in this neighborhood: I- 280; I- 80 (James Lick Fwy).
Roads and streets: 6th St; 16th St; Townsend St; Brannan St; 7th St; King St; Terry Francois St (Terry A Francois Blvd); Berry St; 4th St; 3rd St; Bryant St; Owens St; Channel St; 8th St; Bluxome St; Illinois St; 5th St; Alameda St; de Haro St; Carolina St; 15th St; Harriet St; Vermont St; Division St; Rhode Island St; Michigan St; Irwin St; Gilbert St; Hooper St; Jewett St; Hubbell St; Mission Rock St; Morris St; Ritch St; Boardman Pl; Henry Adams St; Langton St; Pier 48; Daggett St; Kansas St; Lusk St; Eldorado St; Kate St; Decatur St; Lucerne St; Oak Grove St; Clyde St; Butte Pl; Ahern Way; Wisconsin St; Merrimac St; Eldridge St; Merlin St; Chesley St.
Railroad features: Union Pacific RR.
Mission Bay neighborhood detailed profile
Area: 0.842 square miles
Population: 4,869
Population density:
| Mission Bay: | 5,785 people per square mile |
| San Francisco: | 17,458 people per square mile |
Median household income in 2021:
| Mission Bay: | $159,723 |
| San Francisco: | $121,826 |
Median rent in in 2021:
| Mission Bay: | $2,779 |
| San Francisco: | $2,001 |
Male vs Females
| Males: | 3,060 |
| Females: | 1,809 |
Median age
| Males: | 36.2 years |
| Females: | 30.2 years |
Average estimated '21 value of housing units in 5-or-more-unit structures (52.6% of all units):
| Mission Bay: | $969,756 |
| San Francisco: | $1,317,001 |
Most popular occupations of males: computer and mathematical occupations (29.0%); management occupations (except farmers) (20.9%); sales and office occupations (13.9%); business and financial operations occupations (8.8%); transportation occupations (6.3%); service occupations (5.0%); architecture and engineering occupations (4.6%)
Most popular occupations of females: business and financial operations occupations (25.4%); management occupations (except farmers) (23.8%); computer and mathematical occupations (10.3%); architecture and engineering occupations (8.5%); life, physical, and social science occupations (7.8%); arts, design, entertainment, sports, and media occupations (4.8%); production occupations (4.5%)
Limited-access highways (interstate or state) in this neighborhood: I- 280; I- 80 (James Lick Fwy).
Roads and streets: 6th St; 16th St; Townsend St; Brannan St; 7th St; King St; Terry Francois St (Terry A Francois Blvd); Berry St; 4th St; 3rd St; Bryant St; Owens St; Channel St; 8th St; Bluxome St; Illinois St; 5th St; Alameda St; de Haro St; Carolina St; 15th St; Harriet St; Vermont St; Division St; Rhode Island St; Michigan St; Irwin St; Gilbert St; Hooper St; Jewett St; Hubbell St; Mission Rock St; Morris St; Ritch St; Boardman Pl; Henry Adams St; Langton St; Pier 48; Daggett St; Kansas St; Lusk St; Eldorado St; Kate St; Decatur St; Lucerne St; Oak Grove St; Clyde St; Butte Pl; Ahern Way; Wisconsin St; Merrimac St; Eldridge St; Merlin St; Chesley St.
Railroad features: Union Pacific RR.
Mission Bay neighborhood detailed profile
Mission District neighborhood in San Francisco statistics: (Find on map)
Area: 1.481 square miles
Population: 37,621
Population density:
Median household income in 2021:
Median rent in in 2021:
Male vs Females
Median age
Housing prices:
Average estimated value of detached houses in 2021 (12.9% of all units):
Average estimated value of townhouses or other attached units in 2021 (10.5% of all units):
Average estimated value of housing units in 2-unit structures in 2021 (17.0% of all units):
Average estimated '21 value of housing units in 3-to-4-unit structures (23.5% of all units):
Average estimated '21 value of housing units in 5-or-more-unit structures (8.9% of all units):
Most popular occupations of males: computer and mathematical occupations (14.5%); management occupations (except farmers) (13.9%); service occupations (13.7%); sales and office occupations (10.9%); business and financial operations occupations (7.0%); construction, extraction, and maintenance occupations (6.9%); arts, design, entertainment, sports, and media occupations (6.4%)
Most popular occupations of females: sales and office occupations (20.1%); service occupations (18.3%); management occupations (except farmers) (11.7%); education, training, and library occupations (9.4%); arts, design, entertainment, sports, and media occupations (7.8%); computer and mathematical occupations (7.4%); business and financial operations occupations (7.3%)
Limited-access highways (interstate or state) in this neighborhood: US Hwy 101 (James Lick Fwy); I- 80 (James Lick Fwy).
Highways in this neighborhood: US Hwy 101 (Central Fwy); US Hwy 101.
Roads and streets: Potrero Ave; Valencia St; S Van Ness Ave; Folsom St; Harrison St; Bryant St; Mission St; Florida St; Shotwell St; Capp St; Alabama St; Treat Ave; 24th St; Cesar Chavez St; 25th St; 23rd St; Hampshire St; 22nd St; Cesar Chavez (Cesar Chavez St); York St; 17th St; 16th St; 20th St; 18th St; 19th St; 26th St; 21st St; 15th St; San Bruno Ave; Utah St; Bartlett St; 14th St; San Jose Ave; Mariposa St; Vermont St; Alameda St; Lexington St; San Carlos St; Erie St; Osage St; Poplar St; Orange Aly; Julian Ave; Tiffany Ave; Lucky St; Cypress St; Lilac St; Caledonia St; Division St; Clarion Aly; Sycamore St; Woodward St; Wiese St; Hoff St; Balmy St; Minna St; Natoma St; Horace St; Virgil St; Stevenson St; Duboce Ave; Duncan St; Rondel Pl; Adair St; Mistral St; Trainor St; Clinton Park; Juri St; Enterprise St; Sparrow St; Humboldt St.
Mission District neighborhood detailed profile
Area: 1.481 square miles
Population: 37,621
Population density:
| Mission District (The Mission): | 25,400 people per square mile |
| San Francisco: | 17,458 people per square mile |
Median household income in 2021:
| Mission District (The Mission): | $135,929 |
| San Francisco: | $121,826 |
Median rent in in 2021:
| Mission District (The Mission): | $2,166 |
| San Francisco: | $2,001 |
Male vs Females
| Males: | 19,604 |
| Females: | 18,016 |
Median age
| Males: | 37.7 years |
| Females: | 36.9 years |
Housing prices:
Average estimated value of detached houses in 2021 (12.9% of all units):
| Mission District (The Mission): | $1,168,734 |
| San Francisco: | $1,815,784 |
Average estimated value of townhouses or other attached units in 2021 (10.5% of all units):
| This neighborhood: | $941,850 |
| city: | $1,506,493 |
Average estimated value of housing units in 2-unit structures in 2021 (17.0% of all units):
| This neighborhood: | $1,047,235 |
| San Francisco: | $1,685,431 |
Average estimated '21 value of housing units in 3-to-4-unit structures (23.5% of all units):
| Mission District (The Mission): | $1,309,193 |
| city: | $1,521,789 |
Average estimated '21 value of housing units in 5-or-more-unit structures (8.9% of all units):
| Mission District (The Mission): | $713,311 |
| San Francisco: | $1,317,001 |
Most popular occupations of males: computer and mathematical occupations (14.5%); management occupations (except farmers) (13.9%); service occupations (13.7%); sales and office occupations (10.9%); business and financial operations occupations (7.0%); construction, extraction, and maintenance occupations (6.9%); arts, design, entertainment, sports, and media occupations (6.4%)
Most popular occupations of females: sales and office occupations (20.1%); service occupations (18.3%); management occupations (except farmers) (11.7%); education, training, and library occupations (9.4%); arts, design, entertainment, sports, and media occupations (7.8%); computer and mathematical occupations (7.4%); business and financial operations occupations (7.3%)
Limited-access highways (interstate or state) in this neighborhood: US Hwy 101 (James Lick Fwy); I- 80 (James Lick Fwy).
Highways in this neighborhood: US Hwy 101 (Central Fwy); US Hwy 101.
Roads and streets: Potrero Ave; Valencia St; S Van Ness Ave; Folsom St; Harrison St; Bryant St; Mission St; Florida St; Shotwell St; Capp St; Alabama St; Treat Ave; 24th St; Cesar Chavez St; 25th St; 23rd St; Hampshire St; 22nd St; Cesar Chavez (Cesar Chavez St); York St; 17th St; 16th St; 20th St; 18th St; 19th St; 26th St; 21st St; 15th St; San Bruno Ave; Utah St; Bartlett St; 14th St; San Jose Ave; Mariposa St; Vermont St; Alameda St; Lexington St; San Carlos St; Erie St; Osage St; Poplar St; Orange Aly; Julian Ave; Tiffany Ave; Lucky St; Cypress St; Lilac St; Caledonia St; Division St; Clarion Aly; Sycamore St; Woodward St; Wiese St; Hoff St; Balmy St; Minna St; Natoma St; Horace St; Virgil St; Stevenson St; Duboce Ave; Duncan St; Rondel Pl; Adair St; Mistral St; Trainor St; Clinton Park; Juri St; Enterprise St; Sparrow St; Humboldt St.
Mission District neighborhood detailed profile
Mission Dolores neighborhood in San Francisco statistics: (Find on map)
Area: 0.279 square miles
Population: 9,846
Population density:
Median household income in 2021:
Median rent in in 2021:
Male vs Females
Median age
Housing prices:
Average estimated value of detached houses in 2021 (3.2% of all units):
Average estimated value of townhouses or other attached units in 2021 (2.2% of all units):
Average estimated value of housing units in 2-unit structures in 2021 (7.7% of all units):
Average estimated '21 value of housing units in 3-to-4-unit structures (28.3% of all units):
Average estimated '21 value of housing units in 5-or-more-unit structures (16.2% of all units):
Most popular occupations of males: management occupations (except farmers) (31.7%); computer and mathematical occupations (19.6%); business and financial operations occupations (8.9%); sales and office occupations (8.9%); arts, design, entertainment, sports, and media occupations (5.5%); service occupations (5.5%); architecture and engineering occupations (4.3%)
Most popular occupations of females: business and financial operations occupations (23.7%); sales and office occupations (21.4%); management occupations (except farmers) (15.4%); arts, design, entertainment, sports, and media occupations (12.8%); computer and mathematical occupations (5.8%); education, training, and library occupations (4.4%); life, physical, and social science occupations (4.2%)
Roads and streets: Guerrero St; Dolores St; 16th St; 15th St; 17th St; 18th St; 19th St; 14th St; Landers St; Albion St; Linda St; Dorland St; Cumberland St; Elgin Park; Dearborn St; Ramona Ave (Ramona St); Lapidge St; Oakwood St; Duboce Ave; Dolores Ter; Alert Aly; Camp St; Clinton Park; Chula Ln; Hidalgo Ter; Pearl St; Rosemont Pl; Abbey St; Gaiser Ct; Bird St; Spencer Aly (Spencer St); Pink Aly; McCoppin St.
Mission Dolores neighborhood detailed profile
Area: 0.279 square miles
Population: 9,846
Population density:
| Mission Dolores: | 35,249 people per square mile |
| San Francisco: | 17,458 people per square mile |
Median household income in 2021:
| Mission Dolores: | $187,330 |
| San Francisco: | $121,826 |
Median rent in in 2021:
| Mission Dolores: | $2,266 |
| San Francisco: | $2,001 |
Male vs Females
| Males: | 5,952 |
| Females: | 3,894 |
Median age
| Males: | 42.6 years |
| Females: | 44.0 years |
Housing prices:
Average estimated value of detached houses in 2021 (3.2% of all units):
| Mission Dolores: | $898,966 |
| San Francisco: | $1,815,784 |
Average estimated value of townhouses or other attached units in 2021 (2.2% of all units):
| This neighborhood: | $1,251,020 |
| city: | $1,506,493 |
Average estimated value of housing units in 2-unit structures in 2021 (7.7% of all units):
| This neighborhood: | $883,333 |
| San Francisco: | $1,685,431 |
Average estimated '21 value of housing units in 3-to-4-unit structures (28.3% of all units):
| Mission Dolores: | $584,314 |
| city: | $1,521,789 |
Average estimated '21 value of housing units in 5-or-more-unit structures (16.2% of all units):
| Mission Dolores: | $1,200,538 |
| San Francisco: | $1,317,001 |
Most popular occupations of males: management occupations (except farmers) (31.7%); computer and mathematical occupations (19.6%); business and financial operations occupations (8.9%); sales and office occupations (8.9%); arts, design, entertainment, sports, and media occupations (5.5%); service occupations (5.5%); architecture and engineering occupations (4.3%)
Most popular occupations of females: business and financial operations occupations (23.7%); sales and office occupations (21.4%); management occupations (except farmers) (15.4%); arts, design, entertainment, sports, and media occupations (12.8%); computer and mathematical occupations (5.8%); education, training, and library occupations (4.4%); life, physical, and social science occupations (4.2%)
Roads and streets: Guerrero St; Dolores St; 16th St; 15th St; 17th St; 18th St; 19th St; 14th St; Landers St; Albion St; Linda St; Dorland St; Cumberland St; Elgin Park; Dearborn St; Ramona Ave (Ramona St); Lapidge St; Oakwood St; Duboce Ave; Dolores Ter; Alert Aly; Camp St; Clinton Park; Chula Ln; Hidalgo Ter; Pearl St; Rosemont Pl; Abbey St; Gaiser Ct; Bird St; Spencer Aly (Spencer St); Pink Aly; McCoppin St.
Mission Dolores neighborhood detailed profile
Mission Terrace neighborhood in San Francisco statistics: (Find on map)
Area: 0.455 square miles
Population: 9,737
Population density:
Median household income in 2021:
Median rent in in 2021:
Male vs Females
Median age
Housing prices:
Average estimated value of detached houses in 2021 (42.7% of all units):
Average estimated value of townhouses or other attached units in 2021 (34.3% of all units):
Most popular occupations of males: sales and office occupations (17.6%); service occupations (16.8%); production occupations (11.4%); computer and mathematical occupations (10.5%); management occupations (except farmers) (9.0%); education, training, and library occupations (6.9%); construction, extraction, and maintenance occupations (5.5%)
Most popular occupations of females: sales and office occupations (32.8%); service occupations (28.8%); management occupations (except farmers) (12.0%); business and financial operations occupations (8.7%); community and social services occupations (5.6%); healthcare practitioners and technical occupations (5.4%); education, training, and library occupations (3.4%)
Limited-access highways (interstate or state) in this neighborhood: I- 280.
Roads and streets: Alemany Blvd; Cayuga Ave; San Jose Ave; Ocean Ave; Geneva Ave; Delano Ave; Capistrano Ave; Otsego Ave; Seneca Ave; Santa Rosa Ave; Still St; San Juan Ave; Santa Ynez Ave; Onondaga Ave; Oneida Ave; Cotter St; San Gabriel Ave; Theresa St; Navajo Ave; Santa Ysabel Ave; Tingley St; Havelock St; Camellia Ave; Meda Ave; Junior Ter; Rudden Ave; Lyell St; Bertita St; Arco Way; Gorham St; Nantucket Ave; Wanda St; Bannock St; Lamartine St; Danton St; Rousseau St; Badger St; Silver Ave; Rotteck St; Colonial Way; Paulding St; Gloria Ct; Baywood Ct; Balhi Ct; Valerton Ct; Pilgram Ave; Raleigh Ave (Raleigh St); Sunbeam Ln; Rosella Ct; Baden Ave; Bosworth St; Ruth St; Milton St; Admiral Ave.
Mission Terrace neighborhood detailed profile
Area: 0.455 square miles
Population: 9,737
Population density:
| Mission Terrace: | 21,379 people per square mile |
| San Francisco: | 17,458 people per square mile |
Median household income in 2021:
| Mission Terrace: | $98,152 |
| San Francisco: | $121,826 |
Median rent in in 2021:
| Mission Terrace: | $1,814 |
| San Francisco: | $2,001 |
Male vs Females
| Males: | 5,232 |
| Females: | 4,505 |
Median age
| Males: | 40.3 years |
| Females: | 49.2 years |
Housing prices:
Average estimated value of detached houses in 2021 (42.7% of all units):
| Mission Terrace: | $951,129 |
| San Francisco: | $1,815,784 |
Average estimated value of townhouses or other attached units in 2021 (34.3% of all units):
| This neighborhood: | $1,144,898 |
| city: | $1,506,493 |
Most popular occupations of males: sales and office occupations (17.6%); service occupations (16.8%); production occupations (11.4%); computer and mathematical occupations (10.5%); management occupations (except farmers) (9.0%); education, training, and library occupations (6.9%); construction, extraction, and maintenance occupations (5.5%)
Most popular occupations of females: sales and office occupations (32.8%); service occupations (28.8%); management occupations (except farmers) (12.0%); business and financial operations occupations (8.7%); community and social services occupations (5.6%); healthcare practitioners and technical occupations (5.4%); education, training, and library occupations (3.4%)
Limited-access highways (interstate or state) in this neighborhood: I- 280.
Roads and streets: Alemany Blvd; Cayuga Ave; San Jose Ave; Ocean Ave; Geneva Ave; Delano Ave; Capistrano Ave; Otsego Ave; Seneca Ave; Santa Rosa Ave; Still St; San Juan Ave; Santa Ynez Ave; Onondaga Ave; Oneida Ave; Cotter St; San Gabriel Ave; Theresa St; Navajo Ave; Santa Ysabel Ave; Tingley St; Havelock St; Camellia Ave; Meda Ave; Junior Ter; Rudden Ave; Lyell St; Bertita St; Arco Way; Gorham St; Nantucket Ave; Wanda St; Bannock St; Lamartine St; Danton St; Rousseau St; Badger St; Silver Ave; Rotteck St; Colonial Way; Paulding St; Gloria Ct; Baywood Ct; Balhi Ct; Valerton Ct; Pilgram Ave; Raleigh Ave (Raleigh St); Sunbeam Ln; Rosella Ct; Baden Ave; Bosworth St; Ruth St; Milton St; Admiral Ave.
Mission Terrace neighborhood detailed profile
Monterey Heights neighborhood in San Francisco statistics: (Find on map)
Area: 0.112 square miles
Population: 988
Population density:
Median household income in 2021:
Median rent in in 2021:
Male vs Females
Median age
Average estimated value of detached houses in 2021 (98.2% of all units):
Most popular occupations of males: management occupations (except farmers) (42.1%); sales and office occupations (14.2%); transportation occupations (11.2%); education, training, and library occupations (10.6%); architecture and engineering occupations (7.7%); service occupations (4.6%); computer and mathematical occupations (3.9%)
Most popular occupations of females: sales and office occupations (29.2%); business and financial operations occupations (19.8%); management occupations (except farmers) (14.6%); service occupations (14.3%); healthcare practitioners and technical occupations (6.7%); legal occupations (4.1%); community and social services occupations (4.0%)
Roads and streets: Monterey Blvd; Maywood Dr; Yerba Buena Ave; San Felipe Ave; San Jacinto Way; Fernwood Dr; el Verano Way; Brentwood Ave; St Elmo Way; Rosewood Dr; Ravenwood Dr; Miraloma Dr.
Monterey Heights neighborhood detailed profile
Area: 0.112 square miles
Population: 988
Population density:
| Monterey Heights: | 8,785 people per square mile |
| San Francisco: | 17,458 people per square mile |
Median household income in 2021:
| Monterey Heights: | $187,702 |
| San Francisco: | $121,826 |
Median rent in in 2021:
| Monterey Heights: | $2,618 |
| San Francisco: | $2,001 |
Male vs Females
| Males: | 416 |
| Females: | 571 |
Median age
| Males: | 45.1 years |
| Females: | 44.8 years |
Average estimated value of detached houses in 2021 (98.2% of all units):
| Monterey Heights: | $2,022,950 |
| San Francisco: | $1,815,784 |
Most popular occupations of males: management occupations (except farmers) (42.1%); sales and office occupations (14.2%); transportation occupations (11.2%); education, training, and library occupations (10.6%); architecture and engineering occupations (7.7%); service occupations (4.6%); computer and mathematical occupations (3.9%)
Most popular occupations of females: sales and office occupations (29.2%); business and financial operations occupations (19.8%); management occupations (except farmers) (14.6%); service occupations (14.3%); healthcare practitioners and technical occupations (6.7%); legal occupations (4.1%); community and social services occupations (4.0%)
Roads and streets: Monterey Blvd; Maywood Dr; Yerba Buena Ave; San Felipe Ave; San Jacinto Way; Fernwood Dr; el Verano Way; Brentwood Ave; St Elmo Way; Rosewood Dr; Ravenwood Dr; Miraloma Dr.
Monterey Heights neighborhood detailed profile
Mount Davidson Manor neighborhood in San Francisco statistics: (Find on map)
Area: 0.123 square miles
Population: 2,129
Population density:
Median household income in 2021:
Median rent in in 2021:
Male vs Females
Median age
Average estimated value of detached houses in 2021 (77.8% of all units):
Most popular occupations of males: management occupations (except farmers) (22.5%); business and financial operations occupations (19.2%); community and social services occupations (15.7%); legal occupations (8.3%); sales and office occupations (7.9%); life, physical, and social science occupations (4.0%); computer and mathematical occupations (3.6%)
Most popular occupations of females: sales and office occupations (28.9%); business and financial operations occupations (20.7%); management occupations (except farmers) (15.1%); healthcare practitioners and technical occupations (8.7%); service occupations (7.5%); computer and mathematical occupations (6.9%); legal occupations (4.4%)
Roads and streets: Ocean Ave; Kenwood Way; Dorado Ter; Manor Dr; Darien Way; Upland Dr; Pinehurst Way; Fairfield Way; Keystone Way; Faxon Ave; Wildwood Way; Lakewood Ave; Westgate Dr; Northgate Dr; Homewood Ct.
Mount Davidson Manor neighborhood detailed profile
Area: 0.123 square miles
Population: 2,129
Population density:
| Mount Davidson Manor: | 17,255 people per square mile |
| San Francisco: | 17,458 people per square mile |
Median household income in 2021:
| Mount Davidson Manor: | $174,501 |
| San Francisco: | $121,826 |
Median rent in in 2021:
| Mount Davidson Manor: | $2,225 |
| San Francisco: | $2,001 |
Male vs Females
| Males: | 941 |
| Females: | 1,188 |
Median age
| Males: | 46.2 years |
| Females: | 46.4 years |
Average estimated value of detached houses in 2021 (77.8% of all units):
| Mount Davidson Manor: | $1,435,875 |
| San Francisco: | $1,815,784 |
Most popular occupations of males: management occupations (except farmers) (22.5%); business and financial operations occupations (19.2%); community and social services occupations (15.7%); legal occupations (8.3%); sales and office occupations (7.9%); life, physical, and social science occupations (4.0%); computer and mathematical occupations (3.6%)
Most popular occupations of females: sales and office occupations (28.9%); business and financial operations occupations (20.7%); management occupations (except farmers) (15.1%); healthcare practitioners and technical occupations (8.7%); service occupations (7.5%); computer and mathematical occupations (6.9%); legal occupations (4.4%)
Roads and streets: Ocean Ave; Kenwood Way; Dorado Ter; Manor Dr; Darien Way; Upland Dr; Pinehurst Way; Fairfield Way; Keystone Way; Faxon Ave; Wildwood Way; Lakewood Ave; Westgate Dr; Northgate Dr; Homewood Ct.
Mount Davidson Manor neighborhood detailed profile
NOMA neighborhood in San Francisco statistics: (Find on map)
Area: 1.567 square miles
Population: 35,753
Population density:
Median household income in 2021:
Median rent in in 2021:
Male vs Females
Median age
Average estimated '21 value of housing units in 5-or-more-unit structures (38.8% of all units):
Most popular occupations of males: management occupations (except farmers) (17.4%); computer and mathematical occupations (17.4%); business and financial operations occupations (16.5%); sales and office occupations (12.7%); service occupations (11.4%); arts, design, entertainment, sports, and media occupations (4.6%); education, training, and library occupations (3.5%)
Most popular occupations of females: sales and office occupations (21.5%); management occupations (except farmers) (20.7%); service occupations (14.2%); business and financial operations occupations (11.6%); arts, design, entertainment, sports, and media occupations (7.2%); computer and mathematical occupations (5.7%); education, training, and library occupations (5.2%)
Highways in this neighborhood: US Hwy 101 (Van Ness Ave).
Roads and streets: Market St; Sacramento St; California St; Pine St; Clay St; Bush St; Sutter St; Post St; Gough St; Ellis St; Ofarrell St; Franklin St; Geary St; Larkin St; Eddy St; Turk Blvd (Turk St); Washington St; Golden Gate Ave; Polk St; Hyde St; Leavenworth St; Jones St; McAllister St; Taylor St; Stockton St; Mason St; Powell St; Grant Ave; Grove St; Kearny St; Austin St; Octavia St; Hayes St; Montgomery St; Geary Blvd; Fulton St; Willow St; Fern St; Commercial St; Sansome St; Fell St; Battery St; Alice B Toklas Pl (Myrtle St); Olive St; Hemlock St; Hinckley Walk (Hinckle Walk, Washington St); Davis St; Stevenson St; Front St; Merchant St; Ivy St; Hickory St; Oak St; Cedar St; Elm St; Halleck St; Drumm St; Maiden Ln; Leidesdorff St; Redwood St; Joice St; Cyril Magnin St; Page St; Starr King Way; Shannon St; Peter Yorke Way; Dr Carlton P Goodlett Pl; Waverly Pl; Cosmo Pl; Linden St; Lily St; Pleasant St; Larch St; Campton Pl; Ash St; Quincy St; Harlan Pl; Wetmore St; Rose St; Derby St; Antonio St; Troy Aly; Leroy Pl; Lick Pl; Belden Pl; Petrarch Pl; St George Aly; Claude Ln; Dashiell Hammett St (Monore); Trinity Pl (Trinity St); Spring St; Cushman St; Hangah St; Codman Pl; Kimball Pl; Spofford St; Sproule Ln; Walter U Lum Pl; Priest St; Reed St; Hallidie Plz; Elwood St; 7th St; 2nd St; New Montgomery St; 1st St; Nob Hill Cir; Torrens Ct; Hardie Pl; Ewer Pl; Malvina Pl; Truett St; Isadora Duncan Ln; Steveloe Pl; Fella Pl; Anson Pl; Collier St; Vinton Ct; Sabin Pl; Helen Pl (Helen St); Shephard Pl; Savings Union Pl; Emma St; Acorn Aly; Ada Ct; Burritt St; Tillman Pl; Breen Pl; Dale Pl; Mark Ln; Robert Kirk Ln; Treasury Pl; Dodge Pl (Dodge St); Mills Pl; Century Pl; Vine Ter; Cohen Pl; Meacham Pl; Chatham Pl; Vermehr Pl; Nob Hill Pl; Miller Pl; Golden Ct; Parkhurst Aly; Pratt Pl; Miles Ct; Hobart Aly; Dawson Pl; Colin Pl; Opal Pl; Chelsea Pl; Cable Car Turnaround; Exchange St; Brooklyn Pl; Touchard St; Haight St; Trader Vic Aly; Ophir Aly; 4th St.
NOMA neighborhood detailed profile
Area: 1.567 square miles
Population: 35,753
Population density:
| NOMA (NoMa): | 22,815 people per square mile |
| San Francisco: | 17,458 people per square mile |
Median household income in 2021:
| NOMA (NoMa): | $107,420 |
| San Francisco: | $121,826 |
Median rent in in 2021:
| NOMA (NoMa): | $1,803 |
| San Francisco: | $2,001 |
Male vs Females
| Males: | 18,779 |
| Females: | 16,973 |
Median age
| Males: | 44.4 years |
| Females: | 44.3 years |
Average estimated '21 value of housing units in 5-or-more-unit structures (38.8% of all units):
| NOMA (NoMa): | $1,094,033 |
| San Francisco: | $1,317,001 |
Most popular occupations of males: management occupations (except farmers) (17.4%); computer and mathematical occupations (17.4%); business and financial operations occupations (16.5%); sales and office occupations (12.7%); service occupations (11.4%); arts, design, entertainment, sports, and media occupations (4.6%); education, training, and library occupations (3.5%)
Most popular occupations of females: sales and office occupations (21.5%); management occupations (except farmers) (20.7%); service occupations (14.2%); business and financial operations occupations (11.6%); arts, design, entertainment, sports, and media occupations (7.2%); computer and mathematical occupations (5.7%); education, training, and library occupations (5.2%)
Highways in this neighborhood: US Hwy 101 (Van Ness Ave).
Roads and streets: Market St; Sacramento St; California St; Pine St; Clay St; Bush St; Sutter St; Post St; Gough St; Ellis St; Ofarrell St; Franklin St; Geary St; Larkin St; Eddy St; Turk Blvd (Turk St); Washington St; Golden Gate Ave; Polk St; Hyde St; Leavenworth St; Jones St; McAllister St; Taylor St; Stockton St; Mason St; Powell St; Grant Ave; Grove St; Kearny St; Austin St; Octavia St; Hayes St; Montgomery St; Geary Blvd; Fulton St; Willow St; Fern St; Commercial St; Sansome St; Fell St; Battery St; Alice B Toklas Pl (Myrtle St); Olive St; Hemlock St; Hinckley Walk (Hinckle Walk, Washington St); Davis St; Stevenson St; Front St; Merchant St; Ivy St; Hickory St; Oak St; Cedar St; Elm St; Halleck St; Drumm St; Maiden Ln; Leidesdorff St; Redwood St; Joice St; Cyril Magnin St; Page St; Starr King Way; Shannon St; Peter Yorke Way; Dr Carlton P Goodlett Pl; Waverly Pl; Cosmo Pl; Linden St; Lily St; Pleasant St; Larch St; Campton Pl; Ash St; Quincy St; Harlan Pl; Wetmore St; Rose St; Derby St; Antonio St; Troy Aly; Leroy Pl; Lick Pl; Belden Pl; Petrarch Pl; St George Aly; Claude Ln; Dashiell Hammett St (Monore); Trinity Pl (Trinity St); Spring St; Cushman St; Hangah St; Codman Pl; Kimball Pl; Spofford St; Sproule Ln; Walter U Lum Pl; Priest St; Reed St; Hallidie Plz; Elwood St; 7th St; 2nd St; New Montgomery St; 1st St; Nob Hill Cir; Torrens Ct; Hardie Pl; Ewer Pl; Malvina Pl; Truett St; Isadora Duncan Ln; Steveloe Pl; Fella Pl; Anson Pl; Collier St; Vinton Ct; Sabin Pl; Helen Pl (Helen St); Shephard Pl; Savings Union Pl; Emma St; Acorn Aly; Ada Ct; Burritt St; Tillman Pl; Breen Pl; Dale Pl; Mark Ln; Robert Kirk Ln; Treasury Pl; Dodge Pl (Dodge St); Mills Pl; Century Pl; Vine Ter; Cohen Pl; Meacham Pl; Chatham Pl; Vermehr Pl; Nob Hill Pl; Miller Pl; Golden Ct; Parkhurst Aly; Pratt Pl; Miles Ct; Hobart Aly; Dawson Pl; Colin Pl; Opal Pl; Chelsea Pl; Cable Car Turnaround; Exchange St; Brooklyn Pl; Touchard St; Haight St; Trader Vic Aly; Ophir Aly; 4th St.
NOMA neighborhood detailed profile
Nob Hill neighborhood in San Francisco statistics: (Find on map)
Area: 0.313 square miles
Population: 16,394
Population density:
Median household income in 2021:
Median rent in in 2021:
Male vs Females
Median age
Housing prices:
Average estimated '21 value of housing units in 3-to-4-unit structures (12.5% of all units):
Average estimated '21 value of housing units in 5-or-more-unit structures (17.6% of all units):
Most popular occupations of males: business and financial operations occupations (18.0%); sales and office occupations (16.8%); management occupations (except farmers) (16.1%); service occupations (12.3%); computer and mathematical occupations (9.8%); healthcare practitioners and technical occupations (5.0%); architecture and engineering occupations (3.4%)
Most popular occupations of females: management occupations (except farmers) (29.7%); sales and office occupations (25.3%); service occupations (14.8%); arts, design, entertainment, sports, and media occupations (7.2%); business and financial operations occupations (6.4%); computer and mathematical occupations (3.6%); education, training, and library occupations (3.4%)
Roads and streets: Broadway St (Broadway); Pacific Ave; Jackson St; California St; Washington St; Clay St; Sacramento St; Robert C Levy Tunl; Taylor St; Leavenworth St; Jones St; Powell St; Polk St; Hyde St; Larkin St; Mason St; Bernard St; Broadway; Joice St; Trenton St; Salmon St; Pleasant St; John St; Lynch St; Wetmore St; Troy Aly; Himmelmann Pl; Leroy Pl; Cushman St; Auburn St; Codman Pl; Kimball Pl; Sproule Ln; Stone St; Priest St; Reed St; Cordelia St; Morrell St; Wayne Pl; Torrens Ct; Ewer Pl; Malvina Pl; Truett St; Collier St; Turk Murphy Ln; Cyrus Pl; Shephard Pl; Acorn Aly; Fisher Aly; McCormick St; Wall Pl; Burgoyne St; Miller Pl; Bedford Pl; Golden Ct; Parkhurst Aly; James Pl; Adele Ct; Miles Ct; Pratt Pl; Dawson Pl; Doric Aly; Phoenix Ter; Keyes Aly; Marcy Pl; Freeman Ct.
Nob Hill neighborhood detailed profile
Area: 0.313 square miles
Population: 16,394
Population density:
| Nob Hill: | 52,338 people per square mile |
| San Francisco: | 17,458 people per square mile |
Median household income in 2021:
| Nob Hill: | $94,201 |
| San Francisco: | $121,826 |
Median rent in in 2021:
| Nob Hill: | $1,808 |
| San Francisco: | $2,001 |
Male vs Females
| Males: | 8,082 |
| Females: | 8,311 |
Median age
| Males: | 44.8 years |
| Females: | 47.3 years |
Housing prices:
Average estimated '21 value of housing units in 3-to-4-unit structures (12.5% of all units):
| Nob Hill: | $1,004,478 |
| city: | $1,521,789 |
Average estimated '21 value of housing units in 5-or-more-unit structures (17.6% of all units):
| Nob Hill: | $1,076,598 |
| San Francisco: | $1,317,001 |
Most popular occupations of males: business and financial operations occupations (18.0%); sales and office occupations (16.8%); management occupations (except farmers) (16.1%); service occupations (12.3%); computer and mathematical occupations (9.8%); healthcare practitioners and technical occupations (5.0%); architecture and engineering occupations (3.4%)
Most popular occupations of females: management occupations (except farmers) (29.7%); sales and office occupations (25.3%); service occupations (14.8%); arts, design, entertainment, sports, and media occupations (7.2%); business and financial operations occupations (6.4%); computer and mathematical occupations (3.6%); education, training, and library occupations (3.4%)
Roads and streets: Broadway St (Broadway); Pacific Ave; Jackson St; California St; Washington St; Clay St; Sacramento St; Robert C Levy Tunl; Taylor St; Leavenworth St; Jones St; Powell St; Polk St; Hyde St; Larkin St; Mason St; Bernard St; Broadway; Joice St; Trenton St; Salmon St; Pleasant St; John St; Lynch St; Wetmore St; Troy Aly; Himmelmann Pl; Leroy Pl; Cushman St; Auburn St; Codman Pl; Kimball Pl; Sproule Ln; Stone St; Priest St; Reed St; Cordelia St; Morrell St; Wayne Pl; Torrens Ct; Ewer Pl; Malvina Pl; Truett St; Collier St; Turk Murphy Ln; Cyrus Pl; Shephard Pl; Acorn Aly; Fisher Aly; McCormick St; Wall Pl; Burgoyne St; Miller Pl; Bedford Pl; Golden Ct; Parkhurst Aly; James Pl; Adele Ct; Miles Ct; Pratt Pl; Dawson Pl; Doric Aly; Phoenix Ter; Keyes Aly; Marcy Pl; Freeman Ct.
Nob Hill neighborhood detailed profile
Noe Valley neighborhood in San Francisco statistics: (Find on map)
Area: 0.911 square miles
Population: 21,859
Population density:
Median household income in 2021:
Median rent in in 2021:
Male vs Females
Median age
Housing prices:
Average estimated value of detached houses in 2021 (24.1% of all units):
Average estimated value of townhouses or other attached units in 2021 (12.0% of all units):
Average estimated value of housing units in 2-unit structures in 2021 (19.9% of all units):
Average estimated '21 value of housing units in 3-to-4-unit structures (20.9% of all units):
Average estimated '21 value of housing units in 5-or-more-unit structures (2.8% of all units):
Most popular occupations of males: management occupations (except farmers) (20.2%); computer and mathematical occupations (19.1%); business and financial operations occupations (11.9%); sales and office occupations (10.2%); arts, design, entertainment, sports, and media occupations (8.1%); architecture and engineering occupations (5.3%); service occupations (5.1%)
Most popular occupations of females: management occupations (except farmers) (21.9%); healthcare practitioners and technical occupations (13.3%); sales and office occupations (11.9%); business and financial operations occupations (10.1%); arts, design, entertainment, sports, and media occupations (7.9%); computer and mathematical occupations (7.5%); legal occupations (6.8%)
Roads and streets: Dolores St; 24th St; 25th St; Clipper St; Guerrero St; 27th St; Duncan St; 22nd St; 23rd St; Diamond Heights Blvd; 28th St; 26th St; Jersey St; Elizabeth St; Valley St; Diamond St; 29th St; Noe St; Church St; Sanchez St; Castro St; Day St; Cesar Chavez St (Army St); 30th St; Douglass St; Alvarado St; San Jose Ave; Fair Oaks St; Hoffman Ave; Vicksburg St; Cesar Chavez (Cesar Chavez St); Chattanooga St; Carnelian Way; Quane St; Grand View Ave; Comerford St; Homestead St; Nellie St; Fountain St; Blanche St; Ames St; Eureka St; Mersey St; Newburg St; Gold Mine Dr; Clipper Ter; Safira Ln; High St; Severn St; Beacon St; Zircon Pl; Kronquist Ct.
Noe Valley neighborhood detailed profile
Area: 0.911 square miles
Population: 21,859
Population density:
| Noe Valley: | 23,998 people per square mile |
| San Francisco: | 17,458 people per square mile |
Median household income in 2021:
| Noe Valley: | $179,971 |
| San Francisco: | $121,826 |
Median rent in in 2021:
| Noe Valley: | $2,605 |
| San Francisco: | $2,001 |
Male vs Females
| Males: | 11,527 |
| Females: | 10,331 |
Median age
| Males: | 40.5 years |
| Females: | 39.3 years |
Housing prices:
Average estimated value of detached houses in 2021 (24.1% of all units):
| Noe Valley: | $2,344,607 |
| San Francisco: | $1,815,784 |
Average estimated value of townhouses or other attached units in 2021 (12.0% of all units):
| This neighborhood: | $1,944,482 |
| city: | $1,506,493 |
Average estimated value of housing units in 2-unit structures in 2021 (19.9% of all units):
| This neighborhood: | $1,167,352 |
| San Francisco: | $1,685,431 |
Average estimated '21 value of housing units in 3-to-4-unit structures (20.9% of all units):
| Noe Valley: | $1,288,882 |
| city: | $1,521,789 |
Average estimated '21 value of housing units in 5-or-more-unit structures (2.8% of all units):
| Noe Valley: | $796,479 |
| San Francisco: | $1,317,001 |
Most popular occupations of males: management occupations (except farmers) (20.2%); computer and mathematical occupations (19.1%); business and financial operations occupations (11.9%); sales and office occupations (10.2%); arts, design, entertainment, sports, and media occupations (8.1%); architecture and engineering occupations (5.3%); service occupations (5.1%)
Most popular occupations of females: management occupations (except farmers) (21.9%); healthcare practitioners and technical occupations (13.3%); sales and office occupations (11.9%); business and financial operations occupations (10.1%); arts, design, entertainment, sports, and media occupations (7.9%); computer and mathematical occupations (7.5%); legal occupations (6.8%)
Roads and streets: Dolores St; 24th St; 25th St; Clipper St; Guerrero St; 27th St; Duncan St; 22nd St; 23rd St; Diamond Heights Blvd; 28th St; 26th St; Jersey St; Elizabeth St; Valley St; Diamond St; 29th St; Noe St; Church St; Sanchez St; Castro St; Day St; Cesar Chavez St (Army St); 30th St; Douglass St; Alvarado St; San Jose Ave; Fair Oaks St; Hoffman Ave; Vicksburg St; Cesar Chavez (Cesar Chavez St); Chattanooga St; Carnelian Way; Quane St; Grand View Ave; Comerford St; Homestead St; Nellie St; Fountain St; Blanche St; Ames St; Eureka St; Mersey St; Newburg St; Gold Mine Dr; Clipper Ter; Safira Ln; High St; Severn St; Beacon St; Zircon Pl; Kronquist Ct.
Noe Valley neighborhood detailed profile
North Beach neighborhood in San Francisco statistics: (Find on map)
Area: 0.492 square miles
Population: 18,353
Population density:
Median household income in 2021:
Median rent in in 2021:
Male vs Females
Median age
Housing prices:
Average estimated value of housing units in 2-unit structures in 2021 (8.5% of all units):
Average estimated '21 value of housing units in 3-to-4-unit structures (33.1% of all units):
Average estimated '21 value of housing units in 5-or-more-unit structures (12.9% of all units):
Most popular occupations of males: sales and office occupations (17.0%); computer and mathematical occupations (12.1%); service occupations (11.1%); business and financial operations occupations (10.1%); transportation occupations (10.1%); management occupations (except farmers) (9.3%); architecture and engineering occupations (6.0%)
Most popular occupations of females: sales and office occupations (22.4%); management occupations (except farmers) (20.8%); service occupations (18.0%); business and financial operations occupations (14.8%); arts, design, entertainment, sports, and media occupations (7.6%); legal occupations (4.8%); healthcare practitioners and technical occupations (3.4%)
Roads and streets: Columbus Ave; Montgomery St; Bay St; Kearny St; Chestnut St; Lombard St; Francisco St; Greenwich St; Grant Ave; Union St; Sansome St; Filbert St; Vallejo St; Green St; Stockton St; Powell St; Broadway St (Broadway); Jackson St; Pacific Ave; Mason St; Telegraph Hill Blvd; Washington St; Taylor St; Alta St; Pfeiffer St; Jasper Pl; Varennes St; Jones St; Vandewater St; Clay St; Gold St; Water St; Fresno St; The Embarcadero; Bartol St; Fielding St; Houston St; San Antonio Pl; Winthrop St; Romolo Pl; Turk Murphy Ln; Bellair Pl; Child St; Genoa Pl; Bannam Pl; Scotland St; Via Buffano; Jansen St; Sonoma St; Castle St; Osgood Pl; Midway St; Edgardo Pl; Hotaling Pl (Hotaling St); Edith St; Beckett St; Wentworth Pl (Wentworth St); Bret Harte Ter; Brant Aly; Ils Ln; Jack Kerouac Aly; la Ferrera Ter; Darrell Pl; Margrave Pl; Nottingham Pl; Kent St; Merchant St; Card Aly; Telegraph Pl; Montague Pl; Dunnes Aly; Nobles Aly; Whiting St; Gibb St; Rowland St; Via Ferlinghetti; Emery Ln; Kenneth Rexroth Pl (Tracy Pl); Kramer Pl; Venard Aly; Newell St; Hodges Aly; Pollard Pl; Prescott Ct; Cadell Pl; Tuscany Aly; Gerke Aly; Julius St; Napier Ln; Cooper Aly; Jason Ct; School Aly; Medau Pl; Duncombe Aly; Krausgrill Pl; Worden St; August Aly; Bob Kaufman Aly; Windsor Pl; Eaton Pl; Calhoun Ter; Kohler Pl; Pelton Pl; Pontiac St; Verdi Pl; Pardee Aly; Saroyan Pl; Reno Pl.
North Beach neighborhood detailed profile
Area: 0.492 square miles
Population: 18,353
Population density:
| North Beach (NoBe): | 37,319 people per square mile |
| San Francisco: | 17,458 people per square mile |
Median household income in 2021:
| North Beach (NoBe): | $118,562 |
| San Francisco: | $121,826 |
Median rent in in 2021:
| North Beach (NoBe): | $1,559 |
| San Francisco: | $2,001 |
Male vs Females
| Males: | 10,563 |
| Females: | 7,789 |
Median age
| Males: | 39.9 years |
| Females: | 47.7 years |
Housing prices:
Average estimated value of housing units in 2-unit structures in 2021 (8.5% of all units):
| This neighborhood: | $1,581,818 |
| San Francisco: | $1,685,431 |
Average estimated '21 value of housing units in 3-to-4-unit structures (33.1% of all units):
| North Beach (NoBe): | $1,613,953 |
| city: | $1,521,789 |
Average estimated '21 value of housing units in 5-or-more-unit structures (12.9% of all units):
| North Beach (NoBe): | $707,460 |
| San Francisco: | $1,317,001 |
Most popular occupations of males: sales and office occupations (17.0%); computer and mathematical occupations (12.1%); service occupations (11.1%); business and financial operations occupations (10.1%); transportation occupations (10.1%); management occupations (except farmers) (9.3%); architecture and engineering occupations (6.0%)
Most popular occupations of females: sales and office occupations (22.4%); management occupations (except farmers) (20.8%); service occupations (18.0%); business and financial operations occupations (14.8%); arts, design, entertainment, sports, and media occupations (7.6%); legal occupations (4.8%); healthcare practitioners and technical occupations (3.4%)
Roads and streets: Columbus Ave; Montgomery St; Bay St; Kearny St; Chestnut St; Lombard St; Francisco St; Greenwich St; Grant Ave; Union St; Sansome St; Filbert St; Vallejo St; Green St; Stockton St; Powell St; Broadway St (Broadway); Jackson St; Pacific Ave; Mason St; Telegraph Hill Blvd; Washington St; Taylor St; Alta St; Pfeiffer St; Jasper Pl; Varennes St; Jones St; Vandewater St; Clay St; Gold St; Water St; Fresno St; The Embarcadero; Bartol St; Fielding St; Houston St; San Antonio Pl; Winthrop St; Romolo Pl; Turk Murphy Ln; Bellair Pl; Child St; Genoa Pl; Bannam Pl; Scotland St; Via Buffano; Jansen St; Sonoma St; Castle St; Osgood Pl; Midway St; Edgardo Pl; Hotaling Pl (Hotaling St); Edith St; Beckett St; Wentworth Pl (Wentworth St); Bret Harte Ter; Brant Aly; Ils Ln; Jack Kerouac Aly; la Ferrera Ter; Darrell Pl; Margrave Pl; Nottingham Pl; Kent St; Merchant St; Card Aly; Telegraph Pl; Montague Pl; Dunnes Aly; Nobles Aly; Whiting St; Gibb St; Rowland St; Via Ferlinghetti; Emery Ln; Kenneth Rexroth Pl (Tracy Pl); Kramer Pl; Venard Aly; Newell St; Hodges Aly; Pollard Pl; Prescott Ct; Cadell Pl; Tuscany Aly; Gerke Aly; Julius St; Napier Ln; Cooper Aly; Jason Ct; School Aly; Medau Pl; Duncombe Aly; Krausgrill Pl; Worden St; August Aly; Bob Kaufman Aly; Windsor Pl; Eaton Pl; Calhoun Ter; Kohler Pl; Pelton Pl; Pontiac St; Verdi Pl; Pardee Aly; Saroyan Pl; Reno Pl.
North Beach neighborhood detailed profile
North Panhandle neighborhood in San Francisco statistics: (Find on map)
Area: 0.300 square miles
Population: 10,066
Population density:
Median household income in 2021:
Median rent in in 2021:
Male vs Females
Median age
Most popular occupations of males: sales and office occupations (20.4%); service occupations (16.9%); management occupations (except farmers) (16.7%); computer and mathematical occupations (16.2%); business and financial operations occupations (7.6%); arts, design, entertainment, sports, and media occupations (6.6%); architecture and engineering occupations (4.5%)
Most popular occupations of females: management occupations (except farmers) (25.6%); business and financial operations occupations (16.3%); sales and office occupations (14.1%); service occupations (11.3%); arts, design, entertainment, sports, and media occupations (8.3%); computer and mathematical occupations (6.2%); legal occupations (5.9%)
Roads and streets: Fell St; Hayes St; Grove St; Turk Blvd (Turk St); McAllister St; Golden Gate Ave; Fulton St; Masonic Ave; Central Ave; Lyon St; Baker St; Broderick St; Stanyan St; Cole St; Clayton St; Ashbury St; Shrader St; Kezar Dr.
North Panhandle neighborhood detailed profile
Area: 0.300 square miles
Population: 10,066
Population density:
| North Panhandle (North of Panhandle): | 33,583 people per square mile |
| San Francisco: | 17,458 people per square mile |
Median household income in 2021:
| North Panhandle (North of Panhandle): | $157,219 |
| San Francisco: | $121,826 |
Median rent in in 2021:
| North Panhandle (North of Panhandle): | $2,071 |
| San Francisco: | $2,001 |
Male vs Females
| Males: | 4,598 |
| Females: | 5,467 |
Median age
| Males: | 39.9 years |
| Females: | 33.4 years |
Most popular occupations of males: sales and office occupations (20.4%); service occupations (16.9%); management occupations (except farmers) (16.7%); computer and mathematical occupations (16.2%); business and financial operations occupations (7.6%); arts, design, entertainment, sports, and media occupations (6.6%); architecture and engineering occupations (4.5%)
Most popular occupations of females: management occupations (except farmers) (25.6%); business and financial operations occupations (16.3%); sales and office occupations (14.1%); service occupations (11.3%); arts, design, entertainment, sports, and media occupations (8.3%); computer and mathematical occupations (6.2%); legal occupations (5.9%)
Roads and streets: Fell St; Hayes St; Grove St; Turk Blvd (Turk St); McAllister St; Golden Gate Ave; Fulton St; Masonic Ave; Central Ave; Lyon St; Baker St; Broderick St; Stanyan St; Cole St; Clayton St; Ashbury St; Shrader St; Kezar Dr.
North Panhandle neighborhood detailed profile
North Waterfront neighborhood in San Francisco statistics: (Find on map)
Area: 0.376 square miles
Population: 2,461
Population density:
Median household income in 2021:
Median rent in in 2021:
Male vs Females
Median age
Most popular occupations of males: business and financial operations occupations (34.2%); service occupations (24.5%); computer and mathematical occupations (9.8%); management occupations (except farmers) (5.5%); architecture and engineering occupations (5.4%); sales and office occupations (5.4%); transportation occupations (5.4%)
Most popular occupations of females: sales and office occupations (35.0%); service occupations (32.1%); management occupations (except farmers) (11.4%); business and financial operations occupations (6.9%); computer and mathematical occupations (5.8%); legal occupations (3.1%); arts, design, entertainment, sports, and media occupations (2.9%)
Roads and streets: The Embarcadero; Bay St; N Point St; Beach St; Jefferson St; Sansome St; Battery St; Vallejo St; Taylor St; Green St; Chestnut St; Mason St; Powell St; Jones St; Columbus Ave; Union St; Front St; Fishermans Wharf; Montgomery St; Filbert St; Leavenworth St; Stockton St; Greenwich St; Kearny St; Lombard St; Hyde St; Commerce St; Grant Ave; Davis St; Cowell Pl; Icehouse Aly; Tonquin St; Orian Ln.
North Waterfront neighborhood detailed profile
Area: 0.376 square miles
Population: 2,461
Population density:
| North Waterfront: | 6,554 people per square mile |
| San Francisco: | 17,458 people per square mile |
Median household income in 2021:
| North Waterfront: | $194,795 |
| San Francisco: | $121,826 |
Median rent in in 2021:
| North Waterfront: | $1,361 |
| San Francisco: | $2,001 |
Male vs Females
| Males: | 1,105 |
| Females: | 1,356 |
Median age
| Males: | 45.1 years |
| Females: | 49.2 years |
Most popular occupations of males: business and financial operations occupations (34.2%); service occupations (24.5%); computer and mathematical occupations (9.8%); management occupations (except farmers) (5.5%); architecture and engineering occupations (5.4%); sales and office occupations (5.4%); transportation occupations (5.4%)
Most popular occupations of females: sales and office occupations (35.0%); service occupations (32.1%); management occupations (except farmers) (11.4%); business and financial operations occupations (6.9%); computer and mathematical occupations (5.8%); legal occupations (3.1%); arts, design, entertainment, sports, and media occupations (2.9%)
Roads and streets: The Embarcadero; Bay St; N Point St; Beach St; Jefferson St; Sansome St; Battery St; Vallejo St; Taylor St; Green St; Chestnut St; Mason St; Powell St; Jones St; Columbus Ave; Union St; Front St; Fishermans Wharf; Montgomery St; Filbert St; Leavenworth St; Stockton St; Greenwich St; Kearny St; Lombard St; Hyde St; Commerce St; Grant Ave; Davis St; Cowell Pl; Icehouse Aly; Tonquin St; Orian Ln.
North Waterfront neighborhood detailed profile
Oceanview neighborhood in San Francisco statistics: (Find on map)
Area: 0.308 square miles
Limited-access highways (interstate or state) in this neighborhood: I- 280.
Roads and streets: Capitol Ave; Lobos St; Sagamore St; Montana St; Plymouth Ave; Thrift St; Minerva St; Sadowa St; Farallones St; Broad St; de Long St; Wilson St; Summit St; Rhine St; Palmetto Ave; Alemany Blvd; Faxon Ave; Crystal St; Flournoy St; San Jose Ave.
Oceanview neighborhood detailed profile
Outer Mission neighborhood in San Francisco statistics: (Find on map)
Area: 0.341 square miles
Population: 11,643
Population density:
Median household income in 2021:
Median rent in in 2021:
Male vs Females
Median age
Housing prices:
Average estimated value of detached houses in 2021 (49.3% of all units):
Average estimated value of townhouses or other attached units in 2021 (41.6% of all units):
Most popular occupations of males: computer and mathematical occupations (25.1%); service occupations (24.9%); management occupations (except farmers) (8.8%); sales and office occupations (7.2%); transportation occupations (6.7%); architecture and engineering occupations (5.5%); arts, design, entertainment, sports, and media occupations (4.9%)
Most popular occupations of females: sales and office occupations (35.1%); service occupations (24.1%); education, training, and library occupations (12.9%); management occupations (except farmers) (10.0%); business and financial operations occupations (7.6%); healthcare practitioners and technical occupations (3.2%); production occupations (2.3%)
Limited-access highways (interstate or state) in this neighborhood: I- 280.
Roads and streets: Alemany Blvd; San Jose Ave; Huron Ave; Cayuga Ave; Ellington Ave; Niagara Ave; Mount Vernon Ave; Rome St; Naglee Ave; Foote Ave; Ottawa Ave; Whipple Ave; Farragut Ave; Delano Ave; Rae Ave; Sears St; Nahua Ave; Moneta Way; Sickles Ave; Shawnee Ave; Lawrence Ave; del Monte St; Liebig St; Sala Ter; Seminole Ave; Regent St; Laura St; de Wolf St; Rice St; Restani Way; Otega Ave; Milan Ter; Chancery Ln; Modoc Ave; Fredson Ct; Dichiera Ct; Lessing St; Moneta Ct; Goethe St; Ridge Ln.
Outer Mission neighborhood detailed profile
Area: 0.341 square miles
Population: 11,643
Population density:
| Outer Mission (Cayuga Terrace): | 34,135 people per square mile |
| San Francisco: | 17,458 people per square mile |
Median household income in 2021:
| Outer Mission (Cayuga Terrace): | $107,080 |
| San Francisco: | $121,826 |
Median rent in in 2021:
| Outer Mission (Cayuga Terrace): | $1,697 |
| San Francisco: | $2,001 |
Male vs Females
| Males: | 6,790 |
| Females: | 4,852 |
Median age
| Males: | 37.3 years |
| Females: | 46.9 years |
Housing prices:
Average estimated value of detached houses in 2021 (49.3% of all units):
| Outer Mission (Cayuga Terrace): | $951,129 |
| San Francisco: | $1,815,784 |
Average estimated value of townhouses or other attached units in 2021 (41.6% of all units):
| This neighborhood: | $1,144,898 |
| city: | $1,506,493 |
Most popular occupations of males: computer and mathematical occupations (25.1%); service occupations (24.9%); management occupations (except farmers) (8.8%); sales and office occupations (7.2%); transportation occupations (6.7%); architecture and engineering occupations (5.5%); arts, design, entertainment, sports, and media occupations (4.9%)
Most popular occupations of females: sales and office occupations (35.1%); service occupations (24.1%); education, training, and library occupations (12.9%); management occupations (except farmers) (10.0%); business and financial operations occupations (7.6%); healthcare practitioners and technical occupations (3.2%); production occupations (2.3%)
Limited-access highways (interstate or state) in this neighborhood: I- 280.
Roads and streets: Alemany Blvd; San Jose Ave; Huron Ave; Cayuga Ave; Ellington Ave; Niagara Ave; Mount Vernon Ave; Rome St; Naglee Ave; Foote Ave; Ottawa Ave; Whipple Ave; Farragut Ave; Delano Ave; Rae Ave; Sears St; Nahua Ave; Moneta Way; Sickles Ave; Shawnee Ave; Lawrence Ave; del Monte St; Liebig St; Sala Ter; Seminole Ave; Regent St; Laura St; de Wolf St; Rice St; Restani Way; Otega Ave; Milan Ter; Chancery Ln; Modoc Ave; Fredson Ct; Dichiera Ct; Lessing St; Moneta Ct; Goethe St; Ridge Ln.
Outer Mission neighborhood detailed profile
Outer Parkside neighborhood in San Francisco statistics: (Find on map)
Area: 0.919 square miles
Population: 13,704
Population density:
Median household income in 2021:
Median rent in in 2021:
Male vs Females
Median age
Housing prices:
Average estimated value of detached houses in 2021 (31.5% of all units):
Average estimated value of townhouses or other attached units in 2021 (52.7% of all units):
Average estimated value of housing units in 2-unit structures in 2021 (8.1% of all units):
Average estimated '21 value of housing units in 3-to-4-unit structures (14.6% of all units):
Average estimated '21 value of housing units in 5-or-more-unit structures (5.4% of all units):
Most popular occupations of males: sales and office occupations (19.5%); management occupations (except farmers) (14.0%); service occupations (12.9%); computer and mathematical occupations (11.4%); transportation occupations (7.4%); architecture and engineering occupations (6.2%); arts, design, entertainment, sports, and media occupations (5.8%)
Most popular occupations of females: service occupations (26.3%); sales and office occupations (16.7%); healthcare practitioners and technical occupations (14.4%); education, training, and library occupations (12.3%); business and financial operations occupations (9.0%); management occupations (except farmers) (8.2%); computer and mathematical occupations (3.2%)
Roads and streets: Sunset Blvd; Great Hwy; Sloat Blvd; 37th Ave; 42nd Ave; 43rd Ave; 39th Ave; 45th Ave; 44th Ave; 47th Ave; 46th Ave; Upper Great Hwy; 41st Ave; 40th Ave; Rivera St; Santiago St; Taraval St; Ulloa St; Vicente St; Wawona St; 38th Ave; Quintara St; 48th Ave; Pacheco St; Sloat Ave (Sloat Blvd); Yorba St; Cutler Ave; Yorba Ln.
Outer Parkside neighborhood detailed profile
Area: 0.919 square miles
Population: 13,704
Population density:
| Outer Parkside: | 14,912 people per square mile |
| San Francisco: | 17,458 people per square mile |
Median household income in 2021:
| Outer Parkside: | $124,463 |
| San Francisco: | $121,826 |
Median rent in in 2021:
| Outer Parkside: | $2,555 |
| San Francisco: | $2,001 |
Male vs Females
| Males: | 6,900 |
| Females: | 6,804 |
Median age
| Males: | 39.8 years |
| Females: | 42.3 years |
Housing prices:
Average estimated value of detached houses in 2021 (31.5% of all units):
| Outer Parkside: | $1,035,385 |
| San Francisco: | $1,815,784 |
Average estimated value of townhouses or other attached units in 2021 (52.7% of all units):
| This neighborhood: | $1,174,945 |
| city: | $1,506,493 |
Average estimated value of housing units in 2-unit structures in 2021 (8.1% of all units):
| This neighborhood: | $1,030,088 |
| San Francisco: | $1,685,431 |
Average estimated '21 value of housing units in 3-to-4-unit structures (14.6% of all units):
| Outer Parkside: | $987,059 |
| city: | $1,521,789 |
Average estimated '21 value of housing units in 5-or-more-unit structures (5.4% of all units):
| Outer Parkside: | $862,037 |
| San Francisco: | $1,317,001 |
Most popular occupations of males: sales and office occupations (19.5%); management occupations (except farmers) (14.0%); service occupations (12.9%); computer and mathematical occupations (11.4%); transportation occupations (7.4%); architecture and engineering occupations (6.2%); arts, design, entertainment, sports, and media occupations (5.8%)
Most popular occupations of females: service occupations (26.3%); sales and office occupations (16.7%); healthcare practitioners and technical occupations (14.4%); education, training, and library occupations (12.3%); business and financial operations occupations (9.0%); management occupations (except farmers) (8.2%); computer and mathematical occupations (3.2%)
Roads and streets: Sunset Blvd; Great Hwy; Sloat Blvd; 37th Ave; 42nd Ave; 43rd Ave; 39th Ave; 45th Ave; 44th Ave; 47th Ave; 46th Ave; Upper Great Hwy; 41st Ave; 40th Ave; Rivera St; Santiago St; Taraval St; Ulloa St; Vicente St; Wawona St; 38th Ave; Quintara St; 48th Ave; Pacheco St; Sloat Ave (Sloat Blvd); Yorba St; Cutler Ave; Yorba Ln.
Outer Parkside neighborhood detailed profile
Outer Richmond neighborhood in San Francisco statistics: (Find on map)
Area: 1.237 square miles
Population: 29,087
Population density:
Median household income in 2021:
Median rent in in 2021:
Male vs Females
Median age
Most popular occupations of males: computer and mathematical occupations (21.4%); management occupations (except farmers) (15.4%); service occupations (13.0%); sales and office occupations (11.6%); business and financial operations occupations (9.7%); education, training, and library occupations (4.5%); transportation occupations (4.4%)
Most popular occupations of females: sales and office occupations (24.2%); service occupations (15.4%); healthcare practitioners and technical occupations (15.2%); management occupations (except farmers) (13.7%); education, training, and library occupations (11.0%); life, physical, and social science occupations (6.5%); business and financial operations occupations (4.5%)
Roads and streets: Geary Blvd; Cabrillo St; Fulton St; Balboa St; 34th Ave; Uncle Wish Mem Rd; el Camino del Mar; Anza St; Point Lobos Ave; Clement St; Veterans Dr; Great Hwy; 36th Ave; 45th Ave; 33rd Ave; 35th Ave; 38th Ave; 39th Ave; 40th Ave; 41st Ave; 42nd Ave; 43rd Ave; 44th Ave; 37th Ave; 46th Ave; 47th Ave; 48th Ave; la Playa St; Fort Miley 3; Seal Rock Dr; Fort Miley 7; Shore View Ave; Sutro Heights Ave; Merrie Way; Fort Miley 5; Alta Mar Way; Fort Miley 6; Fort Miley 4.
Outer Richmond neighborhood detailed profile
Area: 1.237 square miles
Population: 29,087
Population density:
| Outer Richmond: | 23,517 people per square mile |
| San Francisco: | 17,458 people per square mile |
Median household income in 2021:
| Outer Richmond: | $144,866 |
| San Francisco: | $121,826 |
Median rent in in 2021:
| Outer Richmond: | $1,986 |
| San Francisco: | $2,001 |
Male vs Females
| Males: | 14,896 |
| Females: | 14,191 |
Median age
| Males: | 45.7 years |
| Females: | 48.2 years |
Most popular occupations of males: computer and mathematical occupations (21.4%); management occupations (except farmers) (15.4%); service occupations (13.0%); sales and office occupations (11.6%); business and financial operations occupations (9.7%); education, training, and library occupations (4.5%); transportation occupations (4.4%)
Most popular occupations of females: sales and office occupations (24.2%); service occupations (15.4%); healthcare practitioners and technical occupations (15.2%); management occupations (except farmers) (13.7%); education, training, and library occupations (11.0%); life, physical, and social science occupations (6.5%); business and financial operations occupations (4.5%)
Roads and streets: Geary Blvd; Cabrillo St; Fulton St; Balboa St; 34th Ave; Uncle Wish Mem Rd; el Camino del Mar; Anza St; Point Lobos Ave; Clement St; Veterans Dr; Great Hwy; 36th Ave; 45th Ave; 33rd Ave; 35th Ave; 38th Ave; 39th Ave; 40th Ave; 41st Ave; 42nd Ave; 43rd Ave; 44th Ave; 37th Ave; 46th Ave; 47th Ave; 48th Ave; la Playa St; Fort Miley 3; Seal Rock Dr; Fort Miley 7; Shore View Ave; Sutro Heights Ave; Merrie Way; Fort Miley 5; Alta Mar Way; Fort Miley 6; Fort Miley 4.
Outer Richmond neighborhood detailed profile
Outer Sunset neighborhood in San Francisco statistics: (Find on map)
Area: 4.501 square miles
Population: 63,650
Population density:
Median household income in 2021:
Median rent in in 2021:
Male vs Females
Median age
Housing prices:
Average estimated value of detached houses in 2021 (33.1% of all units):
Average estimated value of townhouses or other attached units in 2021 (40.1% of all units):
Average estimated value of housing units in 2-unit structures in 2021 (14.2% of all units):
Average estimated '21 value of housing units in 3-to-4-unit structures (12.6% of all units):
Average estimated '21 value of housing units in 5-or-more-unit structures (8.1% of all units):
Most popular occupations of males: sales and office occupations (18.1%); service occupations (16.2%); management occupations (except farmers) (12.6%); computer and mathematical occupations (9.5%); transportation occupations (7.0%); architecture and engineering occupations (5.6%); business and financial operations occupations (4.3%)
Most popular occupations of females: service occupations (20.0%); sales and office occupations (19.5%); management occupations (except farmers) (12.4%); healthcare practitioners and technical occupations (11.5%); business and financial operations occupations (9.0%); education, training, and library occupations (9.0%); life, physical, and social science occupations (3.8%)
Highways in this neighborhood: State Hwy 1 (19th Ave).
Roads and streets: Lincoln Way; Sunset Blvd; Sloat Blvd; Great Hwy; Irving St; Judah St; Kirkham St; Lawton St; Moraga St; Noriega St; Ortega St; Wawona St; Santiago St; Taraval St; Ulloa St; Vicente St; 34th Ave; 37th Ave; 36th Ave; 35th Ave; 42nd Ave; Quintara St; Rivera St; 43rd Ave; 45th Ave; 44th Ave; Upper Great Hwy; 47th Ave; 46th Ave; 30th Ave; 41st Ave; 22nd Ave; 20th Ave; 24th Ave; 21st Ave; 28th Ave; 31st Ave; 39th Ave; 33rd Ave; 32nd Ave; 29th Ave; 40th Ave; 48th Ave; 25th Ave; 38th Ave; 26th Ave; Pacheco St; 23rd Ave; 27th Ave; Crestlake Dr; Yorba St; Sloat Ave (Sloat Blvd); la Playa St; Vale Ave; Escondido Ave; Escolta Way; Pino Aly; el Mirasol Pl; Easement; Constanso Way; Goleta Ave; Cutler Ave; Paraiso Pl; Palos Pl; Gabilan Way; Rosemary Ct; Yorba Ln; Briarcliff Ter.
Outer Sunset neighborhood detailed profile
Area: 4.501 square miles
Population: 63,650
Population density:
| Outer Sunset: | 14,141 people per square mile |
| San Francisco: | 17,458 people per square mile |
Median household income in 2021:
| Outer Sunset: | $125,797 |
| San Francisco: | $121,826 |
Median rent in in 2021:
| Outer Sunset: | $2,196 |
| San Francisco: | $2,001 |
Male vs Females
| Males: | 32,420 |
| Females: | 31,229 |
Median age
| Males: | 43.5 years |
| Females: | 45.9 years |
Housing prices:
Average estimated value of detached houses in 2021 (33.1% of all units):
| Outer Sunset: | $1,127,505 |
| San Francisco: | $1,815,784 |
Average estimated value of townhouses or other attached units in 2021 (40.1% of all units):
| This neighborhood: | $1,193,693 |
| city: | $1,506,493 |
Average estimated value of housing units in 2-unit structures in 2021 (14.2% of all units):
| This neighborhood: | $932,143 |
| San Francisco: | $1,685,431 |
Average estimated '21 value of housing units in 3-to-4-unit structures (12.6% of all units):
| Outer Sunset: | $987,059 |
| city: | $1,521,789 |
Average estimated '21 value of housing units in 5-or-more-unit structures (8.1% of all units):
| Outer Sunset: | $802,873 |
| San Francisco: | $1,317,001 |
Most popular occupations of males: sales and office occupations (18.1%); service occupations (16.2%); management occupations (except farmers) (12.6%); computer and mathematical occupations (9.5%); transportation occupations (7.0%); architecture and engineering occupations (5.6%); business and financial operations occupations (4.3%)
Most popular occupations of females: service occupations (20.0%); sales and office occupations (19.5%); management occupations (except farmers) (12.4%); healthcare practitioners and technical occupations (11.5%); business and financial operations occupations (9.0%); education, training, and library occupations (9.0%); life, physical, and social science occupations (3.8%)
Highways in this neighborhood: State Hwy 1 (19th Ave).
Roads and streets: Lincoln Way; Sunset Blvd; Sloat Blvd; Great Hwy; Irving St; Judah St; Kirkham St; Lawton St; Moraga St; Noriega St; Ortega St; Wawona St; Santiago St; Taraval St; Ulloa St; Vicente St; 34th Ave; 37th Ave; 36th Ave; 35th Ave; 42nd Ave; Quintara St; Rivera St; 43rd Ave; 45th Ave; 44th Ave; Upper Great Hwy; 47th Ave; 46th Ave; 30th Ave; 41st Ave; 22nd Ave; 20th Ave; 24th Ave; 21st Ave; 28th Ave; 31st Ave; 39th Ave; 33rd Ave; 32nd Ave; 29th Ave; 40th Ave; 48th Ave; 25th Ave; 38th Ave; 26th Ave; Pacheco St; 23rd Ave; 27th Ave; Crestlake Dr; Yorba St; Sloat Ave (Sloat Blvd); la Playa St; Vale Ave; Escondido Ave; Escolta Way; Pino Aly; el Mirasol Pl; Easement; Constanso Way; Goleta Ave; Cutler Ave; Paraiso Pl; Palos Pl; Gabilan Way; Rosemary Ct; Yorba Ln; Briarcliff Ter.
Outer Sunset neighborhood detailed profile
Outset neighborhood in San Francisco statistics: (Find on map)
Area: 0.805 square miles
Population: 17,073
Population density:
Median household income in 2021:
Median rent in in 2021:
Male vs Females
Median age
Housing prices:
Average estimated value of detached houses in 2021 (33.5% of all units):
Average estimated value of townhouses or other attached units in 2021 (23.0% of all units):
Average estimated value of housing units in 2-unit structures in 2021 (16.3% of all units):
Average estimated '21 value of housing units in 3-to-4-unit structures (11.4% of all units):
Most popular occupations of males: sales and office occupations (20.1%); service occupations (18.2%); management occupations (except farmers) (10.4%); transportation occupations (10.3%); computer and mathematical occupations (9.7%); construction, extraction, and maintenance occupations (6.5%); business and financial operations occupations (4.0%)
Most popular occupations of females: sales and office occupations (21.8%); service occupations (21.5%); management occupations (except farmers) (10.2%); education, training, and library occupations (8.4%); arts, design, entertainment, sports, and media occupations (7.1%); business and financial operations occupations (6.9%); healthcare practitioners and technical occupations (6.3%)
Roads and streets: Lincoln Way; Sunset Blvd; Irving St; Judah St; Kirkham St; Lawton St; Moraga St; Noriega St; Great Hwy; 42nd Ave; 48th Ave; 46th Ave; 41st Ave; 44th Ave; 43rd Ave; 45th Ave; Ortega St; 40th Ave; 37th Ave; 39th Ave; 38th Ave; 47th Ave; la Playa St.
Outset neighborhood detailed profile
Area: 0.805 square miles
Population: 17,073
Population density:
| Outset: | 21,211 people per square mile |
| San Francisco: | 17,458 people per square mile |
Median household income in 2021:
| Outset: | $128,212 |
| San Francisco: | $121,826 |
Median rent in in 2021:
| Outset: | $1,895 |
| San Francisco: | $2,001 |
Male vs Females
| Males: | 9,137 |
| Females: | 7,936 |
Median age
| Males: | 43.4 years |
| Females: | 44.6 years |
Housing prices:
Average estimated value of detached houses in 2021 (33.5% of all units):
| Outset: | $1,187,328 |
| San Francisco: | $1,815,784 |
Average estimated value of townhouses or other attached units in 2021 (23.0% of all units):
| This neighborhood: | $1,065,583 |
| city: | $1,506,493 |
Average estimated value of housing units in 2-unit structures in 2021 (16.3% of all units):
| This neighborhood: | $932,143 |
| San Francisco: | $1,685,431 |
Average estimated '21 value of housing units in 3-to-4-unit structures (11.4% of all units):
| Outset: | $987,059 |
| city: | $1,521,789 |
Most popular occupations of males: sales and office occupations (20.1%); service occupations (18.2%); management occupations (except farmers) (10.4%); transportation occupations (10.3%); computer and mathematical occupations (9.7%); construction, extraction, and maintenance occupations (6.5%); business and financial operations occupations (4.0%)
Most popular occupations of females: sales and office occupations (21.8%); service occupations (21.5%); management occupations (except farmers) (10.2%); education, training, and library occupations (8.4%); arts, design, entertainment, sports, and media occupations (7.1%); business and financial operations occupations (6.9%); healthcare practitioners and technical occupations (6.3%)
Roads and streets: Lincoln Way; Sunset Blvd; Irving St; Judah St; Kirkham St; Lawton St; Moraga St; Noriega St; Great Hwy; 42nd Ave; 48th Ave; 46th Ave; 41st Ave; 44th Ave; 43rd Ave; 45th Ave; Ortega St; 40th Ave; 37th Ave; 39th Ave; 38th Ave; 47th Ave; la Playa St.
Outset neighborhood detailed profile
Pacific Heights neighborhood in San Francisco statistics: (Find on map)
Area: 0.768 square miles
Population: 13,904
Population density:
Median household income in 2021:
Median rent in in 2021:
Male vs Females
Median age
Housing prices:
Average estimated value of detached houses in 2021 (21.9% of all units):
Average estimated value of townhouses or other attached units in 2021 (5.6% of all units):
Average estimated value of housing units in 2-unit structures in 2021 (5.4% of all units):
Average estimated '21 value of housing units in 3-to-4-unit structures (16.4% of all units):
Average estimated '21 value of housing units in 5-or-more-unit structures (14.7% of all units):
Most popular occupations of males: management occupations (except farmers) (34.3%); business and financial operations occupations (19.2%); computer and mathematical occupations (11.5%); sales and office occupations (10.0%); legal occupations (6.5%); architecture and engineering occupations (3.6%); service occupations (3.1%)
Most popular occupations of females: management occupations (except farmers) (29.9%); business and financial operations occupations (16.4%); sales and office occupations (12.1%); arts, design, entertainment, sports, and media occupations (11.0%); computer and mathematical occupations (8.7%); education, training, and library occupations (6.3%); healthcare practitioners and technical occupations (5.6%)
Highways in this neighborhood: US Hwy 101 (Van Ness Ave).
Roads and streets: California St; Sacramento St; Pacific Ave; Jackson St; Broadway St (Broadway); Vallejo St; Green St; Washington St; Clay St; Divisadero St; Scott St; Baker St; Steiner St; Broderick St; Fillmore St; Webster St; Buchanan St; Laguna St; Gough St; Franklin St; Lyon St; Pierce St; Octavia St; Presidio Ave; Perine Pl; Bromley Pl; Normandie Ter; Raycliff Ter.
Pacific Heights neighborhood detailed profile
Area: 0.768 square miles
Population: 13,904
Population density:
| Pacific Heights: | 18,114 people per square mile |
| San Francisco: | 17,458 people per square mile |
Median household income in 2021:
| Pacific Heights: | $181,960 |
| San Francisco: | $121,826 |
Median rent in in 2021:
| Pacific Heights: | $2,803 |
| San Francisco: | $2,001 |
Male vs Females
| Males: | 7,387 |
| Females: | 6,517 |
Median age
| Males: | 40.7 years |
| Females: | 41.4 years |
Housing prices:
Average estimated value of detached houses in 2021 (21.9% of all units):
| Pacific Heights: | $6,110,655 |
| San Francisco: | $1,815,784 |
Average estimated value of townhouses or other attached units in 2021 (5.6% of all units):
| This neighborhood: | $4,014,286 |
| city: | $1,506,493 |
Average estimated value of housing units in 2-unit structures in 2021 (5.4% of all units):
| This neighborhood: | $3,240,870 |
| San Francisco: | $1,685,431 |
Average estimated '21 value of housing units in 3-to-4-unit structures (16.4% of all units):
| Pacific Heights: | $2,010,000 |
| city: | $1,521,789 |
Average estimated '21 value of housing units in 5-or-more-unit structures (14.7% of all units):
| Pacific Heights: | $2,020,833 |
| San Francisco: | $1,317,001 |
Most popular occupations of males: management occupations (except farmers) (34.3%); business and financial operations occupations (19.2%); computer and mathematical occupations (11.5%); sales and office occupations (10.0%); legal occupations (6.5%); architecture and engineering occupations (3.6%); service occupations (3.1%)
Most popular occupations of females: management occupations (except farmers) (29.9%); business and financial operations occupations (16.4%); sales and office occupations (12.1%); arts, design, entertainment, sports, and media occupations (11.0%); computer and mathematical occupations (8.7%); education, training, and library occupations (6.3%); healthcare practitioners and technical occupations (5.6%)
Highways in this neighborhood: US Hwy 101 (Van Ness Ave).
Roads and streets: California St; Sacramento St; Pacific Ave; Jackson St; Broadway St (Broadway); Vallejo St; Green St; Washington St; Clay St; Divisadero St; Scott St; Baker St; Steiner St; Broderick St; Fillmore St; Webster St; Buchanan St; Laguna St; Gough St; Franklin St; Lyon St; Pierce St; Octavia St; Presidio Ave; Perine Pl; Bromley Pl; Normandie Ter; Raycliff Ter.
Pacific Heights neighborhood detailed profile
Park Merced neighborhood in San Francisco statistics: (Find on map)
Area: 0.308 square miles
Population: 3,508
Population density:
Median household income in 2021:
Median rent in in 2021:
Male vs Females
Median age
Most popular occupations of males: service occupations (26.0%); sales and office occupations (24.6%); transportation occupations (12.0%); management occupations (except farmers) (10.3%); education, training, and library occupations (9.2%); computer and mathematical occupations (3.8%); healthcare practitioners and technical occupations (3.7%)
Most popular occupations of females: sales and office occupations (40.4%); service occupations (24.5%); education, training, and library occupations (12.3%); transportation occupations (7.1%); management occupations (except farmers) (3.9%); business and financial operations occupations (3.5%); material moving occupations (2.0%)
Roads and streets: Font Blvd; Vidal Dr; Gonzalez Dr; Arballo Dr; Garces Dr; Serrano Dr; Crespi Dr; Juan Bautista Cir; Bucareli Dr; Cambon Dr; Cardenas Ave; Higuera Ave; Grijalva Dr; Tapia Dr; Rivas Ave; Diaz Ave; Acevedo Ave; Pinto Ave; Chumasero Dr; Fuente Ave; Josepha Ave; Felix Ave; Galindo Ave; Holloway Ave; Castelo Ave; Varela Ave.
Park Merced neighborhood detailed profile
Area: 0.308 square miles
Population: 3,508
Population density:
| Park Merced (Parkmerced): | 11,399 people per square mile |
| San Francisco: | 17,458 people per square mile |
Median household income in 2021:
| Park Merced (Parkmerced): | $58,750 |
| San Francisco: | $121,826 |
Median rent in in 2021:
| Park Merced (Parkmerced): | $2,261 |
| San Francisco: | $2,001 |
Male vs Females
| Males: | 1,337 |
| Females: | 2,170 |
Median age
| Males: | 19.8 years |
| Females: | 19.3 years |
Most popular occupations of males: service occupations (26.0%); sales and office occupations (24.6%); transportation occupations (12.0%); management occupations (except farmers) (10.3%); education, training, and library occupations (9.2%); computer and mathematical occupations (3.8%); healthcare practitioners and technical occupations (3.7%)
Most popular occupations of females: sales and office occupations (40.4%); service occupations (24.5%); education, training, and library occupations (12.3%); transportation occupations (7.1%); management occupations (except farmers) (3.9%); business and financial operations occupations (3.5%); material moving occupations (2.0%)
Roads and streets: Font Blvd; Vidal Dr; Gonzalez Dr; Arballo Dr; Garces Dr; Serrano Dr; Crespi Dr; Juan Bautista Cir; Bucareli Dr; Cambon Dr; Cardenas Ave; Higuera Ave; Grijalva Dr; Tapia Dr; Rivas Ave; Diaz Ave; Acevedo Ave; Pinto Ave; Chumasero Dr; Fuente Ave; Josepha Ave; Felix Ave; Galindo Ave; Holloway Ave; Castelo Ave; Varela Ave.
Park Merced neighborhood detailed profile
Parkside neighborhood in San Francisco statistics: (Find on map)
Area: 1.066 square miles
Population: 21,281
Population density:
Median household income in 2021:
Median rent in in 2021:
Male vs Females
Median age
Housing prices:
Average estimated value of detached houses in 2021 (75.0% of all units):
Average estimated value of townhouses or other attached units in 2021 (25.0% of all units):
Most popular occupations of males: business and financial operations occupations (14.0%); sales and office occupations (13.9%); management occupations (except farmers) (12.5%); service occupations (8.5%); computer and mathematical occupations (7.5%); architecture and engineering occupations (7.3%); production occupations (6.0%)
Most popular occupations of females: business and financial operations occupations (30.1%); sales and office occupations (19.8%); healthcare practitioners and technical occupations (15.1%); service occupations (12.9%); education, training, and library occupations (8.1%); management occupations (except farmers) (7.6%); arts, design, entertainment, sports, and media occupations (4.0%)
Roads and streets: Vicente St; Ulloa St; Quintara St; Santiago St; Taraval St; 36th Ave; 35th Ave; Wawona St; Rivera St; 30th Ave; 20th Ave; 22nd Ave; 21st Ave; 24th Ave; 28th Ave; Pacheco St; 34th Ave; 31st Ave; 33rd Ave; 25th Ave; 32nd Ave; 29th Ave; 26th Ave; 27th Ave; 23rd Ave; Sloat Blvd; Escolta Way; Yorba St; Easement; Rosemary Ct.
Parkside neighborhood detailed profile
Area: 1.066 square miles
Population: 21,281
Population density:
| Parkside: | 19,958 people per square mile |
| San Francisco: | 17,458 people per square mile |
Median household income in 2021:
| Parkside: | $156,638 |
| San Francisco: | $121,826 |
Median rent in in 2021:
| Parkside: | $3,501 |
| San Francisco: | $2,001 |
Male vs Females
| Males: | 11,832 |
| Females: | 9,448 |
Median age
| Males: | 36.7 years |
| Females: | 44.9 years |
Housing prices:
Average estimated value of detached houses in 2021 (75.0% of all units):
| Parkside: | $1,702,509 |
| San Francisco: | $1,815,784 |
Average estimated value of townhouses or other attached units in 2021 (25.0% of all units):
| This neighborhood: | $1,171,783 |
| city: | $1,506,493 |
Most popular occupations of males: business and financial operations occupations (14.0%); sales and office occupations (13.9%); management occupations (except farmers) (12.5%); service occupations (8.5%); computer and mathematical occupations (7.5%); architecture and engineering occupations (7.3%); production occupations (6.0%)
Most popular occupations of females: business and financial operations occupations (30.1%); sales and office occupations (19.8%); healthcare practitioners and technical occupations (15.1%); service occupations (12.9%); education, training, and library occupations (8.1%); management occupations (except farmers) (7.6%); arts, design, entertainment, sports, and media occupations (4.0%)
Roads and streets: Vicente St; Ulloa St; Quintara St; Santiago St; Taraval St; 36th Ave; 35th Ave; Wawona St; Rivera St; 30th Ave; 20th Ave; 22nd Ave; 21st Ave; 24th Ave; 28th Ave; Pacheco St; 34th Ave; 31st Ave; 33rd Ave; 25th Ave; 32nd Ave; 29th Ave; 26th Ave; 27th Ave; 23rd Ave; Sloat Blvd; Escolta Way; Yorba St; Easement; Rosemary Ct.
Parkside neighborhood detailed profile
Parnassus neighborhood in San Francisco statistics: (Find on map)
Area: 0.234 square miles
Population: 3,983
Population density:
Median household income in 2021:
Median rent in in 2021:
Male vs Females
Median age
Housing prices:
Average estimated value of detached houses in 2021 (21.4% of all units):
Average estimated value of townhouses or other attached units in 2021 (8.3% of all units):
Average estimated value of housing units in 2-unit structures in 2021 (33.0% of all units):
Average estimated '21 value of housing units in 3-to-4-unit structures (7.2% of all units):
Average estimated '21 value of housing units in 5-or-more-unit structures (69.5% of all units):
Most popular occupations of males: computer and mathematical occupations (18.9%); sales and office occupations (16.3%); management occupations (except farmers) (12.7%); life, physical, and social science occupations (12.4%); healthcare practitioners and technical occupations (10.4%); business and financial operations occupations (5.5%); arts, design, entertainment, sports, and media occupations (5.1%)
Most popular occupations of females: healthcare practitioners and technical occupations (30.0%); business and financial operations occupations (12.3%); management occupations (except farmers) (10.7%); sales and office occupations (9.3%); service occupations (9.0%); architecture and engineering occupations (7.6%); education, training, and library occupations (6.8%)
Roads and streets: Parnassus Ave; Upper Ter; Clayton St; Roosevelt Way; 17th St; Ashbury St; Cole St; Belvedere St; Grattan St; Alma St; Rivoli St; Shrader St; Carmel St; Downey St; Frederick St; Clifford Ter; Stanyan St; Edgewood Ave; Woodland Ave; Masonic Ave; Willard St; Ashbury Ter; Delmar St; Piedmont St; Farnsworth Ln; Belmont Ave; Loma Vista Ter; Monument Way.
Parnassus neighborhood detailed profile
Area: 0.234 square miles
Population: 3,983
Population density:
| Parnassus (Ashbury Heights): | 17,018 people per square mile |
| San Francisco: | 17,458 people per square mile |
Median household income in 2021:
| Parnassus (Ashbury Heights): | $198,952 |
| San Francisco: | $121,826 |
Median rent in in 2021:
| Parnassus (Ashbury Heights): | $2,735 |
| San Francisco: | $2,001 |
Male vs Females
| Males: | 2,135 |
| Females: | 1,847 |
Median age
| Males: | 41.5 years |
| Females: | 37.1 years |
Housing prices:
Average estimated value of detached houses in 2021 (21.4% of all units):
| Parnassus (Ashbury Heights): | $1,689,747 |
| San Francisco: | $1,815,784 |
Average estimated value of townhouses or other attached units in 2021 (8.3% of all units):
| This neighborhood: | $1,043,631 |
| city: | $1,506,493 |
Average estimated value of housing units in 2-unit structures in 2021 (33.0% of all units):
| This neighborhood: | $1,866,667 |
| San Francisco: | $1,685,431 |
Average estimated '21 value of housing units in 3-to-4-unit structures (7.2% of all units):
| Parnassus (Ashbury Heights): | $1,005,826 |
| city: | $1,521,789 |
Average estimated '21 value of housing units in 5-or-more-unit structures (69.5% of all units):
| Parnassus (Ashbury Heights): | $528,621 |
| San Francisco: | $1,317,001 |
Most popular occupations of males: computer and mathematical occupations (18.9%); sales and office occupations (16.3%); management occupations (except farmers) (12.7%); life, physical, and social science occupations (12.4%); healthcare practitioners and technical occupations (10.4%); business and financial operations occupations (5.5%); arts, design, entertainment, sports, and media occupations (5.1%)
Most popular occupations of females: healthcare practitioners and technical occupations (30.0%); business and financial operations occupations (12.3%); management occupations (except farmers) (10.7%); sales and office occupations (9.3%); service occupations (9.0%); architecture and engineering occupations (7.6%); education, training, and library occupations (6.8%)
Roads and streets: Parnassus Ave; Upper Ter; Clayton St; Roosevelt Way; 17th St; Ashbury St; Cole St; Belvedere St; Grattan St; Alma St; Rivoli St; Shrader St; Carmel St; Downey St; Frederick St; Clifford Ter; Stanyan St; Edgewood Ave; Woodland Ave; Masonic Ave; Willard St; Ashbury Ter; Delmar St; Piedmont St; Farnsworth Ln; Belmont Ave; Loma Vista Ter; Monument Way.
Parnassus neighborhood detailed profile
Pier 39 neighborhood in San Francisco statistics: (Find on map)
Area: 0.013 square miles
Pier 39 neighborhood detailed profile
Area: 0.013 square miles
Pier 39 neighborhood detailed profile
Pine Lake Park neighborhood in San Francisco statistics: (Find on map)
Area: 0.162 square miles
Roads and streets: Crestlake Dr; Escondido Ave; Vale Ave; Yorba St; 34th Ave; Constanso Way.
Pine Lake Park neighborhood detailed profile
Area: 0.162 square miles
Roads and streets: Crestlake Dr; Escondido Ave; Vale Ave; Yorba St; 34th Ave; Constanso Way.
Pine Lake Park neighborhood detailed profile
Polk Gulch neighborhood in San Francisco statistics: (Find on map)
Area: 0.075 square miles
Roads and streets: Polk St.
Polk Gulch neighborhood detailed profile
Area: 0.075 square miles
Roads and streets: Polk St.
Polk Gulch neighborhood detailed profile
Portola neighborhood in San Francisco statistics: (Find on map)
Area: 0.771 square miles
Population: 14,476
Population density:
Median household income in 2021:
Median rent in in 2021:
Male vs Females
Median age
Housing prices:
Average estimated value of detached houses in 2021 (38.6% of all units):
Average estimated value of townhouses or other attached units in 2021 (45.5% of all units):
Most popular occupations of males: management occupations (except farmers) (13.9%); sales and office occupations (12.9%); service occupations (12.8%); computer and mathematical occupations (12.4%); construction, extraction, and maintenance occupations (7.5%); business and financial operations occupations (6.3%); architecture and engineering occupations (5.1%)
Most popular occupations of females: service occupations (27.2%); sales and office occupations (22.8%); business and financial operations occupations (17.4%); arts, design, entertainment, sports, and media occupations (8.0%); management occupations (except farmers) (5.0%); healthcare practitioners and technical occupations (3.8%); production occupations (3.3%)
Limited-access highways (interstate or state) in this neighborhood: US Hwy 101 (James Lick Fwy); I- 280.
Roads and streets: Silliman St; Felton St; Bacon St; Wayland St; Burrows St; Silver Ave; San Bruno Ave; Woolsey St; Sweeny St; Dwight St; University St; Bowdoin St; Girard St; Goettingen St; Hamilton St; Somerset St; Gaven St; Brussels St; Holyoke St; Cambridge St; Hale St; Oxford St; Princeton St; Harvard St; Dartmouth St; Colby St; Amherst St; Gambier St; Yale St; Barneveld Ave; Pioche St; Islais St; Rickard St; Boylston St; Karen Ct; Merrill St; Dunsmuir St; Tulane St; Weldon St; Thornton Ave; Augusta St; Campus Ln.
Portola neighborhood detailed profile
Area: 0.771 square miles
Population: 14,476
Population density:
| Portola: | 18,780 people per square mile |
| San Francisco: | 17,458 people per square mile |
Median household income in 2021:
| Portola: | $111,718 |
| San Francisco: | $121,826 |
Median rent in in 2021:
| Portola: | $2,376 |
| San Francisco: | $2,001 |
Male vs Females
| Males: | 7,394 |
| Females: | 7,081 |
Median age
| Males: | 40.3 years |
| Females: | 40.1 years |
Housing prices:
Average estimated value of detached houses in 2021 (38.6% of all units):
| Portola: | $876,119 |
| San Francisco: | $1,815,784 |
Average estimated value of townhouses or other attached units in 2021 (45.5% of all units):
| This neighborhood: | $924,437 |
| city: | $1,506,493 |
Most popular occupations of males: management occupations (except farmers) (13.9%); sales and office occupations (12.9%); service occupations (12.8%); computer and mathematical occupations (12.4%); construction, extraction, and maintenance occupations (7.5%); business and financial operations occupations (6.3%); architecture and engineering occupations (5.1%)
Most popular occupations of females: service occupations (27.2%); sales and office occupations (22.8%); business and financial operations occupations (17.4%); arts, design, entertainment, sports, and media occupations (8.0%); management occupations (except farmers) (5.0%); healthcare practitioners and technical occupations (3.8%); production occupations (3.3%)
Limited-access highways (interstate or state) in this neighborhood: US Hwy 101 (James Lick Fwy); I- 280.
Roads and streets: Silliman St; Felton St; Bacon St; Wayland St; Burrows St; Silver Ave; San Bruno Ave; Woolsey St; Sweeny St; Dwight St; University St; Bowdoin St; Girard St; Goettingen St; Hamilton St; Somerset St; Gaven St; Brussels St; Holyoke St; Cambridge St; Hale St; Oxford St; Princeton St; Harvard St; Dartmouth St; Colby St; Amherst St; Gambier St; Yale St; Barneveld Ave; Pioche St; Islais St; Rickard St; Boylston St; Karen Ct; Merrill St; Dunsmuir St; Tulane St; Weldon St; Thornton Ave; Augusta St; Campus Ln.
Portola neighborhood detailed profile
Potrero Flats neighborhood in San Francisco statistics: (Find on map)
Area: 0.621 square miles
Population: 7,491
Population density:
Median household income in 2021:
Median rent in in 2021:
Male vs Females
Median age
Housing prices:
Average estimated value of detached houses in 2021 (10.1% of all units):
Average estimated value of townhouses or other attached units in 2021 (6.8% of all units):
Average estimated value of housing units in 2-unit structures in 2021 (17.2% of all units):
Average estimated '21 value of housing units in 3-to-4-unit structures (14.1% of all units):
Average estimated '21 value of housing units in 5-or-more-unit structures (22.0% of all units):
Most popular occupations of males: management occupations (except farmers) (19.0%); computer and mathematical occupations (16.3%); arts, design, entertainment, sports, and media occupations (10.8%); sales and office occupations (8.6%); service occupations (7.3%); architecture and engineering occupations (6.8%); business and financial operations occupations (4.9%)
Most popular occupations of females: management occupations (except farmers) (23.7%); service occupations (16.0%); sales and office occupations (9.6%); arts, design, entertainment, sports, and media occupations (9.5%); computer and mathematical occupations (7.5%); healthcare practitioners and technical occupations (7.4%); education, training, and library occupations (6.7%)
Limited-access highways (interstate or state) in this neighborhood: US Hwy 101 (James Lick Fwy); I- 80 (James Lick Fwy).
Highways in this neighborhood: US Hwy 101 (Central Fwy); US Hwy 101.
Roads and streets: Mariposa St; 18th St; 19th St; 17th St; 16th St; Potrero Ave; Alameda St; 15th St; Rhode Island St; San Bruno Ave; Bryant St; Utah St; de Haro St; Harrison St; Florida St; Carolina St; Vermont St; Alabama St; Kansas St; Hampshire St; Division St; Missouri St; Connecticut St; Arkansas St; York St; Mississippi St; Texas St; Treat Ave; Hooper St; Irwin St; Pennsylvania Ave; 7th St; 8th St; Henry Adams St; Wisconsin St; Brannan St; Channel St.
Railroad features: Union Pacific RR.
Potrero Flats neighborhood detailed profile
Area: 0.621 square miles
Population: 7,491
Population density:
| Potrero Flats: | 12,065 people per square mile |
| San Francisco: | 17,458 people per square mile |
Median household income in 2021:
| Potrero Flats: | $165,058 |
| San Francisco: | $121,826 |
Median rent in in 2021:
| Potrero Flats: | $2,504 |
| San Francisco: | $2,001 |
Male vs Females
| Males: | 3,861 |
| Females: | 3,629 |
Median age
| Males: | 36.7 years |
| Females: | 37.8 years |
Housing prices:
Average estimated value of detached houses in 2021 (10.1% of all units):
| Potrero Flats: | $1,385,714 |
| San Francisco: | $1,815,784 |
Average estimated value of townhouses or other attached units in 2021 (6.8% of all units):
| This neighborhood: | $884,478 |
| city: | $1,506,493 |
Average estimated value of housing units in 2-unit structures in 2021 (17.2% of all units):
| This neighborhood: | $1,110,638 |
| San Francisco: | $1,685,431 |
Average estimated '21 value of housing units in 3-to-4-unit structures (14.1% of all units):
| Potrero Flats: | $895,903 |
| city: | $1,521,789 |
Average estimated '21 value of housing units in 5-or-more-unit structures (22.0% of all units):
| Potrero Flats: | $1,001,746 |
| San Francisco: | $1,317,001 |
Most popular occupations of males: management occupations (except farmers) (19.0%); computer and mathematical occupations (16.3%); arts, design, entertainment, sports, and media occupations (10.8%); sales and office occupations (8.6%); service occupations (7.3%); architecture and engineering occupations (6.8%); business and financial operations occupations (4.9%)
Most popular occupations of females: management occupations (except farmers) (23.7%); service occupations (16.0%); sales and office occupations (9.6%); arts, design, entertainment, sports, and media occupations (9.5%); computer and mathematical occupations (7.5%); healthcare practitioners and technical occupations (7.4%); education, training, and library occupations (6.7%)
Limited-access highways (interstate or state) in this neighborhood: US Hwy 101 (James Lick Fwy); I- 80 (James Lick Fwy).
Highways in this neighborhood: US Hwy 101 (Central Fwy); US Hwy 101.
Roads and streets: Mariposa St; 18th St; 19th St; 17th St; 16th St; Potrero Ave; Alameda St; 15th St; Rhode Island St; San Bruno Ave; Bryant St; Utah St; de Haro St; Harrison St; Florida St; Carolina St; Vermont St; Alabama St; Kansas St; Hampshire St; Division St; Missouri St; Connecticut St; Arkansas St; York St; Mississippi St; Texas St; Treat Ave; Hooper St; Irwin St; Pennsylvania Ave; 7th St; 8th St; Henry Adams St; Wisconsin St; Brannan St; Channel St.
Railroad features: Union Pacific RR.
Potrero Flats neighborhood detailed profile
Potrero Hill neighborhood in San Francisco statistics: (Find on map)
Area: 1.520 square miles
Population: 14,016
Population density:
Median household income in 2021:
Median rent in in 2021:
Male vs Females
Median age
Housing prices:
Average estimated value of detached houses in 2021 (6.9% of all units):
Average estimated value of townhouses or other attached units in 2021 (5.2% of all units):
Average estimated value of housing units in 2-unit structures in 2021 (14.7% of all units):
Average estimated '21 value of housing units in 3-to-4-unit structures (10.6% of all units):
Average estimated '21 value of housing units in 5-or-more-unit structures (42.4% of all units):
Most popular occupations of males: management occupations (except farmers) (29.2%); computer and mathematical occupations (18.5%); arts, design, entertainment, sports, and media occupations (10.4%); service occupations (6.3%); sales and office occupations (6.0%); architecture and engineering occupations (5.2%); life, physical, and social science occupations (4.8%)
Most popular occupations of females: management occupations (except farmers) (26.4%); computer and mathematical occupations (14.9%); healthcare practitioners and technical occupations (10.1%); arts, design, entertainment, sports, and media occupations (10.0%); business and financial operations occupations (8.9%); sales and office occupations (6.8%); life, physical, and social science occupations (5.9%)
Limited-access highways (interstate or state) in this neighborhood: I- 280; US Hwy 101 (James Lick Fwy).
Roads and streets: 3rd St; 20th St; Cesar Chavez (Cesar Chavez St); 25th St; 22nd St; 23rd St; 19th St; 18th St; Illinois St; Iowa St; Mariposa St; 26th St; Pennsylvania Ave; de Haro St; Carolina St; Kansas St; Rhode Island St; Tennessee St; Indiana St; Connecticut St; Missouri St; Minnesota St; 17th St; Arkansas St; Vermont St; Mississippi St; Wisconsin St; Texas St; 24th St; Michigan St; Humboldt St; Maryland St; Dakota St; San Bruno Ave; Marin St; Yellow Cab Access Rd; Coral Rd; Southern Heights Ave; Blair Ter; Tubbs St; Littlefield Ter; Utah St; Delaware St; Louisburg St; Georgia St; Turner Ter; Tulare St; Watchman Way; Madera St; 21st St; Sierra St; Caire Ter; Arkansas Way; Fontinella Ter; Cesar Chavez St.
Railroad features: Union Pacific RR.
Potrero Hill neighborhood detailed profile
Area: 1.520 square miles
Population: 14,016
Population density:
| Potrero Hill: | 9,222 people per square mile |
| San Francisco: | 17,458 people per square mile |
Median household income in 2021:
| Potrero Hill: | $204,358 |
| San Francisco: | $121,826 |
Median rent in in 2021:
| Potrero Hill: | $2,963 |
| San Francisco: | $2,001 |
Male vs Females
| Males: | 7,781 |
| Females: | 6,234 |
Median age
| Males: | 34.7 years |
| Females: | 36.7 years |
Housing prices:
Average estimated value of detached houses in 2021 (6.9% of all units):
| Potrero Hill: | $2,185,755 |
| San Francisco: | $1,815,784 |
Average estimated value of townhouses or other attached units in 2021 (5.2% of all units):
| This neighborhood: | $1,401,667 |
| city: | $1,506,493 |
Average estimated value of housing units in 2-unit structures in 2021 (14.7% of all units):
| This neighborhood: | $1,845,283 |
| San Francisco: | $1,685,431 |
Average estimated '21 value of housing units in 3-to-4-unit structures (10.6% of all units):
| Potrero Hill: | $1,876,596 |
| city: | $1,521,789 |
Average estimated '21 value of housing units in 5-or-more-unit structures (42.4% of all units):
| Potrero Hill: | $1,109,028 |
| San Francisco: | $1,317,001 |
Most popular occupations of males: management occupations (except farmers) (29.2%); computer and mathematical occupations (18.5%); arts, design, entertainment, sports, and media occupations (10.4%); service occupations (6.3%); sales and office occupations (6.0%); architecture and engineering occupations (5.2%); life, physical, and social science occupations (4.8%)
Most popular occupations of females: management occupations (except farmers) (26.4%); computer and mathematical occupations (14.9%); healthcare practitioners and technical occupations (10.1%); arts, design, entertainment, sports, and media occupations (10.0%); business and financial operations occupations (8.9%); sales and office occupations (6.8%); life, physical, and social science occupations (5.9%)
Limited-access highways (interstate or state) in this neighborhood: I- 280; US Hwy 101 (James Lick Fwy).
Roads and streets: 3rd St; 20th St; Cesar Chavez (Cesar Chavez St); 25th St; 22nd St; 23rd St; 19th St; 18th St; Illinois St; Iowa St; Mariposa St; 26th St; Pennsylvania Ave; de Haro St; Carolina St; Kansas St; Rhode Island St; Tennessee St; Indiana St; Connecticut St; Missouri St; Minnesota St; 17th St; Arkansas St; Vermont St; Mississippi St; Wisconsin St; Texas St; 24th St; Michigan St; Humboldt St; Maryland St; Dakota St; San Bruno Ave; Marin St; Yellow Cab Access Rd; Coral Rd; Southern Heights Ave; Blair Ter; Tubbs St; Littlefield Ter; Utah St; Delaware St; Louisburg St; Georgia St; Turner Ter; Tulare St; Watchman Way; Madera St; 21st St; Sierra St; Caire Ter; Arkansas Way; Fontinella Ter; Cesar Chavez St.
Railroad features: Union Pacific RR.
Potrero Hill neighborhood detailed profile
Presidio neighborhood in San Francisco statistics: (Find on map)
Area: 2.347 square miles
Population: 750
Population density:
Median household income in 2021:
Median rent in in 2021:
Male vs Females
Median age
Housing prices:
Average estimated value of detached houses in 2021 (964.0% of all units):
Average estimated value of townhouses or other attached units in 2021 (11.1% of all units):
Average estimated value of housing units in 2-unit structures in 2021 (11.4% of all units):
Average estimated '21 value of housing units in 3-to-4-unit structures (35.6% of all units):
Average estimated '21 value of housing units in 5-or-more-unit structures (15.9% of all units):
Most popular occupations of males: management occupations (except farmers) (30.4%); sales and office occupations (14.2%); service occupations (11.2%); business and financial operations occupations (9.5%); architecture and engineering occupations (8.0%); life, physical, and social science occupations (6.7%); computer and mathematical occupations (5.2%)
Most popular occupations of females: sales and office occupations (28.8%); business and financial operations occupations (14.0%); education, training, and library occupations (11.3%); management occupations (except farmers) (9.8%); service occupations (9.8%); arts, design, entertainment, sports, and media occupations (9.1%); legal occupations (4.9%)
Highways in this neighborhood: State Hwy 1 (US Hwy 101); State Hwy 1; US Hwy 101 (Richardson Ave).
Roads and streets: Lincoln Blvd; Washington Blvd; Park Blvd; Mason St; Presidio Blvd; Amatury Loop; Arguello Blvd; Sheridan Ave; Kobbe Ave; Old Mason St; Ralston Ave; Simonds Loop; Marine Dr; Pershing Dr; Hitchcock St; Infantry Ter; Storey Ave; Crissy Field Ave; Macarthur Ave; Gorgas Ave; Piper Loop; Mesa St; Harde Ave; Allen St; Funston Ave; Graham St; Letterman Dr; Battery East Rd; Ruckman Ave; Rodriguez St; Upton Ave; Pacific Ave; Sumner St; Vallejo St; Bowley St; Armistead Rd; Montgomery St; Hoffman St; Wright Loop; Moraga Ave; Keyes Ave; Compton Rd; Cowles St; Battery Caulfield Rd; French Ct; Battery Blaney Rd; Lundeen St; Fisher Loop; Portola St; W Pacific Ave; Liggett Ave; Hays; Sanches St; Edie Rd; Schofield Rd; Merchant Rd; Thomas Ave; Banks St; Anza Ave; Sherman Rd; Dewitt Rd; Shafter Rd; Hamilton St; Morton St; Appleton St; Quarry Rd; Gibson Rd; Mauldin St; Howard Rd; Halleck St; Stillwell Rd; Wyman Ave; McDowell Ave; Sibert Loop; Barnard Ave; Wedemeyer; Patten Rd; Clark St; Jauss St; Taylor Rd; Ruger St; Battery Wagner Rd; Girard Rd; Young St; McRae St; Doyle; Kennedy Ave; Lombard St; Sibley Rd (Sibly Rd); el Polin Loop; Mitchell St; Pearce St; Wisser Ct; Battery Chamberlin Rd; Birmingham Rd; Battery Dynamite Rd; Freeman St; Marshall St; Harrison Blvd; Brown St; Torney Ave; Battery Safford Rd; McNair Ct; Thornburg Rd; Martinez St; Oreilly Ave; Sibley Rd; el Camino del Mar; Chism Rd; Truby St; Long Ave; Bliss Rd; Belles St; Incinerator Rd; Wool Ct; Baker Ct; Howe Rd; Ramsell Ct (Ramsel Ct); Langdon Ct; Muir Loop; Greenough Ave; Wallen St; Todd St; Riley Ave; Javowitz St; Fernandez St; McDonald St; N 15th Ave; Patton Ct; Wedemeyer St; Livinston St; Pope Ct; Hicks Rd; Lendrum Ct; Howard Ct; Kinzey St; Gibbon Ct; Stone St; Wallen Ct; Kendall Dr; Miles Ct; Young Ct; Ord St; Battery Cranston Rd; Barry Ct; Brooks St; Hwy 101 N on Rmp; Vista Ct; Bank St; Kearny Ln; S Hughes Ln; Muir Ct; Rawles St; Soule Ln; Hitchcock Ln; Deems Rd; Greely Ct; Johnstone Dr; Hwt 101 N Off Ramp; Murray Ln; Schofield; McRae Ln; Winn Way; Sternberg Rd; Seawell Ln; Pennington; Gibbon Ln; Bliss Ct; Walker Ct; N Hughes Ln; Crook St; Sal St; Thomas Ct; Craig Ct; Wright Ct; Canby St; Owens St; Bowley Ct; Pena St; Menoher Ln; Smith Ln; Clarke Ln; Hays St; Merriam Ln; Canby Ln; N Van Horn Ln; Beale St; Treat Ln; Blatchford Ln; Sibert Ln; Bliss St; Bell Ct; Forsyth Ln; W Halleck St.
Presidio neighborhood detailed profile
Area: 2.347 square miles
Population: 750
Population density:
| Presidio (Crissy Field): | 320 people per square mile |
| San Francisco: | 17,458 people per square mile |
Median household income in 2021:
| Presidio (Crissy Field): | $219,212 |
| San Francisco: | $121,826 |
Median rent in in 2021:
| Presidio (Crissy Field): | $3,417 |
| San Francisco: | $2,001 |
Male vs Females
| Males: | 320 |
| Females: | 429 |
Median age
| Males: | 39.7 years |
| Females: | 40.4 years |
Housing prices:
Average estimated value of detached houses in 2021 (964.0% of all units):
| Presidio (Crissy Field): | $17,617,916 |
| San Francisco: | $1,815,784 |
Average estimated value of townhouses or other attached units in 2021 (11.1% of all units):
| This neighborhood: | $2,365,586 |
| city: | $1,506,493 |
Average estimated value of housing units in 2-unit structures in 2021 (11.4% of all units):
| This neighborhood: | $72,556,036 |
| San Francisco: | $1,685,431 |
Average estimated '21 value of housing units in 3-to-4-unit structures (35.6% of all units):
| Presidio (Crissy Field): | $2,362,981 |
| city: | $1,521,789 |
Average estimated '21 value of housing units in 5-or-more-unit structures (15.9% of all units):
| Presidio (Crissy Field): | $1,634,514 |
| San Francisco: | $1,317,001 |
Most popular occupations of males: management occupations (except farmers) (30.4%); sales and office occupations (14.2%); service occupations (11.2%); business and financial operations occupations (9.5%); architecture and engineering occupations (8.0%); life, physical, and social science occupations (6.7%); computer and mathematical occupations (5.2%)
Most popular occupations of females: sales and office occupations (28.8%); business and financial operations occupations (14.0%); education, training, and library occupations (11.3%); management occupations (except farmers) (9.8%); service occupations (9.8%); arts, design, entertainment, sports, and media occupations (9.1%); legal occupations (4.9%)
Highways in this neighborhood: State Hwy 1 (US Hwy 101); State Hwy 1; US Hwy 101 (Richardson Ave).
Roads and streets: Lincoln Blvd; Washington Blvd; Park Blvd; Mason St; Presidio Blvd; Amatury Loop; Arguello Blvd; Sheridan Ave; Kobbe Ave; Old Mason St; Ralston Ave; Simonds Loop; Marine Dr; Pershing Dr; Hitchcock St; Infantry Ter; Storey Ave; Crissy Field Ave; Macarthur Ave; Gorgas Ave; Piper Loop; Mesa St; Harde Ave; Allen St; Funston Ave; Graham St; Letterman Dr; Battery East Rd; Ruckman Ave; Rodriguez St; Upton Ave; Pacific Ave; Sumner St; Vallejo St; Bowley St; Armistead Rd; Montgomery St; Hoffman St; Wright Loop; Moraga Ave; Keyes Ave; Compton Rd; Cowles St; Battery Caulfield Rd; French Ct; Battery Blaney Rd; Lundeen St; Fisher Loop; Portola St; W Pacific Ave; Liggett Ave; Hays; Sanches St; Edie Rd; Schofield Rd; Merchant Rd; Thomas Ave; Banks St; Anza Ave; Sherman Rd; Dewitt Rd; Shafter Rd; Hamilton St; Morton St; Appleton St; Quarry Rd; Gibson Rd; Mauldin St; Howard Rd; Halleck St; Stillwell Rd; Wyman Ave; McDowell Ave; Sibert Loop; Barnard Ave; Wedemeyer; Patten Rd; Clark St; Jauss St; Taylor Rd; Ruger St; Battery Wagner Rd; Girard Rd; Young St; McRae St; Doyle; Kennedy Ave; Lombard St; Sibley Rd (Sibly Rd); el Polin Loop; Mitchell St; Pearce St; Wisser Ct; Battery Chamberlin Rd; Birmingham Rd; Battery Dynamite Rd; Freeman St; Marshall St; Harrison Blvd; Brown St; Torney Ave; Battery Safford Rd; McNair Ct; Thornburg Rd; Martinez St; Oreilly Ave; Sibley Rd; el Camino del Mar; Chism Rd; Truby St; Long Ave; Bliss Rd; Belles St; Incinerator Rd; Wool Ct; Baker Ct; Howe Rd; Ramsell Ct (Ramsel Ct); Langdon Ct; Muir Loop; Greenough Ave; Wallen St; Todd St; Riley Ave; Javowitz St; Fernandez St; McDonald St; N 15th Ave; Patton Ct; Wedemeyer St; Livinston St; Pope Ct; Hicks Rd; Lendrum Ct; Howard Ct; Kinzey St; Gibbon Ct; Stone St; Wallen Ct; Kendall Dr; Miles Ct; Young Ct; Ord St; Battery Cranston Rd; Barry Ct; Brooks St; Hwy 101 N on Rmp; Vista Ct; Bank St; Kearny Ln; S Hughes Ln; Muir Ct; Rawles St; Soule Ln; Hitchcock Ln; Deems Rd; Greely Ct; Johnstone Dr; Hwt 101 N Off Ramp; Murray Ln; Schofield; McRae Ln; Winn Way; Sternberg Rd; Seawell Ln; Pennington; Gibbon Ln; Bliss Ct; Walker Ct; N Hughes Ln; Crook St; Sal St; Thomas Ct; Craig Ct; Wright Ct; Canby St; Owens St; Bowley Ct; Pena St; Menoher Ln; Smith Ln; Clarke Ln; Hays St; Merriam Ln; Canby Ln; N Van Horn Ln; Beale St; Treat Ln; Blatchford Ln; Sibert Ln; Bliss St; Bell Ct; Forsyth Ln; W Halleck St.
Presidio neighborhood detailed profile
Presidio Heights neighborhood in San Francisco statistics: (Find on map)
Area: 0.246 square miles
Population: 4,972
Population density:
Median household income in 2021:
Median rent in in 2021:
Male vs Females
Median age
Housing prices:
Average estimated value of detached houses in 2021 (30.2% of all units):
Average estimated value of townhouses or other attached units in 2021 (4.5% of all units):
Average estimated value of housing units in 2-unit structures in 2021 (12.0% of all units):
Average estimated '21 value of housing units in 3-to-4-unit structures (12.2% of all units):
Average estimated '21 value of housing units in 5-or-more-unit structures (33.4% of all units):
Most popular occupations of males: management occupations (except farmers) (26.5%); business and financial operations occupations (15.8%); sales and office occupations (10.3%); computer and mathematical occupations (8.9%); arts, design, entertainment, sports, and media occupations (6.7%); service occupations (6.1%); legal occupations (6.0%)
Most popular occupations of females: management occupations (except farmers) (20.5%); healthcare practitioners and technical occupations (13.5%); arts, design, entertainment, sports, and media occupations (12.7%); sales and office occupations (10.8%); business and financial operations occupations (10.2%); education, training, and library occupations (8.7%); service occupations (7.9%)
Roads and streets: California St; Sacramento St; Clay St; Washington St; Jackson St; Pacific Ave; Presidio Ter; Walnut St; Laurel St; Locust St; Spruce St; Maple St; Cherry St; Arguello Blvd.
Presidio Heights neighborhood detailed profile
Area: 0.246 square miles
Population: 4,972
Population density:
| Presidio Heights: | 20,231 people per square mile |
| San Francisco: | 17,458 people per square mile |
Median household income in 2021:
| Presidio Heights: | $182,491 |
| San Francisco: | $121,826 |
Median rent in in 2021:
| Presidio Heights: | $2,480 |
| San Francisco: | $2,001 |
Male vs Females
| Males: | 2,285 |
| Females: | 2,686 |
Median age
| Males: | 36.4 years |
| Females: | 40.8 years |
Housing prices:
Average estimated value of detached houses in 2021 (30.2% of all units):
| Presidio Heights: | $3,561,354 |
| San Francisco: | $1,815,784 |
Average estimated value of townhouses or other attached units in 2021 (4.5% of all units):
| This neighborhood: | $3,631,066 |
| city: | $1,506,493 |
Average estimated value of housing units in 2-unit structures in 2021 (12.0% of all units):
| This neighborhood: | $1,118,402 |
| San Francisco: | $1,685,431 |
Average estimated '21 value of housing units in 3-to-4-unit structures (12.2% of all units):
| Presidio Heights: | $2,010,000 |
| city: | $1,521,789 |
Average estimated '21 value of housing units in 5-or-more-unit structures (33.4% of all units):
| Presidio Heights: | $2,020,833 |
| San Francisco: | $1,317,001 |
Most popular occupations of males: management occupations (except farmers) (26.5%); business and financial operations occupations (15.8%); sales and office occupations (10.3%); computer and mathematical occupations (8.9%); arts, design, entertainment, sports, and media occupations (6.7%); service occupations (6.1%); legal occupations (6.0%)
Most popular occupations of females: management occupations (except farmers) (20.5%); healthcare practitioners and technical occupations (13.5%); arts, design, entertainment, sports, and media occupations (12.7%); sales and office occupations (10.8%); business and financial operations occupations (10.2%); education, training, and library occupations (8.7%); service occupations (7.9%)
Roads and streets: California St; Sacramento St; Clay St; Washington St; Jackson St; Pacific Ave; Presidio Ter; Walnut St; Laurel St; Locust St; Spruce St; Maple St; Cherry St; Arguello Blvd.
Presidio Heights neighborhood detailed profile
Presidio Terrace neighborhood in San Francisco statistics: (Find on map)
Area: 0.046 square miles
Population: 1,025
Population density:
Median household income in 2021:
Median rent in in 2021:
Male vs Females
Median age
Housing prices:
Average estimated value of detached houses in 2021 (30.3% of all units):
Average estimated value of townhouses or other attached units in 2021 (1.3% of all units):
Average estimated value of housing units in 2-unit structures in 2021 (12.6% of all units):
Average estimated '21 value of housing units in 3-to-4-unit structures (32.6% of all units):
Average estimated '21 value of housing units in 5-or-more-unit structures (1.0% of all units):
Most popular occupations of males: education, training, and library occupations (27.4%); management occupations (except farmers) (23.1%); computer and mathematical occupations (13.5%); production occupations (8.0%); business and financial operations occupations (7.6%); legal occupations (7.5%); sales and office occupations (3.5%)
Most popular occupations of females: healthcare practitioners and technical occupations (36.8%); management occupations (except farmers) (12.5%); sales and office occupations (9.7%); community and social services occupations (7.8%); education, training, and library occupations (6.8%); business and financial operations occupations (6.6%); service occupations (5.6%)
Roads and streets: Presidio Ter; Lake St; Pacific Ave; Arguello Blvd; 5th Ave; 3rd Ave; 2nd Ave.
Presidio Terrace neighborhood detailed profile
Area: 0.046 square miles
Population: 1,025
Population density:
| Presidio Terrace: | 22,441 people per square mile |
| San Francisco: | 17,458 people per square mile |
Median household income in 2021:
| Presidio Terrace: | $186,994 |
| San Francisco: | $121,826 |
Median rent in in 2021:
| Presidio Terrace: | $2,538 |
| San Francisco: | $2,001 |
Male vs Females
| Males: | 394 |
| Females: | 630 |
Median age
| Males: | 33.4 years |
| Females: | 38.6 years |
Housing prices:
Average estimated value of detached houses in 2021 (30.3% of all units):
| Presidio Terrace: | $1,977,365 |
| San Francisco: | $1,815,784 |
Average estimated value of townhouses or other attached units in 2021 (1.3% of all units):
| This neighborhood: | $2,346,621 |
| city: | $1,506,493 |
Average estimated value of housing units in 2-unit structures in 2021 (12.6% of all units):
| This neighborhood: | $3,057,317 |
| San Francisco: | $1,685,431 |
Average estimated '21 value of housing units in 3-to-4-unit structures (32.6% of all units):
| Presidio Terrace: | $1,047,747 |
| city: | $1,521,789 |
Average estimated '21 value of housing units in 5-or-more-unit structures (1.0% of all units):
| Presidio Terrace: | $1,712,489 |
| San Francisco: | $1,317,001 |
Most popular occupations of males: education, training, and library occupations (27.4%); management occupations (except farmers) (23.1%); computer and mathematical occupations (13.5%); production occupations (8.0%); business and financial operations occupations (7.6%); legal occupations (7.5%); sales and office occupations (3.5%)
Most popular occupations of females: healthcare practitioners and technical occupations (36.8%); management occupations (except farmers) (12.5%); sales and office occupations (9.7%); community and social services occupations (7.8%); education, training, and library occupations (6.8%); business and financial operations occupations (6.6%); service occupations (5.6%)
Roads and streets: Presidio Ter; Lake St; Pacific Ave; Arguello Blvd; 5th Ave; 3rd Ave; 2nd Ave.
Presidio Terrace neighborhood detailed profile
Richmond District neighborhood in San Francisco statistics: (Find on map)
Area: 2.148 square miles
Population: 64,037
Population density:
Median household income in 2021:
Median rent in in 2021:
Male vs Females
Median age
Housing prices:
Average estimated value of detached houses in 2021 (13.3% of all units):
Average estimated value of townhouses or other attached units in 2021 (13.0% of all units):
Average estimated value of housing units in 2-unit structures in 2021 (21.4% of all units):
Average estimated '21 value of housing units in 3-to-4-unit structures (19.7% of all units):
Average estimated '21 value of housing units in 5-or-more-unit structures (4.1% of all units):
Most popular occupations of males: management occupations (except farmers) (17.5%); computer and mathematical occupations (16.0%); sales and office occupations (12.5%); service occupations (10.2%); business and financial operations occupations (9.7%); arts, design, entertainment, sports, and media occupations (6.5%); architecture and engineering occupations (4.5%)
Most popular occupations of females: sales and office occupations (21.7%); management occupations (except farmers) (15.5%); service occupations (15.1%); business and financial operations occupations (10.7%); education, training, and library occupations (9.2%); healthcare practitioners and technical occupations (7.7%); arts, design, entertainment, sports, and media occupations (5.8%)
Highways in this neighborhood: State Hwy 1 (Park Presidio Blvd).
Roads and streets: Geary Blvd; Balboa St; Cabrillo St; Fulton St; Anza St; Clement St; California St; Arguello Blvd; 2nd Ave; 3rd Ave; 4th Ave; 5th Ave; 6th Ave; 7th Ave; 9th Ave; 8th Ave; 32nd Ave; 30th Ave; 29th Ave; 28th Ave; 26th Ave; 25th Ave; 27th Ave; 24th Ave; 23rd Ave; 22nd Ave; 21st Ave; 20th Ave; 33rd Ave; 18th Ave; 34th Ave; 10th Ave; 35th Ave; 16th Ave; 15th Ave; 36th Ave; 17th Ave; 11th Ave; 19th Ave; 38th Ave; 39th Ave; 12th Ave; 40th Ave; 14th Ave; 41st Ave; 42nd Ave; 43rd Ave; 44th Ave; Funston Ave; 37th Ave; 46th Ave; 47th Ave; 48th Ave; 45th Ave; 31st Ave; Cornwall St; Point Lobos Ave; la Playa St; Shore View Ave; Sutro Heights Ave; Tacoma St.
Richmond District neighborhood detailed profile
Area: 2.148 square miles
Population: 64,037
Population density:
| Richmond District: | 29,812 people per square mile |
| San Francisco: | 17,458 people per square mile |
Median household income in 2021:
| Richmond District: | $136,273 |
| San Francisco: | $121,826 |
Median rent in in 2021:
| Richmond District: | $2,084 |
| San Francisco: | $2,001 |
Male vs Females
| Males: | 30,759 |
| Females: | 33,277 |
Median age
| Males: | 39.8 years |
| Females: | 42.6 years |
Housing prices:
Average estimated value of detached houses in 2021 (13.3% of all units):
| Richmond District: | $1,725,321 |
| San Francisco: | $1,815,784 |
Average estimated value of townhouses or other attached units in 2021 (13.0% of all units):
| This neighborhood: | $1,575,384 |
| city: | $1,506,493 |
Average estimated value of housing units in 2-unit structures in 2021 (21.4% of all units):
| This neighborhood: | $987,361 |
| San Francisco: | $1,685,431 |
Average estimated '21 value of housing units in 3-to-4-unit structures (19.7% of all units):
| Richmond District: | $1,169,301 |
| city: | $1,521,789 |
Average estimated '21 value of housing units in 5-or-more-unit structures (4.1% of all units):
| Richmond District: | $1,709,757 |
| San Francisco: | $1,317,001 |
Most popular occupations of males: management occupations (except farmers) (17.5%); computer and mathematical occupations (16.0%); sales and office occupations (12.5%); service occupations (10.2%); business and financial operations occupations (9.7%); arts, design, entertainment, sports, and media occupations (6.5%); architecture and engineering occupations (4.5%)
Most popular occupations of females: sales and office occupations (21.7%); management occupations (except farmers) (15.5%); service occupations (15.1%); business and financial operations occupations (10.7%); education, training, and library occupations (9.2%); healthcare practitioners and technical occupations (7.7%); arts, design, entertainment, sports, and media occupations (5.8%)
Highways in this neighborhood: State Hwy 1 (Park Presidio Blvd).
Roads and streets: Geary Blvd; Balboa St; Cabrillo St; Fulton St; Anza St; Clement St; California St; Arguello Blvd; 2nd Ave; 3rd Ave; 4th Ave; 5th Ave; 6th Ave; 7th Ave; 9th Ave; 8th Ave; 32nd Ave; 30th Ave; 29th Ave; 28th Ave; 26th Ave; 25th Ave; 27th Ave; 24th Ave; 23rd Ave; 22nd Ave; 21st Ave; 20th Ave; 33rd Ave; 18th Ave; 34th Ave; 10th Ave; 35th Ave; 16th Ave; 15th Ave; 36th Ave; 17th Ave; 11th Ave; 19th Ave; 38th Ave; 39th Ave; 12th Ave; 40th Ave; 14th Ave; 41st Ave; 42nd Ave; 43rd Ave; 44th Ave; Funston Ave; 37th Ave; 46th Ave; 47th Ave; 48th Ave; 45th Ave; 31st Ave; Cornwall St; Point Lobos Ave; la Playa St; Shore View Ave; Sutro Heights Ave; Tacoma St.
Richmond District neighborhood detailed profile
Rincon Hill neighborhood in San Francisco statistics: (Find on map)
Area: 0.076 square miles
Limited-access highways (interstate or state) in this neighborhood: I- 80 (James Lick Fwy).
Roads and streets: Harrison St; Beale St; 1st St; Folsom St; Fremont St; Main St; Guy Pl; Spear St; Lansing St; Grote Pl; Zeno Pl; Elkhart St.
Rincon Hill neighborhood detailed profile
Russian Hill neighborhood in San Francisco statistics: (Find on map)
Area: 0.397 square miles
Population: 17,443
Population density:
Median household income in 2021:
Median rent in in 2021:
Male vs Females
Median age
Housing prices:
Average estimated value of housing units in 2-unit structures in 2021 (13.5% of all units):
Average estimated '21 value of housing units in 5-or-more-unit structures (13.2% of all units):
Most popular occupations of males: management occupations (except farmers) (22.6%); computer and mathematical occupations (13.9%); business and financial operations occupations (13.1%); sales and office occupations (11.5%); arts, design, entertainment, sports, and media occupations (7.2%); service occupations (6.9%); architecture and engineering occupations (5.4%)
Most popular occupations of females: sales and office occupations (33.3%); management occupations (except farmers) (23.3%); business and financial operations occupations (18.4%); life, physical, and social science occupations (6.2%); legal occupations (3.4%); healthcare practitioners and technical occupations (3.4%); architecture and engineering occupations (3.1%)
Roads and streets: Polk St; Larkin St; Lombard St; Hyde St; Greenwich St; Green St; Leavenworth St; Vallejo St; Filbert St; Union St; Jones St; Francisco St; Chestnut St; Bay St; Taylor St; N Point St; Beach St; Macondary Ln (Macondray Ln); Glover St; Culebra Ter; Valparaiso St; Bonita St; Havens St; Allen St; Russell St; Redfield Aly; Eastman Pl (Eastman St); Jansen St; Bret Harte Ter; Aladdin Ter; Florence St; Montclair Ter; Lurmont Ter; Grenard Ter; White St; Rockland St; Waldo Aly; Delgado Pl; Hastings Ter; Fallon Pl; Attridge Aly; Southard Pl; Bergen Aly (Bergen Pl); Warner Pl; Greenwich Ct; Black Pl; Hamlin St; Russian Hill Pl; Sharp Pl; Roach St; Moore Pl; Marion Pl; N View Ct; Alta Vista Ter; Eastman End.
Russian Hill neighborhood detailed profile
Area: 0.397 square miles
Population: 17,443
Population density:
| Russian Hill: | 43,909 people per square mile |
| San Francisco: | 17,458 people per square mile |
Median household income in 2021:
| Russian Hill: | $169,594 |
| San Francisco: | $121,826 |
Median rent in in 2021:
| Russian Hill: | $1,787 |
| San Francisco: | $2,001 |
Male vs Females
| Males: | 9,369 |
| Females: | 8,074 |
Median age
| Males: | 39.7 years |
| Females: | 48.5 years |
Housing prices:
Average estimated value of housing units in 2-unit structures in 2021 (13.5% of all units):
| This neighborhood: | $1,581,818 |
| San Francisco: | $1,685,431 |
Average estimated '21 value of housing units in 5-or-more-unit structures (13.2% of all units):
| Russian Hill: | $1,596,094 |
| San Francisco: | $1,317,001 |
Most popular occupations of males: management occupations (except farmers) (22.6%); computer and mathematical occupations (13.9%); business and financial operations occupations (13.1%); sales and office occupations (11.5%); arts, design, entertainment, sports, and media occupations (7.2%); service occupations (6.9%); architecture and engineering occupations (5.4%)
Most popular occupations of females: sales and office occupations (33.3%); management occupations (except farmers) (23.3%); business and financial operations occupations (18.4%); life, physical, and social science occupations (6.2%); legal occupations (3.4%); healthcare practitioners and technical occupations (3.4%); architecture and engineering occupations (3.1%)
Roads and streets: Polk St; Larkin St; Lombard St; Hyde St; Greenwich St; Green St; Leavenworth St; Vallejo St; Filbert St; Union St; Jones St; Francisco St; Chestnut St; Bay St; Taylor St; N Point St; Beach St; Macondary Ln (Macondray Ln); Glover St; Culebra Ter; Valparaiso St; Bonita St; Havens St; Allen St; Russell St; Redfield Aly; Eastman Pl (Eastman St); Jansen St; Bret Harte Ter; Aladdin Ter; Florence St; Montclair Ter; Lurmont Ter; Grenard Ter; White St; Rockland St; Waldo Aly; Delgado Pl; Hastings Ter; Fallon Pl; Attridge Aly; Southard Pl; Bergen Aly (Bergen Pl); Warner Pl; Greenwich Ct; Black Pl; Hamlin St; Russian Hill Pl; Sharp Pl; Roach St; Moore Pl; Marion Pl; N View Ct; Alta Vista Ter; Eastman End.
Russian Hill neighborhood detailed profile
SOMISSPO neighborhood in San Francisco statistics: (Find on map)
Area: 0.225 square miles
Population: 701
Population density:
Median household income in 2021:
Median rent in in 2021:
Male vs Females
Median age
Housing prices:
Average estimated value of detached houses in 2021 (13.5% of all units):
Average estimated value of townhouses or other attached units in 2021 (3.4% of all units):
Average estimated value of housing units in 2-unit structures in 2021 (7.4% of all units):
Average estimated '21 value of housing units in 3-to-4-unit structures (9.5% of all units):
Average estimated '21 value of housing units in 5-or-more-unit structures (22.5% of all units):
Most popular occupations of males: management occupations (except farmers) (21.2%); service occupations (16.0%); computer and mathematical occupations (14.8%); sales and office occupations (12.9%); business and financial operations occupations (10.7%); healthcare practitioners and technical occupations (4.9%); legal occupations (4.4%)
Most popular occupations of females: management occupations (except farmers) (26.6%); sales and office occupations (17.5%); service occupations (12.7%); business and financial operations occupations (12.4%); architecture and engineering occupations (7.4%); life, physical, and social science occupations (5.7%); healthcare practitioners and technical occupations (5.5%)
Limited-access highways (interstate or state) in this neighborhood: I- 80 (James Lick Fwy); US Hwy 101 (James Lick Fwy).
Highways in this neighborhood: US Hwy 101 (Central Fwy); US Hwy 101.
Roads and streets: 16th St; 17th St; Alameda St; Division St; 15th St; San Bruno Ave; Vermont St; Potrero Ave; Utah St; Bryant St; Florida St; Treat Ave; Alabama St; Brannan St; Kansas St; Hampshire St; Henry Adams St; Harrison St; Rhode Island St; Dore St; 10th St; 9th St; York St.
SOMISSPO neighborhood detailed profile
Area: 0.225 square miles
Population: 701
Population density:
| SOMISSPO: | 3,118 people per square mile |
| San Francisco: | 17,458 people per square mile |
Median household income in 2021:
| SOMISSPO: | $143,129 |
| San Francisco: | $121,826 |
Median rent in in 2021:
| SOMISSPO: | $2,696 |
| San Francisco: | $2,001 |
Male vs Females
| Males: | 445 |
| Females: | 256 |
Median age
| Males: | 37.5 years |
| Females: | 35.1 years |
Housing prices:
Average estimated value of detached houses in 2021 (13.5% of all units):
| SOMISSPO: | $18,951,910 |
| San Francisco: | $1,815,784 |
Average estimated value of townhouses or other attached units in 2021 (3.4% of all units):
| This neighborhood: | $1,049,923 |
| city: | $1,506,493 |
Average estimated value of housing units in 2-unit structures in 2021 (7.4% of all units):
| This neighborhood: | $1,102,458 |
| San Francisco: | $1,685,431 |
Average estimated '21 value of housing units in 3-to-4-unit structures (9.5% of all units):
| SOMISSPO: | $10,239,268 |
| city: | $1,521,789 |
Average estimated '21 value of housing units in 5-or-more-unit structures (22.5% of all units):
| SOMISSPO: | $969,756 |
| San Francisco: | $1,317,001 |
Most popular occupations of males: management occupations (except farmers) (21.2%); service occupations (16.0%); computer and mathematical occupations (14.8%); sales and office occupations (12.9%); business and financial operations occupations (10.7%); healthcare practitioners and technical occupations (4.9%); legal occupations (4.4%)
Most popular occupations of females: management occupations (except farmers) (26.6%); sales and office occupations (17.5%); service occupations (12.7%); business and financial operations occupations (12.4%); architecture and engineering occupations (7.4%); life, physical, and social science occupations (5.7%); healthcare practitioners and technical occupations (5.5%)
Limited-access highways (interstate or state) in this neighborhood: I- 80 (James Lick Fwy); US Hwy 101 (James Lick Fwy).
Highways in this neighborhood: US Hwy 101 (Central Fwy); US Hwy 101.
Roads and streets: 16th St; 17th St; Alameda St; Division St; 15th St; San Bruno Ave; Vermont St; Potrero Ave; Utah St; Bryant St; Florida St; Treat Ave; Alabama St; Brannan St; Kansas St; Hampshire St; Henry Adams St; Harrison St; Rhode Island St; Dore St; 10th St; 9th St; York St.
SOMISSPO neighborhood detailed profile
Saint Francis Wood neighborhood in San Francisco statistics: (Find on map)
Area: 0.171 square miles
Population: 1,188
Population density:
Median household income in 2021:
Median rent in in 2021:
Male vs Females
Median age
Housing prices:
Average estimated value of detached houses in 2021 (97.6% of all units):
Average estimated value of townhouses or other attached units in 2021 (13.4% of all units):
Average estimated '21 value of housing units in 5-or-more-unit structures (22.6% of all units):
Most popular occupations of males: computer and mathematical occupations (29.4%); sales and office occupations (16.8%); management occupations (except farmers) (15.6%); architecture and engineering occupations (14.6%); legal occupations (6.9%); business and financial operations occupations (4.0%); service occupations (3.0%)
Most popular occupations of females: management occupations (except farmers) (35.0%); sales and office occupations (18.5%); computer and mathematical occupations (13.4%); business and financial operations occupations (7.2%); healthcare practitioners and technical occupations (6.9%); education, training, and library occupations (6.3%); arts, design, entertainment, sports, and media occupations (6.1%)
Roads and streets: Portola Dr; Monterey Blvd; San Anselmo Ave; St Francis Blvd; Santa Clara Ave; Santa Paula Ave; Santa Ana Ave; San Benito Way; Santa Monica Way; Terrace Dr; Junipero Serra Blvd; San Leandro Way; Yerba Buena Ave; Saint Francis Blvd; San Fernando Way; San Buenaventura Way; San Lorenzo Way; San Pablo Ave; Terrace Walk; San Rafael Way; Portal Path.
Saint Francis Wood neighborhood detailed profile
Area: 0.171 square miles
Population: 1,188
Population density:
| Saint Francis Wood: | 6,967 people per square mile |
| San Francisco: | 17,458 people per square mile |
Median household income in 2021:
| Saint Francis Wood: | $183,099 |
| San Francisco: | $121,826 |
Median rent in in 2021:
| Saint Francis Wood: | $3,501 |
| San Francisco: | $2,001 |
Male vs Females
| Males: | 649 |
| Females: | 538 |
Median age
| Males: | 48.5 years |
| Females: | 45.9 years |
Housing prices:
Average estimated value of detached houses in 2021 (97.6% of all units):
| Saint Francis Wood: | $2,342,734 |
| San Francisco: | $1,815,784 |
Average estimated value of townhouses or other attached units in 2021 (13.4% of all units):
| This neighborhood: | $1,711,927 |
| city: | $1,506,493 |
Average estimated '21 value of housing units in 5-or-more-unit structures (22.6% of all units):
| Saint Francis Wood: | $843,361 |
| San Francisco: | $1,317,001 |
Most popular occupations of males: computer and mathematical occupations (29.4%); sales and office occupations (16.8%); management occupations (except farmers) (15.6%); architecture and engineering occupations (14.6%); legal occupations (6.9%); business and financial operations occupations (4.0%); service occupations (3.0%)
Most popular occupations of females: management occupations (except farmers) (35.0%); sales and office occupations (18.5%); computer and mathematical occupations (13.4%); business and financial operations occupations (7.2%); healthcare practitioners and technical occupations (6.9%); education, training, and library occupations (6.3%); arts, design, entertainment, sports, and media occupations (6.1%)
Roads and streets: Portola Dr; Monterey Blvd; San Anselmo Ave; St Francis Blvd; Santa Clara Ave; Santa Paula Ave; Santa Ana Ave; San Benito Way; Santa Monica Way; Terrace Dr; Junipero Serra Blvd; San Leandro Way; Yerba Buena Ave; Saint Francis Blvd; San Fernando Way; San Buenaventura Way; San Lorenzo Way; San Pablo Ave; Terrace Walk; San Rafael Way; Portal Path.
Saint Francis Wood neighborhood detailed profile
Sea Cliff neighborhood in San Francisco statistics: (Find on map)
Area: 0.143 square miles
Population: 788
Population density:
Median household income in 2021:
Median rent in in 2021:
Male vs Females
Median age
Housing prices:
Average estimated value of detached houses in 2021 (73.4% of all units):
Average estimated value of townhouses or other attached units in 2021 (9.6% of all units):
Most popular occupations of males: management occupations (except farmers) (31.6%); sales and office occupations (18.1%); healthcare practitioners and technical occupations (11.3%); business and financial operations occupations (9.2%); service occupations (7.1%); arts, design, entertainment, sports, and media occupations (6.0%); education, training, and library occupations (4.4%)
Most popular occupations of females: management occupations (except farmers) (34.2%); healthcare practitioners and technical occupations (16.2%); business and financial operations occupations (15.1%); sales and office occupations (14.0%); education, training, and library occupations (10.1%); legal occupations (2.6%); service occupations (2.3%)
Roads and streets: el Camino del Mar; Lake St; Sea Cliff Ave; California St; 25th Ave; 28th Ave; 30th Ave; 29th Ave; McLaren Ave; Easement; 26th Ave; Sea View Ter (Seaview Ter); 27th Ave; Scenic Way; 32nd Ave; 31st Ave.
Sea Cliff neighborhood detailed profile
Area: 0.143 square miles
Population: 788
Population density:
| Sea Cliff: | 5,511 people per square mile |
| San Francisco: | 17,458 people per square mile |
Median household income in 2021:
| Sea Cliff: | $191,582 |
| San Francisco: | $121,826 |
Median rent in in 2021:
| Sea Cliff: | $1,481 |
| San Francisco: | $2,001 |
Male vs Females
| Males: | 365 |
| Females: | 423 |
Median age
| Males: | 41.8 years |
| Females: | 41.6 years |
Housing prices:
Average estimated value of detached houses in 2021 (73.4% of all units):
| Sea Cliff: | $4,929,789 |
| San Francisco: | $1,815,784 |
Average estimated value of townhouses or other attached units in 2021 (9.6% of all units):
| This neighborhood: | $1,765,000 |
| city: | $1,506,493 |
Most popular occupations of males: management occupations (except farmers) (31.6%); sales and office occupations (18.1%); healthcare practitioners and technical occupations (11.3%); business and financial operations occupations (9.2%); service occupations (7.1%); arts, design, entertainment, sports, and media occupations (6.0%); education, training, and library occupations (4.4%)
Most popular occupations of females: management occupations (except farmers) (34.2%); healthcare practitioners and technical occupations (16.2%); business and financial operations occupations (15.1%); sales and office occupations (14.0%); education, training, and library occupations (10.1%); legal occupations (2.6%); service occupations (2.3%)
Roads and streets: el Camino del Mar; Lake St; Sea Cliff Ave; California St; 25th Ave; 28th Ave; 30th Ave; 29th Ave; McLaren Ave; Easement; 26th Ave; Sea View Ter (Seaview Ter); 27th Ave; Scenic Way; 32nd Ave; 31st Ave.
Sea Cliff neighborhood detailed profile
Sherwood Forest neighborhood in San Francisco statistics: (Find on map)
Area: 0.155 square miles
Population: 1,787
Population density:
Median household income in 2021:
Median rent in in 2021:
Male vs Females
Median age
Housing prices:
Average estimated value of detached houses in 2021 (65.8% of all units):
Average estimated value of townhouses or other attached units in 2021 (43.0% of all units):
Most popular occupations of males: computer and mathematical occupations (26.4%); management occupations (except farmers) (14.3%); architecture and engineering occupations (14.3%); sales and office occupations (13.4%); healthcare practitioners and technical occupations (9.3%); business and financial operations occupations (5.5%); education, training, and library occupations (4.7%)
Most popular occupations of females: management occupations (except farmers) (29.8%); sales and office occupations (20.4%); service occupations (12.3%); education, training, and library occupations (11.0%); healthcare practitioners and technical occupations (9.6%); business and financial operations occupations (5.6%); arts, design, entertainment, sports, and media occupations (4.7%)
Roads and streets: Lansdale Ave; Dalewood Way; Robinhood Dr; Casitas Ave; Myra Way; Miraloma Dr; St Croix Dr; Molimo Dr; Bengal Aly; Ludlow Aly; Juanita Way; Coventry Ln.
Sherwood Forest neighborhood detailed profile
Area: 0.155 square miles
Population: 1,787
Population density:
| Sherwood Forest: | 11,547 people per square mile |
| San Francisco: | 17,458 people per square mile |
Median household income in 2021:
| Sherwood Forest: | $179,764 |
| San Francisco: | $121,826 |
Median rent in in 2021:
| Sherwood Forest: | $3,501 |
| San Francisco: | $2,001 |
Male vs Females
| Males: | 1,014 |
| Females: | 772 |
Median age
| Males: | 44.0 years |
| Females: | 48.0 years |
Housing prices:
Average estimated value of detached houses in 2021 (65.8% of all units):
| Sherwood Forest: | $1,395,855 |
| San Francisco: | $1,815,784 |
Average estimated value of townhouses or other attached units in 2021 (43.0% of all units):
| This neighborhood: | $1,310,005 |
| city: | $1,506,493 |
Most popular occupations of males: computer and mathematical occupations (26.4%); management occupations (except farmers) (14.3%); architecture and engineering occupations (14.3%); sales and office occupations (13.4%); healthcare practitioners and technical occupations (9.3%); business and financial operations occupations (5.5%); education, training, and library occupations (4.7%)
Most popular occupations of females: management occupations (except farmers) (29.8%); sales and office occupations (20.4%); service occupations (12.3%); education, training, and library occupations (11.0%); healthcare practitioners and technical occupations (9.6%); business and financial operations occupations (5.6%); arts, design, entertainment, sports, and media occupations (4.7%)
Roads and streets: Lansdale Ave; Dalewood Way; Robinhood Dr; Casitas Ave; Myra Way; Miraloma Dr; St Croix Dr; Molimo Dr; Bengal Aly; Ludlow Aly; Juanita Way; Coventry Ln.
Sherwood Forest neighborhood detailed profile
Showplace Square neighborhood in San Francisco statistics: (Find on map)
Area: 0.480 square miles
Population: 5,852
Population density:
Median household income in 2021:
Median rent in in 2021:
Male vs Females
Median age
Housing prices:
Average estimated value of detached houses in 2021 (6.4% of all units):
Average estimated value of townhouses or other attached units in 2021 (6.7% of all units):
Average estimated value of housing units in 2-unit structures in 2021 (40.6% of all units):
Average estimated '21 value of housing units in 3-to-4-unit structures (12.9% of all units):
Average estimated '21 value of housing units in 5-or-more-unit structures (13.0% of all units):
Most popular occupations of males: management occupations (except farmers) (20.1%); computer and mathematical occupations (19.4%); arts, design, entertainment, sports, and media occupations (17.0%); architecture and engineering occupations (9.9%); sales and office occupations (9.2%); life, physical, and social science occupations (4.9%); education, training, and library occupations (4.6%)
Most popular occupations of females: management occupations (except farmers) (32.0%); computer and mathematical occupations (15.7%); arts, design, entertainment, sports, and media occupations (14.2%); life, physical, and social science occupations (11.1%); healthcare practitioners and technical occupations (8.5%); business and financial operations occupations (7.7%); architecture and engineering occupations (4.4%)
Limited-access highways (interstate or state) in this neighborhood: I- 280; US Hwy 101 (James Lick Fwy); I- 80 (James Lick Fwy).
Roads and streets: Mariposa St; 7th St; 17th St; 16th St; de Haro St; Carolina St; 6th St; Channel St; Vermont St; Townsend St; Rhode Island St; King St; 18th St; Berry St; 8th St; Kansas St; Brannan St; 15th St; Missouri St; Connecticut St; Arkansas St; Division St; Irwin St; Alameda St; Hooper St; Hubbell St; Mississippi St; Texas St; Henry Adams St; Wisconsin St; Daggett St; Gilbert St; Butte Pl; San Bruno Ave; 5th St.
Railroad features: Union Pacific RR.
Showplace Square neighborhood detailed profile
Area: 0.480 square miles
Population: 5,852
Population density:
| Showplace Square (Showplace Sq): | 12,202 people per square mile |
| San Francisco: | 17,458 people per square mile |
Median household income in 2021:
| Showplace Square (Showplace Sq): | $182,769 |
| San Francisco: | $121,826 |
Median rent in in 2021:
| Showplace Square (Showplace Sq): | $3,007 |
| San Francisco: | $2,001 |
Male vs Females
| Males: | 3,427 |
| Females: | 2,424 |
Median age
| Males: | 36.0 years |
| Females: | 34.9 years |
Housing prices:
Average estimated value of detached houses in 2021 (6.4% of all units):
| Showplace Square (Showplace Sq): | $8,074,955 |
| San Francisco: | $1,815,784 |
Average estimated value of townhouses or other attached units in 2021 (6.7% of all units):
| This neighborhood: | $1,500,763 |
| city: | $1,506,493 |
Average estimated value of housing units in 2-unit structures in 2021 (40.6% of all units):
| This neighborhood: | $1,715,161 |
| San Francisco: | $1,685,431 |
Average estimated '21 value of housing units in 3-to-4-unit structures (12.9% of all units):
| Showplace Square (Showplace Sq): | $1,110,730 |
| city: | $1,521,789 |
Average estimated '21 value of housing units in 5-or-more-unit structures (13.0% of all units):
| Showplace Square (Showplace Sq): | $969,756 |
| San Francisco: | $1,317,001 |
Most popular occupations of males: management occupations (except farmers) (20.1%); computer and mathematical occupations (19.4%); arts, design, entertainment, sports, and media occupations (17.0%); architecture and engineering occupations (9.9%); sales and office occupations (9.2%); life, physical, and social science occupations (4.9%); education, training, and library occupations (4.6%)
Most popular occupations of females: management occupations (except farmers) (32.0%); computer and mathematical occupations (15.7%); arts, design, entertainment, sports, and media occupations (14.2%); life, physical, and social science occupations (11.1%); healthcare practitioners and technical occupations (8.5%); business and financial operations occupations (7.7%); architecture and engineering occupations (4.4%)
Limited-access highways (interstate or state) in this neighborhood: I- 280; US Hwy 101 (James Lick Fwy); I- 80 (James Lick Fwy).
Roads and streets: Mariposa St; 7th St; 17th St; 16th St; de Haro St; Carolina St; 6th St; Channel St; Vermont St; Townsend St; Rhode Island St; King St; 18th St; Berry St; 8th St; Kansas St; Brannan St; 15th St; Missouri St; Connecticut St; Arkansas St; Division St; Irwin St; Alameda St; Hooper St; Hubbell St; Mississippi St; Texas St; Henry Adams St; Wisconsin St; Daggett St; Gilbert St; Butte Pl; San Bruno Ave; 5th St.
Railroad features: Union Pacific RR.
Showplace Square neighborhood detailed profile
Silver Terrace neighborhood in San Francisco statistics: (Find on map)
Area: 0.385 square miles
Population: 4,125
Population density:
Median household income in 2021:
Median rent in in 2021:
Male vs Females
Median age
Housing prices:
Average estimated value of detached houses in 2021 (48.6% of all units):
Average estimated value of townhouses or other attached units in 2021 (39.6% of all units):
Most popular occupations of males: service occupations (25.8%); transportation occupations (14.2%); sales and office occupations (11.1%); management occupations (except farmers) (10.6%); construction, extraction, and maintenance occupations (9.1%); computer and mathematical occupations (6.2%); material moving occupations (6.1%)
Most popular occupations of females: service occupations (30.9%); sales and office occupations (26.9%); management occupations (except farmers) (9.0%); business and financial operations occupations (8.5%); material moving occupations (7.5%); life, physical, and social science occupations (4.1%); production occupations (4.1%)
Limited-access highways (interstate or state) in this neighborhood: I- 280; US Hwy 101 (James Lick Fwy).
Roads and streets: Silver Ave; Bridgeview Dr; Thornton Ave; Bay Shore Blvd; Quint St; Topeka Ave; Quesada Ave; Oakdale Ave; Palou Ave; Carroll Ave; Bayview Cir; Phelps St; Selby St; Revere Ave; Williams Ave; Elmira St; Scotia Ave; Augusta St; Waterville St; Maddux Ave; Ledyard St; Venus St; Apollo St; Thomas Ave; Charter Oak Ave; Rankin St; Donner Ave; Santa Fe Ave; Bancroft Ave; Mercury St; Conkling St; Robblee Ave; Diana St; Neptune St; Reddy St; Whitecliff Way; Vesta St; Boutwell St; Silverview Dr; Tampa Ln; Drummond Aly; Dunshee St; Helena St; Thorne Way; Vistaview Ct; Clearview Ct; Egbert Ave; Dickinson St (Steuben St).
Railroad features: Union Pacific RR.
Silver Terrace neighborhood detailed profile
Area: 0.385 square miles
Population: 4,125
Population density:
| Silver Terrace: | 10,712 people per square mile |
| San Francisco: | 17,458 people per square mile |
Median household income in 2021:
| Silver Terrace: | $73,355 |
| San Francisco: | $121,826 |
Median rent in in 2021:
| Silver Terrace: | $1,645 |
| San Francisco: | $2,001 |
Male vs Females
| Males: | 2,221 |
| Females: | 1,904 |
Median age
| Males: | 39.0 years |
| Females: | 44.1 years |
Housing prices:
Average estimated value of detached houses in 2021 (48.6% of all units):
| Silver Terrace: | $1,138,179 |
| San Francisco: | $1,815,784 |
Average estimated value of townhouses or other attached units in 2021 (39.6% of all units):
| This neighborhood: | $2,065,049 |
| city: | $1,506,493 |
Most popular occupations of males: service occupations (25.8%); transportation occupations (14.2%); sales and office occupations (11.1%); management occupations (except farmers) (10.6%); construction, extraction, and maintenance occupations (9.1%); computer and mathematical occupations (6.2%); material moving occupations (6.1%)
Most popular occupations of females: service occupations (30.9%); sales and office occupations (26.9%); management occupations (except farmers) (9.0%); business and financial operations occupations (8.5%); material moving occupations (7.5%); life, physical, and social science occupations (4.1%); production occupations (4.1%)
Limited-access highways (interstate or state) in this neighborhood: I- 280; US Hwy 101 (James Lick Fwy).
Roads and streets: Silver Ave; Bridgeview Dr; Thornton Ave; Bay Shore Blvd; Quint St; Topeka Ave; Quesada Ave; Oakdale Ave; Palou Ave; Carroll Ave; Bayview Cir; Phelps St; Selby St; Revere Ave; Williams Ave; Elmira St; Scotia Ave; Augusta St; Waterville St; Maddux Ave; Ledyard St; Venus St; Apollo St; Thomas Ave; Charter Oak Ave; Rankin St; Donner Ave; Santa Fe Ave; Bancroft Ave; Mercury St; Conkling St; Robblee Ave; Diana St; Neptune St; Reddy St; Whitecliff Way; Vesta St; Boutwell St; Silverview Dr; Tampa Ln; Drummond Aly; Dunshee St; Helena St; Thorne Way; Vistaview Ct; Clearview Ct; Egbert Ave; Dickinson St (Steuben St).
Railroad features: Union Pacific RR.
Silver Terrace neighborhood detailed profile
South Basin neighborhood in San Francisco statistics: (Find on map)
Area: 1.716 square miles
Population: 20,020
Population density:
Median household income in 2021:
Median rent in in 2021:
Male vs Females
Median age
Housing prices:
Average estimated value of detached houses in 2021 (52.4% of all units):
Average estimated value of townhouses or other attached units in 2021 (21.1% of all units):
Most popular occupations of males: service occupations (24.6%); management occupations (except farmers) (18.5%); sales and office occupations (13.5%); construction, extraction, and maintenance occupations (8.9%); production occupations (8.4%); transportation occupations (6.5%); arts, design, entertainment, sports, and media occupations (4.8%)
Most popular occupations of females: service occupations (27.9%); sales and office occupations (24.1%); management occupations (except farmers) (14.8%); business and financial operations occupations (12.8%); education, training, and library occupations (6.4%); computer and mathematical occupations (3.6%); production occupations (3.4%)
Roads and streets: Ingalls St; Griffith St; Crisp Rd; J St; Spear Ave; Hawes St; Shafter Ave; Revere Ave; Thomas Ave; Underwood Ave; H St; Palou Ave; Fitch St (Arelious Walker Dr); Hussey St; Jennings St; Quesada Ave; Manseau St; Van Dyke Ave; Egbert Ave; I St; Bancroft Ave; Fitzgerald Ave; Carroll Ave; Morrell St; Navy Rd; Yosemite Ave; Kirkwood Ave; Oakdale Ave; Cameron Way; Wallace Ave; Jerrold Ave; Cochrane St; Mahan St; 6th Ave; R St; Nichols Way; E St; Earl St; Keith St; la Salle Ave; Kiska Rd; Blandy St; Donner Ave; Innes Ave; C St; Donahue St; Fischer Ave; Friedell St; Nautilus Ct; Hill Dr; Baldwin Ct; Coleman St; Marlin Ct; Reardon Rd; Horn Ave; Albatross Ct; Dolphin Ct; D St; George Ct; Nimitz Ave; Doublerock St; Atoll Cir; Whitfield Ct; Oaksdale Ave; Coral Ct; Beatrice Ln.
Other features: Armstrong Ave.
South Basin neighborhood detailed profile
Area: 1.716 square miles
Population: 20,020
Population density:
| South Basin: | 11,668 people per square mile |
| San Francisco: | 17,458 people per square mile |
Median household income in 2021:
| South Basin: | $82,449 |
| San Francisco: | $121,826 |
Median rent in in 2021:
| South Basin: | $1,569 |
| San Francisco: | $2,001 |
Male vs Females
| Males: | 9,917 |
| Females: | 10,102 |
Median age
| Males: | 38.1 years |
| Females: | 39.4 years |
Housing prices:
Average estimated value of detached houses in 2021 (52.4% of all units):
| South Basin: | $858,602 |
| San Francisco: | $1,815,784 |
Average estimated value of townhouses or other attached units in 2021 (21.1% of all units):
| This neighborhood: | $759,230 |
| city: | $1,506,493 |
Most popular occupations of males: service occupations (24.6%); management occupations (except farmers) (18.5%); sales and office occupations (13.5%); construction, extraction, and maintenance occupations (8.9%); production occupations (8.4%); transportation occupations (6.5%); arts, design, entertainment, sports, and media occupations (4.8%)
Most popular occupations of females: service occupations (27.9%); sales and office occupations (24.1%); management occupations (except farmers) (14.8%); business and financial operations occupations (12.8%); education, training, and library occupations (6.4%); computer and mathematical occupations (3.6%); production occupations (3.4%)
Roads and streets: Ingalls St; Griffith St; Crisp Rd; J St; Spear Ave; Hawes St; Shafter Ave; Revere Ave; Thomas Ave; Underwood Ave; H St; Palou Ave; Fitch St (Arelious Walker Dr); Hussey St; Jennings St; Quesada Ave; Manseau St; Van Dyke Ave; Egbert Ave; I St; Bancroft Ave; Fitzgerald Ave; Carroll Ave; Morrell St; Navy Rd; Yosemite Ave; Kirkwood Ave; Oakdale Ave; Cameron Way; Wallace Ave; Jerrold Ave; Cochrane St; Mahan St; 6th Ave; R St; Nichols Way; E St; Earl St; Keith St; la Salle Ave; Kiska Rd; Blandy St; Donner Ave; Innes Ave; C St; Donahue St; Fischer Ave; Friedell St; Nautilus Ct; Hill Dr; Baldwin Ct; Coleman St; Marlin Ct; Reardon Rd; Horn Ave; Albatross Ct; Dolphin Ct; D St; George Ct; Nimitz Ave; Doublerock St; Atoll Cir; Whitfield Ct; Oaksdale Ave; Coral Ct; Beatrice Ln.
Other features: Armstrong Ave.
South Basin neighborhood detailed profile
South Beach neighborhood in San Francisco statistics: (Find on map)
Area: 0.386 square miles
Population: 3,888
Population density:
Median household income in 2021:
Median rent in in 2021:
Male vs Females
Median age
Most popular occupations of males: service occupations (45.5%); management occupations (except farmers) (28.2%); computer and mathematical occupations (20.6%); legal occupations (2.0%); arts, design, entertainment, sports, and media occupations (1.1%); business and financial operations occupations (1.0%)
Most popular occupations of females: sales and office occupations (34.4%); service occupations (28.0%); healthcare practitioners and technical occupations (13.6%); business and financial operations occupations (8.4%); computer and mathematical occupations (7.7%); education, training, and library occupations (4.0%); management occupations (except farmers) (1.5%)
Limited-access highways (interstate or state) in this neighborhood: I- 80 (James Lick Fwy).
Roads and streets: The Embarcadero; King St; Main St; Brannan St; Spear St; Bryant St; Townsend St; Delancey St (1st St); 3rd St; Harrison St; 2nd St; Willie Mays Plz (Berry St); Beale St; Mission St; Howard St; Steuart St; Folsom St; Stanford St; Colin P Kelly Jr St; Bayside Village Pl; Rincon Aly (Rincon St); Delancy St; Federal St; Clarence Pl; Bryant Ln.
South Beach neighborhood detailed profile
Area: 0.386 square miles
Population: 3,888
Population density:
| South Beach: | 10,084 people per square mile |
| San Francisco: | 17,458 people per square mile |
Median household income in 2021:
| South Beach: | $173,903 |
| San Francisco: | $121,826 |
Median rent in in 2021:
| South Beach: | $2,338 |
| San Francisco: | $2,001 |
Male vs Females
| Males: | 2,509 |
| Females: | 1,379 |
Median age
| Males: | 35.2 years |
| Females: | 34.0 years |
Most popular occupations of males: service occupations (45.5%); management occupations (except farmers) (28.2%); computer and mathematical occupations (20.6%); legal occupations (2.0%); arts, design, entertainment, sports, and media occupations (1.1%); business and financial operations occupations (1.0%)
Most popular occupations of females: sales and office occupations (34.4%); service occupations (28.0%); healthcare practitioners and technical occupations (13.6%); business and financial operations occupations (8.4%); computer and mathematical occupations (7.7%); education, training, and library occupations (4.0%); management occupations (except farmers) (1.5%)
Limited-access highways (interstate or state) in this neighborhood: I- 80 (James Lick Fwy).
Roads and streets: The Embarcadero; King St; Main St; Brannan St; Spear St; Bryant St; Townsend St; Delancey St (1st St); 3rd St; Harrison St; 2nd St; Willie Mays Plz (Berry St); Beale St; Mission St; Howard St; Steuart St; Folsom St; Stanford St; Colin P Kelly Jr St; Bayside Village Pl; Rincon Aly (Rincon St); Delancy St; Federal St; Clarence Pl; Bryant Ln.
South Beach neighborhood detailed profile
South Of Market neighborhood in San Francisco statistics: (Find on map)
Area: 0.635 square miles
Population: 4,316
Population density:
Median household income in 2021:
Median rent in in 2021:
Male vs Females
Median age
Average estimated '21 value of housing units in 5-or-more-unit structures (16.0% of all units):
Most popular occupations of males: computer and mathematical occupations (23.3%); sales and office occupations (12.5%); service occupations (11.9%); management occupations (except farmers) (11.2%); arts, design, entertainment, sports, and media occupations (6.3%); business and financial operations occupations (5.7%); architecture and engineering occupations (5.2%)
Most popular occupations of females: management occupations (except farmers) (21.4%); sales and office occupations (17.4%); business and financial operations occupations (13.1%); service occupations (11.7%); life, physical, and social science occupations (7.1%); computer and mathematical occupations (6.7%); arts, design, entertainment, sports, and media occupations (6.1%)
Limited-access highways (interstate or state) in this neighborhood: I- 80 (James Lick Fwy).
Highways in this neighborhood: US Hwy 101 (S Van Ness Ave); US Hwy 101.
Roads and streets: Mission St; 13th St; Howard St; Folsom St; Harrison St; Natoma St; Minna St; 9th St; 10th St; Central Fwy; 8th St; 11th St; 6th St; Jessie St; Stevenson St; 7th St; 12th St; Division St; Dore St; Bryant St; Harriet St; Langton St; Otis St; Russ St; Clementina St; Brannan St; Kissling St; McCoppin St; Norfolk St; Lafayette St; Tehama St; Rausch St; Columbia Sq (Columbia Square St); Sherman St; Mary St; Moss St; Ringold St; Washburn St; Grace St; Plum St; Sheridan St; Colton St; Shipley St; San Bruno Ave; Brady St; Gough St; Juniper St; Sumner St; Isis St; Chesley St; Cleveland St; McLea Ct; Hallam St; Rodgers St; Gordon St; Berwick Pl; Julia St; Laskie St; Heron St; Alameda St; Mint St; Bernice St; Boyd St; Converse St; Falmouth St; Merlin St; Burns Pl; Oak Grove St; Morris St; Brush Pl; Utah St; Homer St; Potrero Ave; Colusa Pl; Duboce Ave; Panton Aly; Chase Ct; Eldridge St.
South Of Market neighborhood detailed profile
Area: 0.635 square miles
Population: 4,316
Population density:
| South Of Market (SOMA): | 6,794 people per square mile |
| San Francisco: | 17,458 people per square mile |
Median household income in 2021:
| South Of Market (SOMA): | $145,318 |
| San Francisco: | $121,826 |
Median rent in in 2021:
| South Of Market (SOMA): | $2,628 |
| San Francisco: | $2,001 |
Male vs Females
| Males: | 2,642 |
| Females: | 1,673 |
Median age
| Males: | 36.0 years |
| Females: | 31.4 years |
Average estimated '21 value of housing units in 5-or-more-unit structures (16.0% of all units):
| South Of Market (SOMA): | $969,756 |
| San Francisco: | $1,317,001 |
Most popular occupations of males: computer and mathematical occupations (23.3%); sales and office occupations (12.5%); service occupations (11.9%); management occupations (except farmers) (11.2%); arts, design, entertainment, sports, and media occupations (6.3%); business and financial operations occupations (5.7%); architecture and engineering occupations (5.2%)
Most popular occupations of females: management occupations (except farmers) (21.4%); sales and office occupations (17.4%); business and financial operations occupations (13.1%); service occupations (11.7%); life, physical, and social science occupations (7.1%); computer and mathematical occupations (6.7%); arts, design, entertainment, sports, and media occupations (6.1%)
Limited-access highways (interstate or state) in this neighborhood: I- 80 (James Lick Fwy).
Highways in this neighborhood: US Hwy 101 (S Van Ness Ave); US Hwy 101.
Roads and streets: Mission St; 13th St; Howard St; Folsom St; Harrison St; Natoma St; Minna St; 9th St; 10th St; Central Fwy; 8th St; 11th St; 6th St; Jessie St; Stevenson St; 7th St; 12th St; Division St; Dore St; Bryant St; Harriet St; Langton St; Otis St; Russ St; Clementina St; Brannan St; Kissling St; McCoppin St; Norfolk St; Lafayette St; Tehama St; Rausch St; Columbia Sq (Columbia Square St); Sherman St; Mary St; Moss St; Ringold St; Washburn St; Grace St; Plum St; Sheridan St; Colton St; Shipley St; San Bruno Ave; Brady St; Gough St; Juniper St; Sumner St; Isis St; Chesley St; Cleveland St; McLea Ct; Hallam St; Rodgers St; Gordon St; Berwick Pl; Julia St; Laskie St; Heron St; Alameda St; Mint St; Bernice St; Boyd St; Converse St; Falmouth St; Merlin St; Burns Pl; Oak Grove St; Morris St; Brush Pl; Utah St; Homer St; Potrero Ave; Colusa Pl; Duboce Ave; Panton Aly; Chase Ct; Eldridge St.
South Of Market neighborhood detailed profile
South Park neighborhood in San Francisco statistics: (Find on map)
Area: 0.011 square miles
Roads and streets: S Park Ave; Jack London Aly (Center St).
South Park neighborhood detailed profile
Area: 0.011 square miles
Roads and streets: S Park Ave; Jack London Aly (Center St).
South Park neighborhood detailed profile
St Marys Square neighborhood in San Francisco statistics: (Find on map)
Area: 0.022 square miles
Population: 440
Population density:
Median household income in 2021:
Median rent in in 2021:
Male vs Females
Median age
Housing prices:
Average estimated value of detached houses in 2021 (34.4% of all units):
Average estimated value of townhouses or other attached units in 2021 (28.2% of all units):
Average estimated value of housing units in 2-unit structures in 2021 (10.7% of all units):
Average estimated '21 value of housing units in 3-to-4-unit structures (4.6% of all units):
Most popular occupations of males: sales and office occupations (27.9%); service occupations (21.7%); management occupations (except farmers) (13.3%); construction, extraction, and maintenance occupations (11.3%); business and financial operations occupations (10.2%); architecture and engineering occupations (8.7%); computer and mathematical occupations (4.3%)
Most popular occupations of females: sales and office occupations (31.6%); service occupations (29.0%); healthcare practitioners and technical occupations (10.2%); education, training, and library occupations (7.7%); material moving occupations (7.5%); computer and mathematical occupations (5.4%); business and financial operations occupations (5.0%)
St Marys Square neighborhood detailed profile
Area: 0.022 square miles
Population: 440
Population density:
| St Marys Square: | 19,742 people per square mile |
| San Francisco: | 17,458 people per square mile |
Median household income in 2021:
| St Marys Square: | $98,824 |
| San Francisco: | $121,826 |
Median rent in in 2021:
| St Marys Square: | $1,273 |
| San Francisco: | $2,001 |
Male vs Females
| Males: | 257 |
| Females: | 182 |
Median age
| Males: | 43.0 years |
| Females: | 48.4 years |
Housing prices:
Average estimated value of detached houses in 2021 (34.4% of all units):
| St Marys Square: | $2,324,152 |
| San Francisco: | $1,815,784 |
Average estimated value of townhouses or other attached units in 2021 (28.2% of all units):
| This neighborhood: | $840,974 |
| city: | $1,506,493 |
Average estimated value of housing units in 2-unit structures in 2021 (10.7% of all units):
| This neighborhood: | $1,247,672 |
| San Francisco: | $1,685,431 |
Average estimated '21 value of housing units in 3-to-4-unit structures (4.6% of all units):
| St Marys Square: | $7,911,372 |
| city: | $1,521,789 |
Most popular occupations of males: sales and office occupations (27.9%); service occupations (21.7%); management occupations (except farmers) (13.3%); construction, extraction, and maintenance occupations (11.3%); business and financial operations occupations (10.2%); architecture and engineering occupations (8.7%); computer and mathematical occupations (4.3%)
Most popular occupations of females: sales and office occupations (31.6%); service occupations (29.0%); healthcare practitioners and technical occupations (10.2%); education, training, and library occupations (7.7%); material moving occupations (7.5%); computer and mathematical occupations (5.4%); business and financial operations occupations (5.0%)
St Marys Square neighborhood detailed profile
Stonestown neighborhood in San Francisco statistics: (Find on map)
Area: 0.590 square miles
Population: 6,407
Population density:
Median household income in 2021:
Median rent in in 2021:
Male vs Females
Median age
Housing prices:
Average estimated value of townhouses or other attached units in 2021 (5.2% of all units):
Average estimated '21 value of housing units in 5-or-more-unit structures (25.0% of all units):
Most popular occupations of males: service occupations (25.9%); sales and office occupations (24.6%); transportation occupations (11.9%); management occupations (except farmers) (10.3%); education, training, and library occupations (9.2%); computer and mathematical occupations (3.8%); healthcare practitioners and technical occupations (3.7%)
Most popular occupations of females: sales and office occupations (40.4%); service occupations (24.5%); education, training, and library occupations (12.4%); transportation occupations (7.1%); management occupations (except farmers) (3.9%); business and financial operations occupations (3.5%); material moving occupations (2.0%)
Roads and streets: Font Blvd; Brotherhood Way; Vidal Dr; Gonzalez Dr; Arballo Dr; Holloway Ave; Winston Dr; Garces Dr; Buckingham Way; Serrano Dr; Crespi Dr; Tapia Dr; Juan Bautista Cir; Bucareli Dr; Cambon Dr; Cardenas Ave; Higuera Ave; Grijalva Dr; Chumasero Dr; Rivas Ave; Diaz Ave; Acevedo Ave; Pinto Ave; N State Dr; Arellano Ave; 20th Ave; Fuente Ave; Josepha Ave; Campus Cir; Felix Ave; Galindo Ave; Varela Ave; Castelo Ave; Church Access Rd.
Stonestown neighborhood detailed profile
Area: 0.590 square miles
Population: 6,407
Population density:
| Stonestown: | 10,851 people per square mile |
| San Francisco: | 17,458 people per square mile |
Median household income in 2021:
| Stonestown: | $69,148 |
| San Francisco: | $121,826 |
Median rent in in 2021:
| Stonestown: | $2,259 |
| San Francisco: | $2,001 |
Male vs Females
| Males: | 2,443 |
| Females: | 3,964 |
Median age
| Males: | 26.3 years |
| Females: | 27.6 years |
Housing prices:
Average estimated value of townhouses or other attached units in 2021 (5.2% of all units):
| This neighborhood: | $1,115,464 |
| city: | $1,506,493 |
Average estimated '21 value of housing units in 5-or-more-unit structures (25.0% of all units):
| Stonestown: | $862,037 |
| San Francisco: | $1,317,001 |
Most popular occupations of males: service occupations (25.9%); sales and office occupations (24.6%); transportation occupations (11.9%); management occupations (except farmers) (10.3%); education, training, and library occupations (9.2%); computer and mathematical occupations (3.8%); healthcare practitioners and technical occupations (3.7%)
Most popular occupations of females: sales and office occupations (40.4%); service occupations (24.5%); education, training, and library occupations (12.4%); transportation occupations (7.1%); management occupations (except farmers) (3.9%); business and financial operations occupations (3.5%); material moving occupations (2.0%)
Roads and streets: Font Blvd; Brotherhood Way; Vidal Dr; Gonzalez Dr; Arballo Dr; Holloway Ave; Winston Dr; Garces Dr; Buckingham Way; Serrano Dr; Crespi Dr; Tapia Dr; Juan Bautista Cir; Bucareli Dr; Cambon Dr; Cardenas Ave; Higuera Ave; Grijalva Dr; Chumasero Dr; Rivas Ave; Diaz Ave; Acevedo Ave; Pinto Ave; N State Dr; Arellano Ave; 20th Ave; Fuente Ave; Josepha Ave; Campus Cir; Felix Ave; Galindo Ave; Varela Ave; Castelo Ave; Church Access Rd.
Stonestown neighborhood detailed profile
Sunnydale neighborhood in San Francisco statistics: (Find on map)
Area: 0.152 square miles
Population: 5,140
Population density:
Median household income in 2021:
Median rent in in 2021:
Male vs Females
Median age
Housing prices:
Average estimated value of detached houses in 2021 (22.8% of all units):
Average estimated value of townhouses or other attached units in 2021 (31.3% of all units):
Most popular occupations of males: service occupations (27.7%); sales and office occupations (15.8%); transportation occupations (14.6%); construction, extraction, and maintenance occupations (13.0%); management occupations (except farmers) (6.2%); production occupations (6.0%); business and financial operations occupations (4.8%)
Most popular occupations of females: service occupations (37.5%); sales and office occupations (32.8%); material moving occupations (4.5%); management occupations (except farmers) (4.0%); education, training, and library occupations (4.0%); healthcare practitioners and technical occupations (4.0%); business and financial operations occupations (3.5%)
Roads and streets: Sunnydale Ave; Blythdale Ave; Velasco Ave; Brookdale Ave; Parque Dr; Sawyer St; Santos St; Hahn St; Pasadena St; Sunrise Way; Castillo St; Pueblo St; Calgary St.
Roads and streets: Calgary St; Geneva Ave; Pueblo St.
Sunnydale neighborhood detailed profile
Area: 0.152 square miles
Population: 5,140
Population density:
| Sunnydale: | 33,799 people per square mile |
| San Francisco: | 17,458 people per square mile |
Median household income in 2021:
| Sunnydale: | $74,537 |
| San Francisco: | $121,826 |
Median rent in in 2021:
| Sunnydale: | $1,088 |
| San Francisco: | $2,001 |
Male vs Females
| Males: | 2,429 |
| Females: | 2,710 |
Median age
| Males: | 40.6 years |
| Females: | 43.2 years |
Housing prices:
Average estimated value of detached houses in 2021 (22.8% of all units):
| Sunnydale: | $1,095,788 |
| San Francisco: | $1,815,784 |
Average estimated value of townhouses or other attached units in 2021 (31.3% of all units):
| This neighborhood: | $2,082,052 |
| city: | $1,506,493 |
Most popular occupations of males: service occupations (27.7%); sales and office occupations (15.8%); transportation occupations (14.6%); construction, extraction, and maintenance occupations (13.0%); management occupations (except farmers) (6.2%); production occupations (6.0%); business and financial operations occupations (4.8%)
Most popular occupations of females: service occupations (37.5%); sales and office occupations (32.8%); material moving occupations (4.5%); management occupations (except farmers) (4.0%); education, training, and library occupations (4.0%); healthcare practitioners and technical occupations (4.0%); business and financial operations occupations (3.5%)
Roads and streets: Sunnydale Ave; Blythdale Ave; Velasco Ave; Brookdale Ave; Parque Dr; Sawyer St; Santos St; Hahn St; Pasadena St; Sunrise Way; Castillo St; Pueblo St; Calgary St.
Roads and streets: Calgary St; Geneva Ave; Pueblo St.
Sunnydale neighborhood detailed profile
Sunnyside neighborhood in San Francisco statistics: (Find on map)
Area: 0.513 square miles
Population: 7,846
Population density:
Median household income in 2021:
Median rent in in 2021:
Male vs Females
Median age
Housing prices:
Average estimated value of detached houses in 2021 (53.0% of all units):
Average estimated value of townhouses or other attached units in 2021 (30.7% of all units):
Average estimated value of housing units in 2-unit structures in 2021 (11.4% of all units):
Average estimated '21 value of housing units in 3-to-4-unit structures (10.7% of all units):
Average estimated '21 value of housing units in 5-or-more-unit structures (11.1% of all units):
Most popular occupations of males: computer and mathematical occupations (19.8%); service occupations (18.8%); management occupations (except farmers) (13.2%); sales and office occupations (11.9%); business and financial operations occupations (7.8%); arts, design, entertainment, sports, and media occupations (6.4%); transportation occupations (5.3%)
Most popular occupations of females: sales and office occupations (23.9%); management occupations (except farmers) (14.3%); service occupations (13.6%); education, training, and library occupations (10.7%); healthcare practitioners and technical occupations (8.2%); architecture and engineering occupations (6.0%); life, physical, and social science occupations (5.4%)
Limited-access highways (interstate or state) in this neighborhood: I- 280.
Roads and streets: Monterey Blvd; Circular Ave; Joost Ave; Mangels Ave; Bosworth St; Hearst Ave; Flood Ave; Staples Ave; Judson Ave; San Jose Ave; Cloud Cir; Edna St; Phelan Ave; Arco Way; West Rd; Marston Ave; Detroit St; Gennessee St; Foerster St; Baden St; Congo St; Havelock St; Martha Ave; Science Cir; East Rd; Diamond St; Lippard Ave; Nordhoff St; Brompton Ave; Acadia St; Burnside Ave; Chilton Ave; Hamerton Ave; Paulding St; Calvert Dr; Stillings Ave; Gorham St.
Sunnyside neighborhood detailed profile
Area: 0.513 square miles
Population: 7,846
Population density:
| Sunnyside: | 15,286 people per square mile |
| San Francisco: | 17,458 people per square mile |
Median household income in 2021:
| Sunnyside: | $158,646 |
| San Francisco: | $121,826 |
Median rent in in 2021:
| Sunnyside: | $2,945 |
| San Francisco: | $2,001 |
Male vs Females
| Males: | 3,849 |
| Females: | 3,996 |
Median age
| Males: | 42.8 years |
| Females: | 44.0 years |
Housing prices:
Average estimated value of detached houses in 2021 (53.0% of all units):
| Sunnyside: | $1,819,139 |
| San Francisco: | $1,815,784 |
Average estimated value of townhouses or other attached units in 2021 (30.7% of all units):
| This neighborhood: | $1,135,167 |
| city: | $1,506,493 |
Average estimated value of housing units in 2-unit structures in 2021 (11.4% of all units):
| This neighborhood: | $1,344,262 |
| San Francisco: | $1,685,431 |
Average estimated '21 value of housing units in 3-to-4-unit structures (10.7% of all units):
| Sunnyside: | $1,243,750 |
| city: | $1,521,789 |
Average estimated '21 value of housing units in 5-or-more-unit structures (11.1% of all units):
| Sunnyside: | $930,832 |
| San Francisco: | $1,317,001 |
Most popular occupations of males: computer and mathematical occupations (19.8%); service occupations (18.8%); management occupations (except farmers) (13.2%); sales and office occupations (11.9%); business and financial operations occupations (7.8%); arts, design, entertainment, sports, and media occupations (6.4%); transportation occupations (5.3%)
Most popular occupations of females: sales and office occupations (23.9%); management occupations (except farmers) (14.3%); service occupations (13.6%); education, training, and library occupations (10.7%); healthcare practitioners and technical occupations (8.2%); architecture and engineering occupations (6.0%); life, physical, and social science occupations (5.4%)
Limited-access highways (interstate or state) in this neighborhood: I- 280.
Roads and streets: Monterey Blvd; Circular Ave; Joost Ave; Mangels Ave; Bosworth St; Hearst Ave; Flood Ave; Staples Ave; Judson Ave; San Jose Ave; Cloud Cir; Edna St; Phelan Ave; Arco Way; West Rd; Marston Ave; Detroit St; Gennessee St; Foerster St; Baden St; Congo St; Havelock St; Martha Ave; Science Cir; East Rd; Diamond St; Lippard Ave; Nordhoff St; Brompton Ave; Acadia St; Burnside Ave; Chilton Ave; Hamerton Ave; Paulding St; Calvert Dr; Stillings Ave; Gorham St.
Sunnyside neighborhood detailed profile
Sunset District neighborhood in San Francisco statistics: (Find on map)
Area: 4.535 square miles
Population: 88,400
Population density:
Median household income in 2021:
Median rent in in 2021:
Male vs Females
Median age
Housing prices:
Average estimated value of detached houses in 2021 (35.9% of all units):
Average estimated value of townhouses or other attached units in 2021 (33.5% of all units):
Average estimated value of housing units in 2-unit structures in 2021 (15.9% of all units):
Average estimated '21 value of housing units in 3-to-4-unit structures (14.0% of all units):
Average estimated '21 value of housing units in 5-or-more-unit structures (8.1% of all units):
Most popular occupations of males: sales and office occupations (16.7%); service occupations (15.8%); management occupations (except farmers) (13.6%); computer and mathematical occupations (10.6%); transportation occupations (6.0%); architecture and engineering occupations (5.1%); business and financial operations occupations (5.0%)
Most popular occupations of females: sales and office occupations (18.7%); service occupations (18.5%); management occupations (except farmers) (13.1%); healthcare practitioners and technical occupations (10.8%); business and financial operations occupations (9.1%); education, training, and library occupations (8.5%); arts, design, entertainment, sports, and media occupations (5.6%)
Highways in this neighborhood: State Hwy 1 (19th Ave).
Roads and streets: Lincoln Way; Sunset Blvd; Judah St; Great Hwy; Noriega St; Lawton St; Sloat Blvd; Taraval St; Irving St; Kirkham St; Ulloa St; Moraga St; Ortega St; Quintara St; Rivera St; Santiago St; Vicente St; Wawona St; 34th Ave; 37th Ave; 36th Ave; 35th Ave; Pacheco St; 42nd Ave; 14th Ave; 44th Ave; 30th Ave; 41st Ave; 22nd Ave; 20th Ave; 24th Ave; 21st Ave; 43rd Ave; 45th Ave; 46th Ave; 47th Ave; 28th Ave; 15th Ave; 31st Ave; 33rd Ave; 16th Ave; 18th Ave; 32nd Ave; 29th Ave; 17th Ave; 39th Ave; 40th Ave; 48th Ave; 25th Ave; 38th Ave; 26th Ave; 23rd Ave; 27th Ave; Funston Ave; Upper Great Hwy; Crestlake Dr; Yorba St; la Playa St; 12th Ave; Rockridge Dr; Aloha Ave; Vale Ave; Cecilia Ave; Lomita Ave; Escondido Ave; Anglo Aly; Escolta Way; Briarcliff Ter; Forest Side Ave; Pino Aly; Lurline St; el Mirasol Pl; Easement; Fanning Way; Constanso Way; Ortega Way; Mount Ln; Goleta Ave; Cutler Ave; Ardenwood Way; Paraiso Pl; Sheldon Ter; Mandalay Ln; Aerial Way; Encinal Walk; Cascade Walk; Palos Pl; San Marcos Ave; Gabilan Way; Radio Ter; Rosemary Ct; Avon Way; Crestwell Walk.
Sunset District neighborhood detailed profile
Area: 4.535 square miles
Population: 88,400
Population density:
| Sunset District: | 19,494 people per square mile |
| San Francisco: | 17,458 people per square mile |
Median household income in 2021:
| Sunset District: | $129,670 |
| San Francisco: | $121,826 |
Median rent in in 2021:
| Sunset District: | $2,270 |
| San Francisco: | $2,001 |
Male vs Females
| Males: | 44,204 |
| Females: | 44,196 |
Median age
| Males: | 43.4 years |
| Females: | 45.1 years |
Housing prices:
Average estimated value of detached houses in 2021 (35.9% of all units):
| Sunset District: | $1,393,817 |
| San Francisco: | $1,815,784 |
Average estimated value of townhouses or other attached units in 2021 (33.5% of all units):
| This neighborhood: | $1,218,782 |
| city: | $1,506,493 |
Average estimated value of housing units in 2-unit structures in 2021 (15.9% of all units):
| This neighborhood: | $932,143 |
| San Francisco: | $1,685,431 |
Average estimated '21 value of housing units in 3-to-4-unit structures (14.0% of all units):
| Sunset District: | $987,059 |
| city: | $1,521,789 |
Average estimated '21 value of housing units in 5-or-more-unit structures (8.1% of all units):
| Sunset District: | $803,348 |
| San Francisco: | $1,317,001 |
Most popular occupations of males: sales and office occupations (16.7%); service occupations (15.8%); management occupations (except farmers) (13.6%); computer and mathematical occupations (10.6%); transportation occupations (6.0%); architecture and engineering occupations (5.1%); business and financial operations occupations (5.0%)
Most popular occupations of females: sales and office occupations (18.7%); service occupations (18.5%); management occupations (except farmers) (13.1%); healthcare practitioners and technical occupations (10.8%); business and financial operations occupations (9.1%); education, training, and library occupations (8.5%); arts, design, entertainment, sports, and media occupations (5.6%)
Highways in this neighborhood: State Hwy 1 (19th Ave).
Roads and streets: Lincoln Way; Sunset Blvd; Judah St; Great Hwy; Noriega St; Lawton St; Sloat Blvd; Taraval St; Irving St; Kirkham St; Ulloa St; Moraga St; Ortega St; Quintara St; Rivera St; Santiago St; Vicente St; Wawona St; 34th Ave; 37th Ave; 36th Ave; 35th Ave; Pacheco St; 42nd Ave; 14th Ave; 44th Ave; 30th Ave; 41st Ave; 22nd Ave; 20th Ave; 24th Ave; 21st Ave; 43rd Ave; 45th Ave; 46th Ave; 47th Ave; 28th Ave; 15th Ave; 31st Ave; 33rd Ave; 16th Ave; 18th Ave; 32nd Ave; 29th Ave; 17th Ave; 39th Ave; 40th Ave; 48th Ave; 25th Ave; 38th Ave; 26th Ave; 23rd Ave; 27th Ave; Funston Ave; Upper Great Hwy; Crestlake Dr; Yorba St; la Playa St; 12th Ave; Rockridge Dr; Aloha Ave; Vale Ave; Cecilia Ave; Lomita Ave; Escondido Ave; Anglo Aly; Escolta Way; Briarcliff Ter; Forest Side Ave; Pino Aly; Lurline St; el Mirasol Pl; Easement; Fanning Way; Constanso Way; Ortega Way; Mount Ln; Goleta Ave; Cutler Ave; Ardenwood Way; Paraiso Pl; Sheldon Ter; Mandalay Ln; Aerial Way; Encinal Walk; Cascade Walk; Palos Pl; San Marcos Ave; Gabilan Way; Radio Ter; Rosemary Ct; Avon Way; Crestwell Walk.
Sunset District neighborhood detailed profile
Sutro Heights neighborhood in San Francisco statistics: (Find on map)
Area: 0.076 square miles
Population: 2,437
Population density:
Median household income in 2021:
Median rent in in 2021:
Male vs Females
Median age
Most popular occupations of males: computer and mathematical occupations (32.4%); service occupations (16.4%); sales and office occupations (15.0%); management occupations (except farmers) (10.4%); education, training, and library occupations (8.2%); arts, design, entertainment, sports, and media occupations (5.2%); transportation occupations (3.8%)
Most popular occupations of females: sales and office occupations (27.4%); healthcare practitioners and technical occupations (21.7%); management occupations (except farmers) (13.2%); service occupations (11.3%); education, training, and library occupations (7.2%); community and social services occupations (5.8%); business and financial operations occupations (3.9%)
Roads and streets: 46th Ave; 47th Ave; 48th Ave; 45th Ave; Point Lobos Ave; Balboa St; Anza St; Geary Blvd; Sutro Heights Ave; el Camino del Mar.
Sutro Heights neighborhood detailed profile
Area: 0.076 square miles
Population: 2,437
Population density:
| Sutro Heights (Vista Del Mar): | 32,275 people per square mile |
| San Francisco: | 17,458 people per square mile |
Median household income in 2021:
| Sutro Heights (Vista Del Mar): | $131,279 |
| San Francisco: | $121,826 |
Median rent in in 2021:
| Sutro Heights (Vista Del Mar): | $1,773 |
| San Francisco: | $2,001 |
Male vs Females
| Males: | 1,219 |
| Females: | 1,218 |
Median age
| Males: | 38.3 years |
| Females: | 42.8 years |
Most popular occupations of males: computer and mathematical occupations (32.4%); service occupations (16.4%); sales and office occupations (15.0%); management occupations (except farmers) (10.4%); education, training, and library occupations (8.2%); arts, design, entertainment, sports, and media occupations (5.2%); transportation occupations (3.8%)
Most popular occupations of females: sales and office occupations (27.4%); healthcare practitioners and technical occupations (21.7%); management occupations (except farmers) (13.2%); service occupations (11.3%); education, training, and library occupations (7.2%); community and social services occupations (5.8%); business and financial operations occupations (3.9%)
Roads and streets: 46th Ave; 47th Ave; 48th Ave; 45th Ave; Point Lobos Ave; Balboa St; Anza St; Geary Blvd; Sutro Heights Ave; el Camino del Mar.
Sutro Heights neighborhood detailed profile
Telegraph Hill neighborhood in San Francisco statistics: (Find on map)
Area: 0.171 square miles
Population: 7,891
Population density:
Median household income in 2021:
Median rent in in 2021:
Male vs Females
Median age
Housing prices:
Average estimated '21 value of housing units in 3-to-4-unit structures (27.3% of all units):
Average estimated '21 value of housing units in 5-or-more-unit structures (11.2% of all units):
Most popular occupations of males: sales and office occupations (20.8%); computer and mathematical occupations (12.3%); business and financial operations occupations (11.0%); transportation occupations (11.0%); service occupations (10.6%); legal occupations (7.2%); architecture and engineering occupations (5.0%)
Most popular occupations of females: sales and office occupations (24.1%); management occupations (except farmers) (22.3%); service occupations (20.5%); business and financial operations occupations (11.6%); arts, design, entertainment, sports, and media occupations (7.7%); healthcare practitioners and technical occupations (4.4%); architecture and engineering occupations (2.9%)
Roads and streets: Grant Ave; Stockton St; Greenwich St; Kearny St; Union St; Filbert St; Montgomery St; Green St; Vallejo St; Lombard St; Telegraph Hill Blvd; Chestnut St; Columbus Ave; Alta St; Pfeiffer St; Francisco St; Jasper Pl; Varennes St; Fresno St; San Antonio Pl; Bellair Pl; Child St; Genoa Pl; Bannam Pl; Sonoma St; Castle St; Edgardo Pl; Edith St; la Ferrera Ter; Darrell Pl; Margrave Pl; Telegraph Pl; Montague Pl; Dunnes Aly; Nobles Aly; Whiting St; Via Ferlinghetti; Kenneth Rexroth Pl (Tracy Pl); Kramer Pl; Hodges Aly; Pollard Pl; Prescott Ct; Cadell Pl; Gerke Aly; Julius St; Napier Ln; School Aly; Medau Pl; Krausgrill Pl; Bob Kaufman Aly; Windsor Pl; Calhoun Ter; Kohler Pl; Pardee Aly; Reno Pl.
Telegraph Hill neighborhood detailed profile
Area: 0.171 square miles
Population: 7,891
Population density:
| Telegraph Hill: | 46,263 people per square mile |
| San Francisco: | 17,458 people per square mile |
Median household income in 2021:
| Telegraph Hill: | $78,507 |
| San Francisco: | $121,826 |
Median rent in in 2021:
| Telegraph Hill: | $1,711 |
| San Francisco: | $2,001 |
Male vs Females
| Males: | 4,638 |
| Females: | 3,253 |
Median age
| Males: | 40.4 years |
| Females: | 44.8 years |
Housing prices:
Average estimated '21 value of housing units in 3-to-4-unit structures (27.3% of all units):
| Telegraph Hill: | $1,613,953 |
| city: | $1,521,789 |
Average estimated '21 value of housing units in 5-or-more-unit structures (11.2% of all units):
| Telegraph Hill: | $1,132,258 |
| San Francisco: | $1,317,001 |
Most popular occupations of males: sales and office occupations (20.8%); computer and mathematical occupations (12.3%); business and financial operations occupations (11.0%); transportation occupations (11.0%); service occupations (10.6%); legal occupations (7.2%); architecture and engineering occupations (5.0%)
Most popular occupations of females: sales and office occupations (24.1%); management occupations (except farmers) (22.3%); service occupations (20.5%); business and financial operations occupations (11.6%); arts, design, entertainment, sports, and media occupations (7.7%); healthcare practitioners and technical occupations (4.4%); architecture and engineering occupations (2.9%)
Roads and streets: Grant Ave; Stockton St; Greenwich St; Kearny St; Union St; Filbert St; Montgomery St; Green St; Vallejo St; Lombard St; Telegraph Hill Blvd; Chestnut St; Columbus Ave; Alta St; Pfeiffer St; Francisco St; Jasper Pl; Varennes St; Fresno St; San Antonio Pl; Bellair Pl; Child St; Genoa Pl; Bannam Pl; Sonoma St; Castle St; Edgardo Pl; Edith St; la Ferrera Ter; Darrell Pl; Margrave Pl; Telegraph Pl; Montague Pl; Dunnes Aly; Nobles Aly; Whiting St; Via Ferlinghetti; Kenneth Rexroth Pl (Tracy Pl); Kramer Pl; Hodges Aly; Pollard Pl; Prescott Ct; Cadell Pl; Gerke Aly; Julius St; Napier Ln; School Aly; Medau Pl; Krausgrill Pl; Bob Kaufman Aly; Windsor Pl; Calhoun Ter; Kohler Pl; Pardee Aly; Reno Pl.
Telegraph Hill neighborhood detailed profile
Tenderloin neighborhood in San Francisco statistics: (Find on map)
Area: 0.278 square miles
Roads and streets: Market St; Hyde St; Larkin St; Geary St; Golden Gate Ave; Leavenworth St; Eddy St; Ofarrell St; Turk Blvd (Turk St); Ellis St; Jones St; McAllister St; Taylor St; Stevenson St; Fulton St; Jessie St; 7th St; 6th St; Antonio St; Shannon St; 8th St; Derby St; Steveloe Pl; Ada Ct; Breen Pl; Dale Pl; Dodge Pl (Dodge St); Cohen Pl; Opal Pl; Wagner Aly.
Tenderloin neighborhood detailed profile
The Hub neighborhood in San Francisco statistics: (Find on map)
Area: 0.067 square miles
Roads and streets: Duboce Ave; Valencia St; McCoppin St; Stevenson St; Elgin Park; Gough St; Pearl St; Clinton Park; Jessie St.
The Hub neighborhood detailed profile
Area: 0.067 square miles
Roads and streets: Duboce Ave; Valencia St; McCoppin St; Stevenson St; Elgin Park; Gough St; Pearl St; Clinton Park; Jessie St.
The Hub neighborhood detailed profile
Transmission neighborhood in San Francisco statistics: (Find on map)
Area: 0.090 square miles
Population: 2,665
Population density:
Median household income in 2021:
Median rent in in 2021:
Male vs Females
Median age
Housing prices:
Average estimated value of detached houses in 2021 (18.7% of all units):
Average estimated value of townhouses or other attached units in 2021 (13.6% of all units):
Average estimated value of housing units in 2-unit structures in 2021 (20.6% of all units):
Average estimated '21 value of housing units in 3-to-4-unit structures (25.1% of all units):
Average estimated '21 value of housing units in 5-or-more-unit structures (3.3% of all units):
Most popular occupations of males: management occupations (except farmers) (17.2%); sales and office occupations (15.7%); computer and mathematical occupations (13.1%); service occupations (9.2%); construction, extraction, and maintenance occupations (9.2%); business and financial operations occupations (7.1%); architecture and engineering occupations (6.7%)
Most popular occupations of females: sales and office occupations (27.6%); management occupations (except farmers) (11.2%); education, training, and library occupations (10.7%); business and financial operations occupations (10.3%); service occupations (9.2%); arts, design, entertainment, sports, and media occupations (8.2%); computer and mathematical occupations (5.9%)
Roads and streets: Mission St; Coleridge St; Lundys Ln; Precita Ave; Coso Ave; Prospect Ave; Virginia Ave; Fair Ave; Godeus St; Eugenia Ave; Powers Ave; Kingston St; Esmeralda Ave; Peters Ave; Emmet Ct (Emmett Ct).
Transmission neighborhood detailed profile
Area: 0.090 square miles
Population: 2,665
Population density:
| Transmission: | 29,728 people per square mile |
| San Francisco: | 17,458 people per square mile |
Median household income in 2021:
| Transmission: | $181,144 |
| San Francisco: | $121,826 |
Median rent in in 2021:
| Transmission: | $2,056 |
| San Francisco: | $2,001 |
Male vs Females
| Males: | 1,432 |
| Females: | 1,232 |
Median age
| Males: | 43.3 years |
| Females: | 43.6 years |
Housing prices:
Average estimated value of detached houses in 2021 (18.7% of all units):
| Transmission: | $1,123,551 |
| San Francisco: | $1,815,784 |
Average estimated value of townhouses or other attached units in 2021 (13.6% of all units):
| This neighborhood: | $1,231,805 |
| city: | $1,506,493 |
Average estimated value of housing units in 2-unit structures in 2021 (20.6% of all units):
| This neighborhood: | $1,079,167 |
| San Francisco: | $1,685,431 |
Average estimated '21 value of housing units in 3-to-4-unit structures (25.1% of all units):
| Transmission: | $1,135,641 |
| city: | $1,521,789 |
Average estimated '21 value of housing units in 5-or-more-unit structures (3.3% of all units):
| Transmission: | $796,479 |
| San Francisco: | $1,317,001 |
Most popular occupations of males: management occupations (except farmers) (17.2%); sales and office occupations (15.7%); computer and mathematical occupations (13.1%); service occupations (9.2%); construction, extraction, and maintenance occupations (9.2%); business and financial operations occupations (7.1%); architecture and engineering occupations (6.7%)
Most popular occupations of females: sales and office occupations (27.6%); management occupations (except farmers) (11.2%); education, training, and library occupations (10.7%); business and financial operations occupations (10.3%); service occupations (9.2%); arts, design, entertainment, sports, and media occupations (8.2%); computer and mathematical occupations (5.9%)
Roads and streets: Mission St; Coleridge St; Lundys Ln; Precita Ave; Coso Ave; Prospect Ave; Virginia Ave; Fair Ave; Godeus St; Eugenia Ave; Powers Ave; Kingston St; Esmeralda Ave; Peters Ave; Emmet Ct (Emmett Ct).
Transmission neighborhood detailed profile
Treasure Island neighborhood in San Francisco statistics: (Find on map)
Area: 0.657 square miles
Roads and streets: Gateview Ave; Avenue N; Ave M; Ave D; Ave H; 4th St; 3rd St; 13th St; 9th St; California Ave; Ave of the Palms; 11th St; Ave I; Ave B; 5th St; N Point Dr; Avenue E; Ave F; Bayside Dr; Mariner Dr; 8th St; 6th St; Ave C; Exposition Dr; 12th St; Sturgeon St; Gateview Ct; Chinook Ct; 1st St; Halibut Ct; Halyburton Ct; Hutchins Ct; Mason Ct; Ozbourn Ct; Reeves Ct; Lester Ct; Flounder Ct; Striped Bass St; Bigelow Ct; Croaker Ct; Keppler Ct; Treasure Island Rd.
Treasure Island neighborhood detailed profile
Twin Peaks neighborhood in San Francisco statistics: (Find on map)
Area: 0.198 square miles
Population: 2,091
Population density:
Median household income in 2021:
Median rent in in 2021:
Male vs Females
Median age
Housing prices:
Average estimated value of detached houses in 2021 (47.9% of all units):
Average estimated value of townhouses or other attached units in 2021 (12.0% of all units):
Average estimated value of housing units in 2-unit structures in 2021 (19.7% of all units):
Average estimated '21 value of housing units in 3-to-4-unit structures (40.5% of all units):
Average estimated '21 value of housing units in 5-or-more-unit structures (13.7% of all units):
Most popular occupations of males: arts, design, entertainment, sports, and media occupations (20.7%); management occupations (except farmers) (18.6%); computer and mathematical occupations (12.1%); service occupations (9.3%); sales and office occupations (7.1%); community and social services occupations (6.2%); construction, extraction, and maintenance occupations (5.9%)
Most popular occupations of females: management occupations (except farmers) (22.0%); healthcare practitioners and technical occupations (20.0%); business and financial operations occupations (11.4%); community and social services occupations (8.8%); architecture and engineering occupations (6.5%); service occupations (6.4%); education, training, and library occupations (6.1%)
Roads and streets: Portola Dr (Market St); Burnett Ave; Corbett Ave; Gardenside Dr; Crestline Dr; Christmas Tree Pt Rd; Christmas Tree Point Rd; Graystone Ter; Parkridge Dr; Cuesta Ct (Portola Dr, Market St); Vista Ln; Romain St; Copper Aly; Portola Dr; Fenton Ln; Golding Ln; Argent Aly; Dixie Aly; Glendale St; Perego Ter; 23rd St; Iron Aly; Burnett North Ave; Hopkins Ave; Glenview Dr; Morgan Aly; N Burnett Ave; Grand View Ave.
Twin Peaks neighborhood detailed profile
Area: 0.198 square miles
Population: 2,091
Population density:
| Twin Peaks: | 10,556 people per square mile |
| San Francisco: | 17,458 people per square mile |
Median household income in 2021:
| Twin Peaks: | $168,606 |
| San Francisco: | $121,826 |
Median rent in in 2021:
| Twin Peaks: | $2,579 |
| San Francisco: | $2,001 |
Male vs Females
| Males: | 1,310 |
| Females: | 780 |
Median age
| Males: | 42.9 years |
| Females: | 40.3 years |
Housing prices:
Average estimated value of detached houses in 2021 (47.9% of all units):
| Twin Peaks: | $2,112,245 |
| San Francisco: | $1,815,784 |
Average estimated value of townhouses or other attached units in 2021 (12.0% of all units):
| This neighborhood: | $2,379,316 |
| city: | $1,506,493 |
Average estimated value of housing units in 2-unit structures in 2021 (19.7% of all units):
| This neighborhood: | $1,866,667 |
| San Francisco: | $1,685,431 |
Average estimated '21 value of housing units in 3-to-4-unit structures (40.5% of all units):
| Twin Peaks: | $1,558,696 |
| city: | $1,521,789 |
Average estimated '21 value of housing units in 5-or-more-unit structures (13.7% of all units):
| Twin Peaks: | $857,143 |
| San Francisco: | $1,317,001 |
Most popular occupations of males: arts, design, entertainment, sports, and media occupations (20.7%); management occupations (except farmers) (18.6%); computer and mathematical occupations (12.1%); service occupations (9.3%); sales and office occupations (7.1%); community and social services occupations (6.2%); construction, extraction, and maintenance occupations (5.9%)
Most popular occupations of females: management occupations (except farmers) (22.0%); healthcare practitioners and technical occupations (20.0%); business and financial operations occupations (11.4%); community and social services occupations (8.8%); architecture and engineering occupations (6.5%); service occupations (6.4%); education, training, and library occupations (6.1%)
Roads and streets: Portola Dr (Market St); Burnett Ave; Corbett Ave; Gardenside Dr; Crestline Dr; Christmas Tree Pt Rd; Christmas Tree Point Rd; Graystone Ter; Parkridge Dr; Cuesta Ct (Portola Dr, Market St); Vista Ln; Romain St; Copper Aly; Portola Dr; Fenton Ln; Golding Ln; Argent Aly; Dixie Aly; Glendale St; Perego Ter; 23rd St; Iron Aly; Burnett North Ave; Hopkins Ave; Glenview Dr; Morgan Aly; N Burnett Ave; Grand View Ave.
Twin Peaks neighborhood detailed profile
Twin Peaks West neighborhood in San Francisco statistics: (Find on map)
Area: 4.064 square miles
Population: 42,934
Population density:
Median household income in 2021:
Median rent in in 2021:
Male vs Females
Median age
Housing prices:
Average estimated value of detached houses in 2021 (66.9% of all units):
Average estimated value of townhouses or other attached units in 2021 (23.7% of all units):
Average estimated value of housing units in 2-unit structures in 2021 (7.9% of all units):
Average estimated '21 value of housing units in 3-to-4-unit structures (6.9% of all units):
Average estimated '21 value of housing units in 5-or-more-unit structures (10.9% of all units):
Most popular occupations of males: management occupations (except farmers) (19.3%); computer and mathematical occupations (14.9%); sales and office occupations (13.6%); business and financial operations occupations (8.2%); service occupations (7.0%); healthcare practitioners and technical occupations (5.6%); architecture and engineering occupations (4.5%)
Most popular occupations of females: sales and office occupations (22.1%); management occupations (except farmers) (15.8%); healthcare practitioners and technical occupations (11.1%); business and financial operations occupations (10.1%); service occupations (9.5%); education, training, and library occupations (8.1%); arts, design, entertainment, sports, and media occupations (5.5%)
Limited-access highways (interstate or state) in this neighborhood: I- 280.
Roads and streets: Monterey Blvd; Portola Dr; Junipero Serra Blvd; Twin Peaks Blvd; Marietta Dr; Ocean Ave; Bosworth St; Joost Ave; Laguna Honda Blvd; Mangels Ave; Portola Dr (Market St); Teresita Blvd; Ulloa St; O'Shaughnessy Blvd; Circular Ave; Oshaughnessy Blvd; W Portal Ave; Urbano Dr; Burnett Ave; Pacheco St; Magellan Ave; Woodside Ave; Hearst Ave; Panorama Dr; Los Palmos Dr; Clarendon Ave; Flood Ave; Darien Way; Miramar Ave; Warren Dr; Staples Ave; Yerba Buena Ave; Dellbrook Ave; Juanita Way; Foerster St; Lansdale Ave; Castenada Ave; Melrose Ave; Holloway Ave; Molimo Dr; Judson Ave; Corbett Ave; Myra Way; Hazelwood Ave; Bella Vista Way; Oak Park Dr; Brentwood Ave; Cresta Vista Dr; 14th Ave; San Benito Way; Plymouth Ave; 9th Ave; San Jose Ave; Congo St; Idora Ave; Christopher Dr; Santa Ana Ave; Amber Dr; San Anselmo Ave; Rockdale Dr; Moncada Way; St Francis Blvd; Miraloma Dr; Edna St; Cloud Cir; Evelyn Way; Kensington Way; San Leandro Way; San Marcos Ave; Edgehill Way; Upland Dr; Crestmont Dr; Wawona St; Taraval St; Santa Clara Ave; Olympia Way; Casitas Ave; Santa Paula Ave; Upper Svc Rd; Dalewood Way; Phelan Ave; Colon Ave; Gold Mine Dr; Dorantes Ave; Detroit St; Turquoise Way; Faxon Ave; Vasquez Ave; Maywood Dr; Kenwood Way; San Fernando Way; Wildwood Way; Corona St; Valdez Ave; Garcia Ave; Robinhood Dr; Glenview Dr; Topaz Way; Dewey Blvd; Malta Dr; Hernandez Ave; Arco Way; Gennessee St; Westgate Dr; Gardenside Dr; Galewood Cir; Merced Ave; Skyview Way; Lunado Way; West Rd; Crestline Dr; Dorado Ter; Marston Ave; Johnstone Dr; Eastwood Dr; Westwood Dr; Cerritos Ave; Victoria St; Montecito Ave; San Pablo Ave; Northwood Dr; Mendosa Ave; San Jacinto Way; Stillings Ave; Claremont Blvd; Aptos Ave; Dorchester Way; Borica St; Starview Way; Granville Way; Entrada Ct; Burlwood Dr; Marview Way; 12th Ave; Vicente St; Santa Monica Way; Terrace Dr; Manor Dr; Baden St; de Soto St; Forest Side Ave; Knollview Way; Paloma Ave; Madrone Ave; Midcrest Way; Southwood Dr; Christmas Tree Pt Rd; Funston Ave; San Felipe Ave; Mercedes Way; Ashton Ave; Stanford Heights Ave; Rockaway Ave; Cedro Ave; Aquavista Way; Pinehurst Way; Christmas Tree Point Rd; Fernwood Dr; Ora Way; el Verano Way; Ridgewood Ave; Gladeview Way; Locksley Ave; Agua Way; Saint Francis Blvd; Cityview Way; Lenox Way; St Elmo Way; Estero Ave; Rosewood Dr; Berkeley Way; Montalvo Ave; Graystone Ter; Alton Ave; Sotelo Ave; San Andreas Way; Balceta Ave; del Vale Ave; Fairfield Way; San Rafael Way; San Buenaventura Way; 10th Ave; Behr Ave; Ravenwood Dr; Havelock St; el Sereno Ct; Head St; Dawnview Way; Forest Knolls Dr; Cameo Way; Keystone Way; 8th Ave; Duncan St; Sequoia Way; Allston Way; Martha Ave; Quintara St; Parkridge Dr; Red Rock Way; Science Cir; Reposa Way; Briarcliff Ter; San Aleso Ave; Greenwood Ave; East Rd; Arroyo Way; San Lorenzo Way; Marcela Ave; Chaves Ave; St Croix Dr; Knockash Hill; Farview Ct; Alviso St; Lopez Ave; Dorcas Way; Devonshire Way; Fowler Ave; Valletta Ct; Marne Ave; Verna St; Amethyst Way; Santa Rita Ave; Sunview Dr; Automobile Pathway; Sydney Way; Linares Ave; Onique Ln; Encline Ct; Clarendon Woods Ave; Longview Ct; Lakewood Ave; Terrace Walk; Ventura Ave; del Sur Ave; la Bica Way; Rockwood Ct; Cuesta Ct (Portola Dr, Market St); Foerster; Gaviota Way; Vista Ln; Romain St; Diamond St; Crags Ct; Omar Way; Copper Aly; Ashwood Ln; Oakhurst Ln; Monticello St; Blairwood Ln; Clairview Ct; Lippard Ave; Coventry Ct (Coventry Ln); Fredela Ln; Gatun Aly; Lulu Aly; Cortes Ave; Vista Verde Ct; Nordhoff St; Northgate Dr; Brompton Ave; el Plazuela St (el Plazuela Way); San Ramon Way; Acadia St; Woodhaven Ct; Fenton Ln; Elmwood Way; Burnside Ave; Golding Ln; Chilton Ave; Legion Ct; Argent Aly; Dixie Aly; Mountview Ct; 31st St; Glendale St; Hamerton Ave; Pizarro Way; Perego Ter; Quartz Way; Rio Ct; 23rd St; Verdun Way; Adolph Sutro Ct; Path St; Iron Aly; Forest Hill Path; Paulding St; Burnett North Ave; Hopkins Ave; Sola Ave; Pico Ave; Greenview Ct; Glenhaven Ln; Avoca Aly; Mesa Ave; Portal Path; Isola Way; Coralino Ln; Bengal Aly; Baxter Aly; Ludlow Aly; 15th Ave; Ingleside Path; Rex Ave; Lake Forest Ct; Sherwood Ct; Waithman Way; Hillcrest Ct; Globe Aly; Morgan Aly; N Burnett Ave; Jade Pl; Lori Ln; Lunado Ct; Homewood Ct; Plaza St; Calvert Dr; Clarkson St; Clipper St; Cragmont Ave; Opalo Ln; Mercato Ct; Grand View Ave.
Twin Peaks West neighborhood detailed profile
Area: 4.064 square miles
Population: 42,934
Population density:
| Twin Peaks West: | 10,564 people per square mile |
| San Francisco: | 17,458 people per square mile |
Median household income in 2021:
| Twin Peaks West: | $168,174 |
| San Francisco: | $121,826 |
Median rent in in 2021:
| Twin Peaks West: | $2,905 |
| San Francisco: | $2,001 |
Male vs Females
| Males: | 21,374 |
| Females: | 21,560 |
Median age
| Males: | 45.4 years |
| Females: | 45.9 years |
Housing prices:
Average estimated value of detached houses in 2021 (66.9% of all units):
| Twin Peaks West: | $1,742,839 |
| San Francisco: | $1,815,784 |
Average estimated value of townhouses or other attached units in 2021 (23.7% of all units):
| This neighborhood: | $1,264,954 |
| city: | $1,506,493 |
Average estimated value of housing units in 2-unit structures in 2021 (7.9% of all units):
| This neighborhood: | $1,387,219 |
| San Francisco: | $1,685,431 |
Average estimated '21 value of housing units in 3-to-4-unit structures (6.9% of all units):
| Twin Peaks West: | $1,320,060 |
| city: | $1,521,789 |
Average estimated '21 value of housing units in 5-or-more-unit structures (10.9% of all units):
| Twin Peaks West: | $920,105 |
| San Francisco: | $1,317,001 |
Most popular occupations of males: management occupations (except farmers) (19.3%); computer and mathematical occupations (14.9%); sales and office occupations (13.6%); business and financial operations occupations (8.2%); service occupations (7.0%); healthcare practitioners and technical occupations (5.6%); architecture and engineering occupations (4.5%)
Most popular occupations of females: sales and office occupations (22.1%); management occupations (except farmers) (15.8%); healthcare practitioners and technical occupations (11.1%); business and financial operations occupations (10.1%); service occupations (9.5%); education, training, and library occupations (8.1%); arts, design, entertainment, sports, and media occupations (5.5%)
Limited-access highways (interstate or state) in this neighborhood: I- 280.
Roads and streets: Monterey Blvd; Portola Dr; Junipero Serra Blvd; Twin Peaks Blvd; Marietta Dr; Ocean Ave; Bosworth St; Joost Ave; Laguna Honda Blvd; Mangels Ave; Portola Dr (Market St); Teresita Blvd; Ulloa St; O'Shaughnessy Blvd; Circular Ave; Oshaughnessy Blvd; W Portal Ave; Urbano Dr; Burnett Ave; Pacheco St; Magellan Ave; Woodside Ave; Hearst Ave; Panorama Dr; Los Palmos Dr; Clarendon Ave; Flood Ave; Darien Way; Miramar Ave; Warren Dr; Staples Ave; Yerba Buena Ave; Dellbrook Ave; Juanita Way; Foerster St; Lansdale Ave; Castenada Ave; Melrose Ave; Holloway Ave; Molimo Dr; Judson Ave; Corbett Ave; Myra Way; Hazelwood Ave; Bella Vista Way; Oak Park Dr; Brentwood Ave; Cresta Vista Dr; 14th Ave; San Benito Way; Plymouth Ave; 9th Ave; San Jose Ave; Congo St; Idora Ave; Christopher Dr; Santa Ana Ave; Amber Dr; San Anselmo Ave; Rockdale Dr; Moncada Way; St Francis Blvd; Miraloma Dr; Edna St; Cloud Cir; Evelyn Way; Kensington Way; San Leandro Way; San Marcos Ave; Edgehill Way; Upland Dr; Crestmont Dr; Wawona St; Taraval St; Santa Clara Ave; Olympia Way; Casitas Ave; Santa Paula Ave; Upper Svc Rd; Dalewood Way; Phelan Ave; Colon Ave; Gold Mine Dr; Dorantes Ave; Detroit St; Turquoise Way; Faxon Ave; Vasquez Ave; Maywood Dr; Kenwood Way; San Fernando Way; Wildwood Way; Corona St; Valdez Ave; Garcia Ave; Robinhood Dr; Glenview Dr; Topaz Way; Dewey Blvd; Malta Dr; Hernandez Ave; Arco Way; Gennessee St; Westgate Dr; Gardenside Dr; Galewood Cir; Merced Ave; Skyview Way; Lunado Way; West Rd; Crestline Dr; Dorado Ter; Marston Ave; Johnstone Dr; Eastwood Dr; Westwood Dr; Cerritos Ave; Victoria St; Montecito Ave; San Pablo Ave; Northwood Dr; Mendosa Ave; San Jacinto Way; Stillings Ave; Claremont Blvd; Aptos Ave; Dorchester Way; Borica St; Starview Way; Granville Way; Entrada Ct; Burlwood Dr; Marview Way; 12th Ave; Vicente St; Santa Monica Way; Terrace Dr; Manor Dr; Baden St; de Soto St; Forest Side Ave; Knollview Way; Paloma Ave; Madrone Ave; Midcrest Way; Southwood Dr; Christmas Tree Pt Rd; Funston Ave; San Felipe Ave; Mercedes Way; Ashton Ave; Stanford Heights Ave; Rockaway Ave; Cedro Ave; Aquavista Way; Pinehurst Way; Christmas Tree Point Rd; Fernwood Dr; Ora Way; el Verano Way; Ridgewood Ave; Gladeview Way; Locksley Ave; Agua Way; Saint Francis Blvd; Cityview Way; Lenox Way; St Elmo Way; Estero Ave; Rosewood Dr; Berkeley Way; Montalvo Ave; Graystone Ter; Alton Ave; Sotelo Ave; San Andreas Way; Balceta Ave; del Vale Ave; Fairfield Way; San Rafael Way; San Buenaventura Way; 10th Ave; Behr Ave; Ravenwood Dr; Havelock St; el Sereno Ct; Head St; Dawnview Way; Forest Knolls Dr; Cameo Way; Keystone Way; 8th Ave; Duncan St; Sequoia Way; Allston Way; Martha Ave; Quintara St; Parkridge Dr; Red Rock Way; Science Cir; Reposa Way; Briarcliff Ter; San Aleso Ave; Greenwood Ave; East Rd; Arroyo Way; San Lorenzo Way; Marcela Ave; Chaves Ave; St Croix Dr; Knockash Hill; Farview Ct; Alviso St; Lopez Ave; Dorcas Way; Devonshire Way; Fowler Ave; Valletta Ct; Marne Ave; Verna St; Amethyst Way; Santa Rita Ave; Sunview Dr; Automobile Pathway; Sydney Way; Linares Ave; Onique Ln; Encline Ct; Clarendon Woods Ave; Longview Ct; Lakewood Ave; Terrace Walk; Ventura Ave; del Sur Ave; la Bica Way; Rockwood Ct; Cuesta Ct (Portola Dr, Market St); Foerster; Gaviota Way; Vista Ln; Romain St; Diamond St; Crags Ct; Omar Way; Copper Aly; Ashwood Ln; Oakhurst Ln; Monticello St; Blairwood Ln; Clairview Ct; Lippard Ave; Coventry Ct (Coventry Ln); Fredela Ln; Gatun Aly; Lulu Aly; Cortes Ave; Vista Verde Ct; Nordhoff St; Northgate Dr; Brompton Ave; el Plazuela St (el Plazuela Way); San Ramon Way; Acadia St; Woodhaven Ct; Fenton Ln; Elmwood Way; Burnside Ave; Golding Ln; Chilton Ave; Legion Ct; Argent Aly; Dixie Aly; Mountview Ct; 31st St; Glendale St; Hamerton Ave; Pizarro Way; Perego Ter; Quartz Way; Rio Ct; 23rd St; Verdun Way; Adolph Sutro Ct; Path St; Iron Aly; Forest Hill Path; Paulding St; Burnett North Ave; Hopkins Ave; Sola Ave; Pico Ave; Greenview Ct; Glenhaven Ln; Avoca Aly; Mesa Ave; Portal Path; Isola Way; Coralino Ln; Bengal Aly; Baxter Aly; Ludlow Aly; 15th Ave; Ingleside Path; Rex Ave; Lake Forest Ct; Sherwood Ct; Waithman Way; Hillcrest Ct; Globe Aly; Morgan Aly; N Burnett Ave; Jade Pl; Lori Ln; Lunado Ct; Homewood Ct; Plaza St; Calvert Dr; Clarkson St; Clipper St; Cragmont Ave; Opalo Ln; Mercato Ct; Grand View Ave.
Twin Peaks West neighborhood detailed profile
Union Square neighborhood in San Francisco statistics: (Find on map)
Area: 0.006 square miles
Population: 20
Population density:
Median household income in 2021:
Median rent in in 2021:
Male vs Females
Median age
Average estimated '21 value of housing units in 5-or-more-unit structures (70.0% of all units):
Most popular occupations of males: sales and office occupations (46.1%); education, training, and library occupations (31.4%); service occupations (28.9%); production occupations (24.7%); construction, extraction, and maintenance occupations (13.7%); arts, design, entertainment, sports, and media occupations (10.0%); life, physical, and social science occupations (9.7%)
Most popular occupations of females: service occupations (43.4%); sales and office occupations (29.9%); production occupations (9.7%); healthcare practitioners and technical occupations (9.3%); legal occupations (8.8%); education, training, and library occupations (7.7%)
Roads and streets: Stockton St.
Union Square neighborhood detailed profile
Area: 0.006 square miles
Population: 20
Population density:
| Union Square: | 3,383 people per square mile |
| San Francisco: | 17,458 people per square mile |
Median household income in 2021:
| Union Square: | $96,154 |
| San Francisco: | $121,826 |
Median rent in in 2021:
| Union Square: | $787 |
| San Francisco: | $2,001 |
Male vs Females
| Males: | 11 |
| Females: | 8 |
Median age
| Males: | 45.1 years |
| Females: | 40.3 years |
Average estimated '21 value of housing units in 5-or-more-unit structures (70.0% of all units):
| Union Square: | $426,826 |
| San Francisco: | $1,317,001 |
Most popular occupations of males: sales and office occupations (46.1%); education, training, and library occupations (31.4%); service occupations (28.9%); production occupations (24.7%); construction, extraction, and maintenance occupations (13.7%); arts, design, entertainment, sports, and media occupations (10.0%); life, physical, and social science occupations (9.7%)
Most popular occupations of females: service occupations (43.4%); sales and office occupations (29.9%); production occupations (9.7%); healthcare practitioners and technical occupations (9.3%); legal occupations (8.8%); education, training, and library occupations (7.7%)
Roads and streets: Stockton St.
Union Square neighborhood detailed profile
Upper Market neighborhood in San Francisco statistics: (Find on map)
Area: 0.129 square miles
Population: 668
Population density:
Median household income in 2021:
Median rent in in 2021:
Male vs Females
Median age
Housing prices:
Average estimated value of detached houses in 2021 (70.1% of all units):
Average estimated value of townhouses or other attached units in 2021 (11.1% of all units):
Average estimated value of housing units in 2-unit structures in 2021 (26.8% of all units):
Average estimated '21 value of housing units in 3-to-4-unit structures (100.0% of all units):
Average estimated '21 value of housing units in 5-or-more-unit structures (20.4% of all units):
Most popular occupations of males: community and social services occupations (20.7%); management occupations (except farmers) (13.6%); material moving occupations (9.7%); legal occupations (9.6%); sales and office occupations (9.6%); computer and mathematical occupations (7.2%); architecture and engineering occupations (5.9%)
Most popular occupations of females: management occupations (except farmers) (25.8%); healthcare practitioners and technical occupations (20.6%); service occupations (13.9%); community and social services occupations (13.6%); legal occupations (7.6%); education, training, and library occupations (7.4%); arts, design, entertainment, sports, and media occupations (6.9%)
Roads and streets: Burnett Ave; Corbett Ave; Gardenside Dr; Golding Ln (Market St); Graystone Ter; Cuesta Ct (Portola Dr, Market St); Romain St; Portola Dr; Parkridge Dr; Fenton Ln; Golding Ln; Argent Aly; Perego Ter; Copper Aly; Iron Aly; Burnett North Ave; Hopkins Ave; 23rd St; Vista Ln; Dixie Aly; Glenview Dr; N Burnett Ave; Glendale St.
Upper Market neighborhood detailed profile
Area: 0.129 square miles
Population: 668
Population density:
| Upper Market: | 5,160 people per square mile |
| San Francisco: | 17,458 people per square mile |
Median household income in 2021:
| Upper Market: | $168,680 |
| San Francisco: | $121,826 |
Median rent in in 2021:
| Upper Market: | $3,140 |
| San Francisco: | $2,001 |
Male vs Females
| Males: | 346 |
| Females: | 321 |
Median age
| Males: | 45.8 years |
| Females: | 44.6 years |
Housing prices:
Average estimated value of detached houses in 2021 (70.1% of all units):
| Upper Market: | $1,966,808 |
| San Francisco: | $1,815,784 |
Average estimated value of townhouses or other attached units in 2021 (11.1% of all units):
| This neighborhood: | $2,172,193 |
| city: | $1,506,493 |
Average estimated value of housing units in 2-unit structures in 2021 (26.8% of all units):
| This neighborhood: | $1,487,500 |
| San Francisco: | $1,685,431 |
Average estimated '21 value of housing units in 3-to-4-unit structures (100.0% of all units):
| Upper Market: | $1,558,696 |
| city: | $1,521,789 |
Average estimated '21 value of housing units in 5-or-more-unit structures (20.4% of all units):
| Upper Market: | $857,143 |
| San Francisco: | $1,317,001 |
Most popular occupations of males: community and social services occupations (20.7%); management occupations (except farmers) (13.6%); material moving occupations (9.7%); legal occupations (9.6%); sales and office occupations (9.6%); computer and mathematical occupations (7.2%); architecture and engineering occupations (5.9%)
Most popular occupations of females: management occupations (except farmers) (25.8%); healthcare practitioners and technical occupations (20.6%); service occupations (13.9%); community and social services occupations (13.6%); legal occupations (7.6%); education, training, and library occupations (7.4%); arts, design, entertainment, sports, and media occupations (6.9%)
Roads and streets: Burnett Ave; Corbett Ave; Gardenside Dr; Golding Ln (Market St); Graystone Ter; Cuesta Ct (Portola Dr, Market St); Romain St; Portola Dr; Parkridge Dr; Fenton Ln; Golding Ln; Argent Aly; Perego Ter; Copper Aly; Iron Aly; Burnett North Ave; Hopkins Ave; 23rd St; Vista Ln; Dixie Aly; Glenview Dr; N Burnett Ave; Glendale St.
Upper Market neighborhood detailed profile
Van Ness neighborhood in San Francisco statistics: (Find on map)
Area: 0.376 square miles
Population: 10,092
Population density:
Median household income in 2021:
Median rent in in 2021:
Male vs Females
Median age
Most popular occupations of males: computer and mathematical occupations (26.0%); business and financial operations occupations (21.6%); management occupations (except farmers) (19.7%); sales and office occupations (11.1%); service occupations (6.9%); arts, design, entertainment, sports, and media occupations (3.3%); architecture and engineering occupations (2.6%)
Most popular occupations of females: management occupations (except farmers) (23.6%); sales and office occupations (21.2%); business and financial operations occupations (15.8%); service occupations (10.3%); computer and mathematical occupations (9.0%); education, training, and library occupations (5.2%); arts, design, entertainment, sports, and media occupations (4.8%)
Highways in this neighborhood: US Hwy 101 (Van Ness Ave).
Roads and streets: Market St; Gough St; Franklin St; McAllister St; Polk St; Grove St; Hayes St; Fell St; Ellis St; Sutter St; Post St; Bush St; Pine St; Turk Blvd (Turk St); Eddy St; Fulton St; Golden Gate Ave; Willow St; Fern St; Austin St; Geary Blvd; Ofarrell St; Ivy St; Hickory St; Oak St; Elm St; Alice B Toklas Pl (Myrtle St); Olive St; Hemlock St; Larkin St; Redwood St; Page St; Hyde St; Starr King Way; Peter Yorke Way; Dr Carlton P Goodlett Pl; Geary St; Linden St; Lily St; Larch St; Cedar St; Ash St; Rose St; Leavenworth St; 7th St; Haight St; Jones St.
Van Ness neighborhood detailed profile
Area: 0.376 square miles
Population: 10,092
Population density:
| Van Ness: | 26,851 people per square mile |
| San Francisco: | 17,458 people per square mile |
Median household income in 2021:
| Van Ness: | $119,889 |
| San Francisco: | $121,826 |
Median rent in in 2021:
| Van Ness: | $2,126 |
| San Francisco: | $2,001 |
Male vs Females
| Males: | 5,784 |
| Females: | 4,307 |
Median age
| Males: | 47.8 years |
| Females: | 46.9 years |
Most popular occupations of males: computer and mathematical occupations (26.0%); business and financial operations occupations (21.6%); management occupations (except farmers) (19.7%); sales and office occupations (11.1%); service occupations (6.9%); arts, design, entertainment, sports, and media occupations (3.3%); architecture and engineering occupations (2.6%)
Most popular occupations of females: management occupations (except farmers) (23.6%); sales and office occupations (21.2%); business and financial operations occupations (15.8%); service occupations (10.3%); computer and mathematical occupations (9.0%); education, training, and library occupations (5.2%); arts, design, entertainment, sports, and media occupations (4.8%)
Highways in this neighborhood: US Hwy 101 (Van Ness Ave).
Roads and streets: Market St; Gough St; Franklin St; McAllister St; Polk St; Grove St; Hayes St; Fell St; Ellis St; Sutter St; Post St; Bush St; Pine St; Turk Blvd (Turk St); Eddy St; Fulton St; Golden Gate Ave; Willow St; Fern St; Austin St; Geary Blvd; Ofarrell St; Ivy St; Hickory St; Oak St; Elm St; Alice B Toklas Pl (Myrtle St); Olive St; Hemlock St; Larkin St; Redwood St; Page St; Hyde St; Starr King Way; Peter Yorke Way; Dr Carlton P Goodlett Pl; Geary St; Linden St; Lily St; Larch St; Cedar St; Ash St; Rose St; Leavenworth St; 7th St; Haight St; Jones St.
Van Ness neighborhood detailed profile
Visitacion Valley neighborhood in San Francisco statistics: (Find on map)
Area: 1.258 square miles
Population: 31,924
Population density:
Median household income in 2021:
Median rent in in 2021:
Male vs Females
Median age
Housing prices:
Average estimated value of detached houses in 2021 (46.3% of all units):
Average estimated value of townhouses or other attached units in 2021 (28.7% of all units):
Average estimated value of housing units in 2-unit structures in 2021 (8.4% of all units):
Most popular occupations of males: service occupations (20.7%); sales and office occupations (20.7%); transportation occupations (10.6%); construction, extraction, and maintenance occupations (8.1%); management occupations (except farmers) (7.6%); material moving occupations (6.2%); business and financial operations occupations (4.9%)
Most popular occupations of females: service occupations (35.8%); sales and office occupations (26.7%); management occupations (except farmers) (6.2%); business and financial operations occupations (5.7%); production occupations (5.4%); education, training, and library occupations (3.5%); healthcare practitioners and technical occupations (3.5%)
Limited-access highways (interstate or state) in this neighborhood: US Hwy 101 (James Lick Fwy).
Roads and streets: Mansell St; Visitacion Ave; Bay Shore Blvd; Sunnydale Ave; San Bruno Ave; Raymond Ave; Leland Ave; Campbell Ave; Delta St; Geneva Ave; Teddy Ave; Arleta Ave; Rutland St; Wilde Ave; Goettingen St; Brussels St; Velasco Ave; Harkness Ave; Olmstead St; Girard St; Brookdale Ave; Sawyer St; Blanken Ave; Blythdale Ave; Alpha St; Schwerin St; Tioga Ave; Lathrop Ave; Hester Ave; Tucker Ave; Hahn St; Tunnel Ave; Santos St; Argonaut Ave; Tocoloma Ave; Ordway St; Peabody St; Desmond St; Wheeler Ave; Talbert St; Peninsula Ave; Parque Dr; Ward St; Garrison Ave; Ankeny St; Cora St; Elliot St; Rey St; Nueva Ave; Somerset St; Colby St; Wabash Ter; Racine Ln; Kelloch Ave; Lois Ln; Gillette Ave; Britton St; Loehr St; Bowdoin St; Sunrise Way; Dartmouth St; Mill St; Pasadena St; Ervine St; Esquina Dr; Carrizal St; Cielito Dr; Alder St; University St; Castillo St; Nelson Ave; Bishop St; Tomaso Ct; Fratessa Ct; Olney Ave; Melra Ct; Alana Way; Carter St; Pueblo St; Holyoke St; Sparta St; McCarthy Ave; Ware St; Keith St; Hamilton St; Burr Ave; Calgary St; Nibbi Ct; Bayview Park Rd; 3rd St; Meade Ave; Salinas Ave; Beeman Ln; Rio Verde St; McKinley Ave; Key Ave; Alberta St; Le Conte Ave.
Railroad features: Caltrain (Union Pacific RR).
Visitacion Valley neighborhood detailed profile
Area: 1.258 square miles
Population: 31,924
Population density:
| Visitacion Valley: | 25,386 people per square mile |
| San Francisco: | 17,458 people per square mile |
Median household income in 2021:
| Visitacion Valley: | $84,483 |
| San Francisco: | $121,826 |
Median rent in in 2021:
| Visitacion Valley: | $1,606 |
| San Francisco: | $2,001 |
Male vs Females
| Males: | 15,971 |
| Females: | 15,953 |
Median age
| Males: | 40.4 years |
| Females: | 44.9 years |
Housing prices:
Average estimated value of detached houses in 2021 (46.3% of all units):
| Visitacion Valley: | $911,806 |
| San Francisco: | $1,815,784 |
Average estimated value of townhouses or other attached units in 2021 (28.7% of all units):
| This neighborhood: | $1,371,276 |
| city: | $1,506,493 |
Average estimated value of housing units in 2-unit structures in 2021 (8.4% of all units):
| This neighborhood: | $646,124 |
| San Francisco: | $1,685,431 |
Most popular occupations of males: service occupations (20.7%); sales and office occupations (20.7%); transportation occupations (10.6%); construction, extraction, and maintenance occupations (8.1%); management occupations (except farmers) (7.6%); material moving occupations (6.2%); business and financial operations occupations (4.9%)
Most popular occupations of females: service occupations (35.8%); sales and office occupations (26.7%); management occupations (except farmers) (6.2%); business and financial operations occupations (5.7%); production occupations (5.4%); education, training, and library occupations (3.5%); healthcare practitioners and technical occupations (3.5%)
Limited-access highways (interstate or state) in this neighborhood: US Hwy 101 (James Lick Fwy).
Roads and streets: Mansell St; Visitacion Ave; Bay Shore Blvd; Sunnydale Ave; San Bruno Ave; Raymond Ave; Leland Ave; Campbell Ave; Delta St; Geneva Ave; Teddy Ave; Arleta Ave; Rutland St; Wilde Ave; Goettingen St; Brussels St; Velasco Ave; Harkness Ave; Olmstead St; Girard St; Brookdale Ave; Sawyer St; Blanken Ave; Blythdale Ave; Alpha St; Schwerin St; Tioga Ave; Lathrop Ave; Hester Ave; Tucker Ave; Hahn St; Tunnel Ave; Santos St; Argonaut Ave; Tocoloma Ave; Ordway St; Peabody St; Desmond St; Wheeler Ave; Talbert St; Peninsula Ave; Parque Dr; Ward St; Garrison Ave; Ankeny St; Cora St; Elliot St; Rey St; Nueva Ave; Somerset St; Colby St; Wabash Ter; Racine Ln; Kelloch Ave; Lois Ln; Gillette Ave; Britton St; Loehr St; Bowdoin St; Sunrise Way; Dartmouth St; Mill St; Pasadena St; Ervine St; Esquina Dr; Carrizal St; Cielito Dr; Alder St; University St; Castillo St; Nelson Ave; Bishop St; Tomaso Ct; Fratessa Ct; Olney Ave; Melra Ct; Alana Way; Carter St; Pueblo St; Holyoke St; Sparta St; McCarthy Ave; Ware St; Keith St; Hamilton St; Burr Ave; Calgary St; Nibbi Ct; Bayview Park Rd; 3rd St; Meade Ave; Salinas Ave; Beeman Ln; Rio Verde St; McKinley Ave; Key Ave; Alberta St; Le Conte Ave.
Railroad features: Caltrain (Union Pacific RR).
Visitacion Valley neighborhood detailed profile
West Portal neighborhood in San Francisco statistics: (Find on map)
Area: 0.226 square miles
Population: 3,074
Population density:
Median household income in 2021:
Median rent in in 2021:
Male vs Females
Median age
Housing prices:
Average estimated value of detached houses in 2021 (60.9% of all units):
Average estimated value of townhouses or other attached units in 2021 (15.2% of all units):
Average estimated '21 value of housing units in 5-or-more-unit structures (11.3% of all units):
Most popular occupations of males: management occupations (except farmers) (17.6%); computer and mathematical occupations (14.5%); sales and office occupations (10.8%); business and financial operations occupations (10.2%); service occupations (7.5%); legal occupations (6.1%); education, training, and library occupations (5.2%)
Most popular occupations of females: sales and office occupations (23.3%); arts, design, entertainment, sports, and media occupations (14.7%); management occupations (except farmers) (14.5%); business and financial operations occupations (11.1%); service occupations (7.1%); education, training, and library occupations (6.9%); computer and mathematical occupations (5.2%)
Roads and streets: W Portal Ave; Ulloa St; Wawona St; Taraval St; Kensington Way; 14th Ave; Forest Side Ave; Madrone Ave; Granville Way; Claremont Blvd; Vicente St; Lenox Way; Allston Way; Briarcliff Ter; Funston Ave; Dorchester Way; Verdun Way; 15th Ave.
West Portal neighborhood detailed profile
Area: 0.226 square miles
Population: 3,074
Population density:
| West Portal: | 13,580 people per square mile |
| San Francisco: | 17,458 people per square mile |
Median household income in 2021:
| West Portal: | $162,923 |
| San Francisco: | $121,826 |
Median rent in in 2021:
| West Portal: | $2,943 |
| San Francisco: | $2,001 |
Male vs Females
| Males: | 1,460 |
| Females: | 1,614 |
Median age
| Males: | 48.6 years |
| Females: | 47.8 years |
Housing prices:
Average estimated value of detached houses in 2021 (60.9% of all units):
| West Portal: | $1,967,245 |
| San Francisco: | $1,815,784 |
Average estimated value of townhouses or other attached units in 2021 (15.2% of all units):
| This neighborhood: | $1,580,835 |
| city: | $1,506,493 |
Average estimated '21 value of housing units in 5-or-more-unit structures (11.3% of all units):
| West Portal: | $866,897 |
| San Francisco: | $1,317,001 |
Most popular occupations of males: management occupations (except farmers) (17.6%); computer and mathematical occupations (14.5%); sales and office occupations (10.8%); business and financial operations occupations (10.2%); service occupations (7.5%); legal occupations (6.1%); education, training, and library occupations (5.2%)
Most popular occupations of females: sales and office occupations (23.3%); arts, design, entertainment, sports, and media occupations (14.7%); management occupations (except farmers) (14.5%); business and financial operations occupations (11.1%); service occupations (7.1%); education, training, and library occupations (6.9%); computer and mathematical occupations (5.2%)
Roads and streets: W Portal Ave; Ulloa St; Wawona St; Taraval St; Kensington Way; 14th Ave; Forest Side Ave; Madrone Ave; Granville Way; Claremont Blvd; Vicente St; Lenox Way; Allston Way; Briarcliff Ter; Funston Ave; Dorchester Way; Verdun Way; 15th Ave.
West Portal neighborhood detailed profile
West of Twin Peaks neighborhood in San Francisco statistics: (Find on map)
Area: 0.465 square miles
Population: 5,063
Population density:
Median household income in 2021:
Median rent in in 2021:
Male vs Females
Median age
Housing prices:
Average estimated value of detached houses in 2021 (81.7% of all units):
Average estimated value of townhouses or other attached units in 2021 (17.3% of all units):
Average estimated value of housing units in 2-unit structures in 2021 (4.9% of all units):
Average estimated '21 value of housing units in 5-or-more-unit structures (12.0% of all units):
Most popular occupations of males: computer and mathematical occupations (14.9%); management occupations (except farmers) (14.8%); sales and office occupations (13.8%); business and financial operations occupations (11.0%); legal occupations (9.0%); education, training, and library occupations (7.9%); healthcare practitioners and technical occupations (7.5%)
Most popular occupations of females: sales and office occupations (18.2%); healthcare practitioners and technical occupations (17.0%); business and financial operations occupations (12.1%); management occupations (except farmers) (11.2%); legal occupations (10.0%); arts, design, entertainment, sports, and media occupations (7.2%); education, training, and library occupations (6.5%)
Roads and streets: Laguna Honda Blvd; Portola Dr; Woodside Ave; Pacheco St; Magellan Ave; Castenada Ave; Idora Ave; Ulloa St; Edgehill Way; 9th Ave; Vasquez Ave; Garcia Ave; Kensington Way; Dewey Blvd; Hernandez Ave; Merced Ave; Dorantes Ave; Mendosa Ave; Rockaway Ave; San Marcos Ave; Montalvo Ave; Alton Ave; Sotelo Ave; Balceta Ave; Marcela Ave; Knockash Hill; Lopez Ave; Santa Rita Ave; Automobile Pathway; Sydney Way; Ventura Ave; Rockwood Ct; Linares Ave; 8th Ave; Path St; Forest Hill Path; Sola Ave; Mesa Ave; Waithman Way; Plaza St; Gateview Ct.
West of Twin Peaks neighborhood detailed profile
Area: 0.465 square miles
Population: 5,063
Population density:
| West of Twin Peaks: | 10,889 people per square mile |
| San Francisco: | 17,458 people per square mile |
Median household income in 2021:
| West of Twin Peaks: | $186,536 |
| San Francisco: | $121,826 |
Median rent in in 2021:
| West of Twin Peaks: | $2,283 |
| San Francisco: | $2,001 |
Male vs Females
| Males: | 2,539 |
| Females: | 2,524 |
Median age
| Males: | 47.2 years |
| Females: | 48.7 years |
Housing prices:
Average estimated value of detached houses in 2021 (81.7% of all units):
| West of Twin Peaks: | $2,005,294 |
| San Francisco: | $1,815,784 |
Average estimated value of townhouses or other attached units in 2021 (17.3% of all units):
| This neighborhood: | $1,586,364 |
| city: | $1,506,493 |
Average estimated value of housing units in 2-unit structures in 2021 (4.9% of all units):
| This neighborhood: | $9,484,674 |
| San Francisco: | $1,685,431 |
Average estimated '21 value of housing units in 5-or-more-unit structures (12.0% of all units):
| West of Twin Peaks: | $545,467 |
| San Francisco: | $1,317,001 |
Most popular occupations of males: computer and mathematical occupations (14.9%); management occupations (except farmers) (14.8%); sales and office occupations (13.8%); business and financial operations occupations (11.0%); legal occupations (9.0%); education, training, and library occupations (7.9%); healthcare practitioners and technical occupations (7.5%)
Most popular occupations of females: sales and office occupations (18.2%); healthcare practitioners and technical occupations (17.0%); business and financial operations occupations (12.1%); management occupations (except farmers) (11.2%); legal occupations (10.0%); arts, design, entertainment, sports, and media occupations (7.2%); education, training, and library occupations (6.5%)
Roads and streets: Laguna Honda Blvd; Portola Dr; Woodside Ave; Pacheco St; Magellan Ave; Castenada Ave; Idora Ave; Ulloa St; Edgehill Way; 9th Ave; Vasquez Ave; Garcia Ave; Kensington Way; Dewey Blvd; Hernandez Ave; Merced Ave; Dorantes Ave; Mendosa Ave; Rockaway Ave; San Marcos Ave; Montalvo Ave; Alton Ave; Sotelo Ave; Balceta Ave; Marcela Ave; Knockash Hill; Lopez Ave; Santa Rita Ave; Automobile Pathway; Sydney Way; Ventura Ave; Rockwood Ct; Linares Ave; 8th Ave; Path St; Forest Hill Path; Sola Ave; Mesa Ave; Waithman Way; Plaza St; Gateview Ct.
West of Twin Peaks neighborhood detailed profile
Western Addition neighborhood in San Francisco statistics: (Find on map)
Area: 0.368 square miles
Population: 9,651
Population density:
Median household income in 2021:
Median rent in in 2021:
Male vs Females
Median age
Most popular occupations of males: management occupations (except farmers) (24.1%); business and financial operations occupations (14.5%); service occupations (12.4%); production occupations (8.4%); arts, design, entertainment, sports, and media occupations (7.9%); computer and mathematical occupations (7.8%); sales and office occupations (6.4%)
Most popular occupations of females: arts, design, entertainment, sports, and media occupations (28.9%); service occupations (21.7%); management occupations (except farmers) (15.3%); sales and office occupations (10.3%); computer and mathematical occupations (7.7%); business and financial operations occupations (5.2%); legal occupations (4.0%)
Roads and streets: Geary Blvd; Webster St; Golden Gate Ave; Turk Blvd (Turk St); Eddy St; Ellis St; Ofarrell St; McAllister St; Fillmore St; Divisadero St; Laguna St; Fulton St; Buchanan St; Steiner St; Scott St; Pierce St; Ash St; Western Shore Ln; Cleary Ct; Octavia St; Byington St; Willow St; Zampa Ln; Larch St; Beideman St; Seymour St; Farren St; Hollis St; Galilee Ln; Elm St; Inca Ln; Quickstep Ln; Friendship Ct; Bertie Manor Ln (Bertie Minor Ln); Lottie Bennett Ln; Folger Aly; Redwood St.
Western Addition neighborhood detailed profile
Area: 0.368 square miles
Population: 9,651
Population density:
| Western Addition: | 26,237 people per square mile |
| San Francisco: | 17,458 people per square mile |
Median household income in 2021:
| Western Addition: | $119,188 |
| San Francisco: | $121,826 |
Median rent in in 2021:
| Western Addition: | $1,552 |
| San Francisco: | $2,001 |
Male vs Females
| Males: | 5,126 |
| Females: | 4,525 |
Median age
| Males: | 44.9 years |
| Females: | 47.1 years |
Most popular occupations of males: management occupations (except farmers) (24.1%); business and financial operations occupations (14.5%); service occupations (12.4%); production occupations (8.4%); arts, design, entertainment, sports, and media occupations (7.9%); computer and mathematical occupations (7.8%); sales and office occupations (6.4%)
Most popular occupations of females: arts, design, entertainment, sports, and media occupations (28.9%); service occupations (21.7%); management occupations (except farmers) (15.3%); sales and office occupations (10.3%); computer and mathematical occupations (7.7%); business and financial operations occupations (5.2%); legal occupations (4.0%)
Roads and streets: Geary Blvd; Webster St; Golden Gate Ave; Turk Blvd (Turk St); Eddy St; Ellis St; Ofarrell St; McAllister St; Fillmore St; Divisadero St; Laguna St; Fulton St; Buchanan St; Steiner St; Scott St; Pierce St; Ash St; Western Shore Ln; Cleary Ct; Octavia St; Byington St; Willow St; Zampa Ln; Larch St; Beideman St; Seymour St; Farren St; Hollis St; Galilee Ln; Elm St; Inca Ln; Quickstep Ln; Friendship Ct; Bertie Manor Ln (Bertie Minor Ln); Lottie Bennett Ln; Folger Aly; Redwood St.
Western Addition neighborhood detailed profile
Westwood Highlands neighborhood in San Francisco statistics: (Find on map)
Area: 0.142 square miles
Population: 1,678
Population density:
Median household income in 2021:
Median rent in in 2021:
Male vs Females
Median age
Housing prices:
Average estimated value of detached houses in 2021 (86.8% of all units):
Average estimated value of townhouses or other attached units in 2021 (19.0% of all units):
Most popular occupations of males: management occupations (except farmers) (33.0%); sales and office occupations (18.6%); education, training, and library occupations (13.5%); healthcare practitioners and technical occupations (11.6%); computer and mathematical occupations (7.5%); arts, design, entertainment, sports, and media occupations (2.7%); legal occupations (2.2%)
Most popular occupations of females: sales and office occupations (21.2%); business and financial operations occupations (16.5%); healthcare practitioners and technical occupations (14.5%); management occupations (except farmers) (11.1%); service occupations (10.3%); community and social services occupations (5.2%); arts, design, entertainment, sports, and media occupations (4.8%)
Roads and streets: Monterey Blvd; Los Palmos Dr; Cresta Vista Dr; Brentwood Ave; Hazelwood Ave; Mangels Ave; Melrose Ave; Colon Ave; Valdez Ave; Burlwood Dr; Joost Ave; Ridgewood Ave; Lulu Aly; Plymouth Ave; Bella Vista Way; Stanford Heights Ave.
Westwood Highlands neighborhood detailed profile
Area: 0.142 square miles
Population: 1,678
Population density:
| Westwood Highlands: | 11,833 people per square mile |
| San Francisco: | 17,458 people per square mile |
Median household income in 2021:
| Westwood Highlands: | $154,971 |
| San Francisco: | $121,826 |
Median rent in in 2021:
| Westwood Highlands: | $3,442 |
| San Francisco: | $2,001 |
Male vs Females
| Males: | 922 |
| Females: | 756 |
Median age
| Males: | 43.5 years |
| Females: | 47.9 years |
Housing prices:
Average estimated value of detached houses in 2021 (86.8% of all units):
| Westwood Highlands: | $1,517,735 |
| San Francisco: | $1,815,784 |
Average estimated value of townhouses or other attached units in 2021 (19.0% of all units):
| This neighborhood: | $1,292,292 |
| city: | $1,506,493 |
Most popular occupations of males: management occupations (except farmers) (33.0%); sales and office occupations (18.6%); education, training, and library occupations (13.5%); healthcare practitioners and technical occupations (11.6%); computer and mathematical occupations (7.5%); arts, design, entertainment, sports, and media occupations (2.7%); legal occupations (2.2%)
Most popular occupations of females: sales and office occupations (21.2%); business and financial operations occupations (16.5%); healthcare practitioners and technical occupations (14.5%); management occupations (except farmers) (11.1%); service occupations (10.3%); community and social services occupations (5.2%); arts, design, entertainment, sports, and media occupations (4.8%)
Roads and streets: Monterey Blvd; Los Palmos Dr; Cresta Vista Dr; Brentwood Ave; Hazelwood Ave; Mangels Ave; Melrose Ave; Colon Ave; Valdez Ave; Burlwood Dr; Joost Ave; Ridgewood Ave; Lulu Aly; Plymouth Ave; Bella Vista Way; Stanford Heights Ave.
Westwood Highlands neighborhood detailed profile
Westwood Park neighborhood in San Francisco statistics: (Find on map)
Area: 0.198 square miles
Population: 2,427
Population density:
Median household income in 2021:
Median rent in in 2021:
Male vs Females
Median age
Housing prices:
Average estimated value of detached houses in 2021 (59.4% of all units):
Average estimated value of townhouses or other attached units in 2021 (7.1% of all units):
Most popular occupations of males: management occupations (except farmers) (19.5%); sales and office occupations (16.1%); business and financial operations occupations (13.7%); healthcare practitioners and technical occupations (8.5%); computer and mathematical occupations (6.7%); arts, design, entertainment, sports, and media occupations (6.2%); life, physical, and social science occupations (5.1%)
Most popular occupations of females: sales and office occupations (23.6%); management occupations (except farmers) (13.1%); computer and mathematical occupations (11.8%); service occupations (11.6%); business and financial operations occupations (9.5%); community and social services occupations (7.8%); healthcare practitioners and technical occupations (7.4%)
Roads and streets: Miramar Ave; Plymouth Ave; Eastwood Dr; Westwood Dr; Northwood Dr; Southwood Dr; Montecito Ave; Wildwood Way; Greenwood Ave; Hazelwood Ave; Judson Ave; Colon Ave; San Ramon Way; Valdez Ave; Faxon Ave; Ridgewood Ave; Elmwood Way; Pizarro Way; Flood Ave.
Westwood Park neighborhood detailed profile
Area: 0.198 square miles
Population: 2,427
Population density:
| Westwood Park: | 12,261 people per square mile |
| San Francisco: | 17,458 people per square mile |
Median household income in 2021:
| Westwood Park: | $135,164 |
| San Francisco: | $121,826 |
Median rent in in 2021:
| Westwood Park: | $2,743 |
| San Francisco: | $2,001 |
Male vs Females
| Males: | 1,167 |
| Females: | 1,259 |
Median age
| Males: | 45.3 years |
| Females: | 47.1 years |
Housing prices:
Average estimated value of detached houses in 2021 (59.4% of all units):
| Westwood Park: | $1,158,147 |
| San Francisco: | $1,815,784 |
Average estimated value of townhouses or other attached units in 2021 (7.1% of all units):
| This neighborhood: | $1,090,228 |
| city: | $1,506,493 |
Most popular occupations of males: management occupations (except farmers) (19.5%); sales and office occupations (16.1%); business and financial operations occupations (13.7%); healthcare practitioners and technical occupations (8.5%); computer and mathematical occupations (6.7%); arts, design, entertainment, sports, and media occupations (6.2%); life, physical, and social science occupations (5.1%)
Most popular occupations of females: sales and office occupations (23.6%); management occupations (except farmers) (13.1%); computer and mathematical occupations (11.8%); service occupations (11.6%); business and financial operations occupations (9.5%); community and social services occupations (7.8%); healthcare practitioners and technical occupations (7.4%)
Roads and streets: Miramar Ave; Plymouth Ave; Eastwood Dr; Westwood Dr; Northwood Dr; Southwood Dr; Montecito Ave; Wildwood Way; Greenwood Ave; Hazelwood Ave; Judson Ave; Colon Ave; San Ramon Way; Valdez Ave; Faxon Ave; Ridgewood Ave; Elmwood Way; Pizarro Way; Flood Ave.
Westwood Park neighborhood detailed profile
Yerba Buena Island neighborhood in San Francisco statistics: (Find on map)
Area: 0.245 square miles
Limited-access highways (interstate or state) in this neighborhood: I- 80 (Bay Brg).
Roads and streets: Treasure Island Rd; Macalla Rd; N Gate Rd; Yerba Buena Dr; Yerba Buena Rd; Army Rd; Healy Ave; Hillcrest Rd; Forest Rd; Nimitz Dr; Whiting Way; Sims Rd; Harriet Ln; Navy Cir; Nimitz Ln; S Gate Rd; Fresnel Way; Garden Way; Macalla Ct; Navy Rd; Reservoir Rd; Signal Rd; 1st St; Spindrift Cir; 3rd St; 4th St; 5th St; Sims Ct.
Yerba Buena Island neighborhood detailed profile
Zion District neighborhood in San Francisco statistics: (Find on map)
Area: 0.240 square miles
Population: 5,051
Population density:
Median household income in 2021:
Median rent in in 2021:
Male vs Females
Median age
Housing prices:
Average estimated value of detached houses in 2021 (9.5% of all units):
Average estimated value of townhouses or other attached units in 2021 (6.3% of all units):
Average estimated value of housing units in 2-unit structures in 2021 (5.1% of all units):
Average estimated '21 value of housing units in 3-to-4-unit structures (20.8% of all units):
Average estimated '21 value of housing units in 5-or-more-unit structures (37.0% of all units):
Most popular occupations of males: business and financial operations occupations (23.2%); management occupations (except farmers) (16.1%); sales and office occupations (15.2%); arts, design, entertainment, sports, and media occupations (12.6%); computer and mathematical occupations (10.2%); construction, extraction, and maintenance occupations (4.7%); architecture and engineering occupations (4.5%)
Most popular occupations of females: business and financial operations occupations (31.7%); management occupations (except farmers) (18.9%); sales and office occupations (18.0%); healthcare practitioners and technical occupations (7.9%); education, training, and library occupations (6.2%); arts, design, entertainment, sports, and media occupations (3.6%); legal occupations (2.9%)
Roads and streets: Geary Blvd; Pine St; Bush St; Post St; Sutter St; Divisadero St; Broderick St; Baker St; Lyon St; Fillmore St; Scott St; Steiner St; Pierce St; Wilmot St; Garden St; Leona Ter; Avery St; Erkson Ct.
Zion District neighborhood detailed profile
Area: 0.240 square miles
Population: 5,051
Population density:
| Zion District: | 21,050 people per square mile |
| San Francisco: | 17,458 people per square mile |
Median household income in 2021:
| Zion District: | $107,127 |
| San Francisco: | $121,826 |
Median rent in in 2021:
| Zion District: | $2,447 |
| San Francisco: | $2,001 |
Male vs Females
| Males: | 2,720 |
| Females: | 2,331 |
Median age
| Males: | 43.7 years |
| Females: | 45.1 years |
Housing prices:
Average estimated value of detached houses in 2021 (9.5% of all units):
| Zion District: | $6,110,655 |
| San Francisco: | $1,815,784 |
Average estimated value of townhouses or other attached units in 2021 (6.3% of all units):
| This neighborhood: | $4,014,286 |
| city: | $1,506,493 |
Average estimated value of housing units in 2-unit structures in 2021 (5.1% of all units):
| This neighborhood: | $3,240,870 |
| San Francisco: | $1,685,431 |
Average estimated '21 value of housing units in 3-to-4-unit structures (20.8% of all units):
| Zion District: | $2,010,000 |
| city: | $1,521,789 |
Average estimated '21 value of housing units in 5-or-more-unit structures (37.0% of all units):
| Zion District: | $1,860,680 |
| San Francisco: | $1,317,001 |
Most popular occupations of males: business and financial operations occupations (23.2%); management occupations (except farmers) (16.1%); sales and office occupations (15.2%); arts, design, entertainment, sports, and media occupations (12.6%); computer and mathematical occupations (10.2%); construction, extraction, and maintenance occupations (4.7%); architecture and engineering occupations (4.5%)
Most popular occupations of females: business and financial operations occupations (31.7%); management occupations (except farmers) (18.9%); sales and office occupations (18.0%); healthcare practitioners and technical occupations (7.9%); education, training, and library occupations (6.2%); arts, design, entertainment, sports, and media occupations (3.6%); legal occupations (2.9%)
Roads and streets: Geary Blvd; Pine St; Bush St; Post St; Sutter St; Divisadero St; Broderick St; Baker St; Lyon St; Fillmore St; Scott St; Steiner St; Pierce St; Wilmot St; Garden St; Leona Ter; Avery St; Erkson Ct.
Zion District neighborhood detailed profile