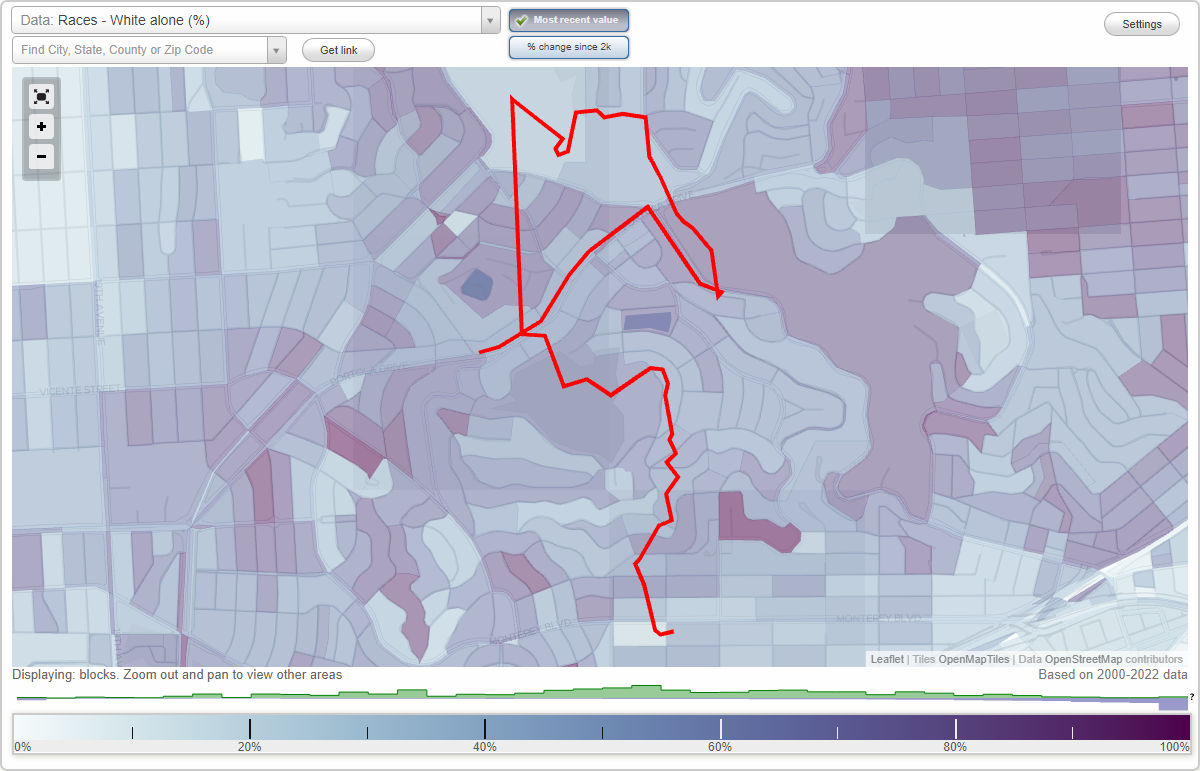
Miraloma Park neighborhood in San Francisco, California (CA), 94127, 94131 detailed profile
Settings
X

Business Search - 14 Million verified businesses
Area: 0.362 square miles
Population: 4,412
Population density:
| Miraloma Park: | 12,195 people per square mile |
| San Francisco: | 17,313 people per square mile |

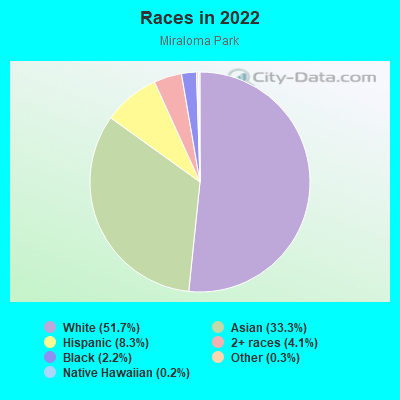
- 2,30551.7%White
- 1,48533.3%Asian
- 3708.3%Hispanic or Latino
- 1814.1%Two or more races
- 972.2%Black
- 150.3%Some other race
- 90.2%Native Hawaiian and Other
Pacific Islander
Median household income in 2022:
| Miraloma Park: | $191,624 |
| San Francisco: | $136,692 |
Distribution of median household income
![Distribution of median household income]()
- 51Less than $10,000
- 70$10,000 to $19,999
- 66$20,000 to $29,999
- 153$30,000 to $39,999
- 141$40,000 to $49,999
- 27$50,000 to $59,999
- 62$60,000 to $74,999
- 245$75,000 to $99,999
- 150$100,000 to $124,999
- 144$125,000 to $149,999
- 180$150,000 to $199,999
- 742$200,000 or more

Distribution of owner-occupied house/condo value
![Distribution of owner-occupied house/condo value]()
- 18Less than $50,000
- 36$100,000 to $149,999
- 39$150,000 to $199,999
- 11$300,000 to $399,999
- 15$500,000 to $749,999
- 82$750,000 to $999,999
- 1,352$1,000,000 or more

Distribution of rent paid by renters
![Distribution of rent paid by renters]()
- 34$1,000 to $1,249
- 30$1,250 to $1,499
- 36$1,500 to $1,999
- 274$2,000 or more

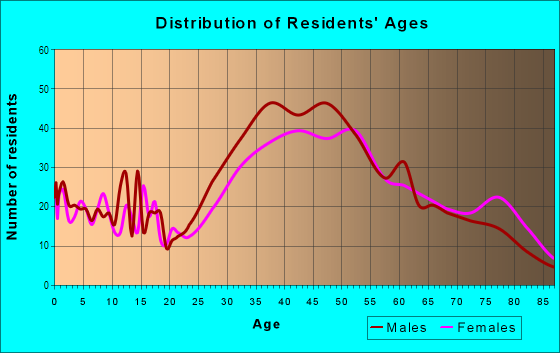
| Males: | 2,319 |
| Females: | 2,093 |
Males:
| This neighborhood: | 42.4 years |
| Whole city: | 40.3 years |
| This neighborhood: | 46.8 years |
| Whole city: | 40.5 years |
Average household size:
| Miraloma Park: | 2.8 people |
| San Francisco: | 2.2 people |
Percentage of family households:
| Miraloma Park: | 43.5% |
| San Francisco: | 30.3% |
| Here: | 61.5% |
| San Francisco: | 35.3% |
Percentage of married-couple families with children (among all households):
| Miraloma Park: | 35.6% |
| San Francisco: | 35.9% |
Percentage of single-mother households (among all households):
| Miraloma Park: | 2.2% |
| San Francisco: | 6.0% |
Percentage of never married males 15 years old and over:
Percentage of never married females 15 years old and over:
| Miraloma Park: | 15.1% |
| San Francisco: | 24.6% |
Percentage of never married females 15 years old and over:
| Miraloma Park: | 9.0% |
| city: | 19.9% |
Percentage of people that speak English not well or not at all:
| Miraloma Park: | 1.3% |
| San Francisco: | 10.9% |
Percentage of people born in this state:
Percentage of people born in another U.S. state:
Percentage of native residents but born outside the U.S.:
Percentage of foreign born residents:
| Here: | 51.6% |
| San Francisco: | 40.8% |
Percentage of people born in another U.S. state:
| Miraloma Park: | 22.3% |
| San Francisco: | 23.4% |
Percentage of native residents but born outside the U.S.:
| Here: | 2.9% |
| city: | 2.6% |
Percentage of foreign born residents:
| Here: | 23.2% |
| San Francisco: | 33.2% |
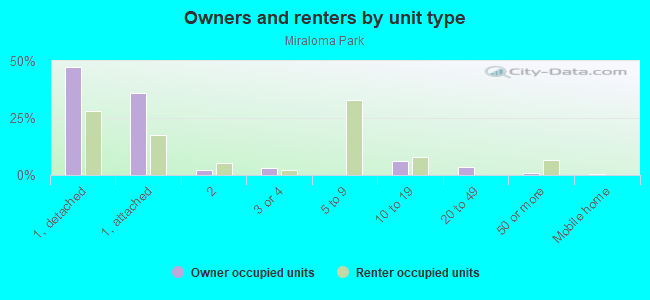
Owner-occupied
Renter-occupied

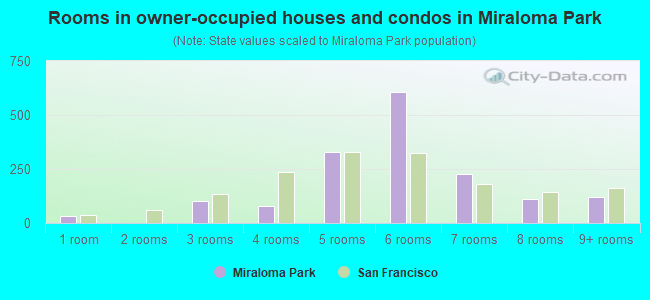
- Rooms in owner-occupied houses and condos in Miraloma Park
- 311 room
- 02 rooms
- 1023 rooms
- 774 rooms
- 3305 rooms
- 6076 rooms
- 2257 rooms
- 1098 rooms
- 1219+ rooms
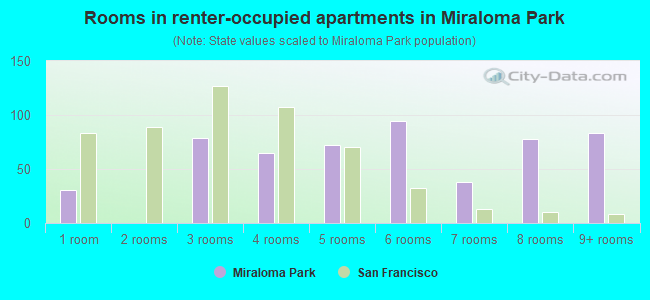
- Rooms in renter-occupied apartments in Miraloma Park
- 311 room
- 02 rooms
- 793 rooms
- 654 rooms
- 725 rooms
- 946 rooms
- 387 rooms
- 788 rooms
- 839+ rooms
Owner-occupied
Renter-occupied
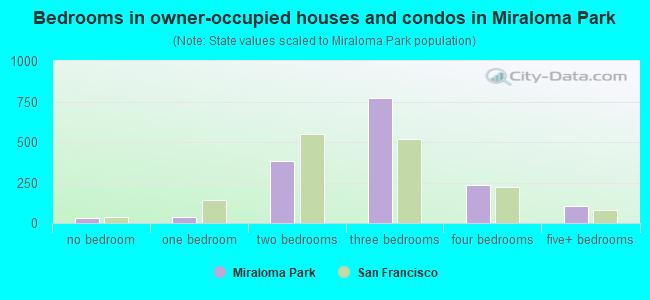
- Bedrooms in owner-occupied houses and condos in Miraloma Park
- 31no bedroom
- 341 bedroom
- 3822 bedrooms
- 7733 bedrooms
- 2324 bedrooms
- 1025+ bedrooms
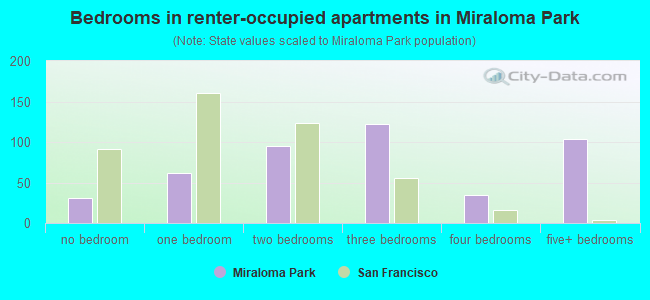
- Bedrooms in renter-occupied apartments in Miraloma Park
- 31no bedroom
- 621 bedroom
- 952 bedrooms
- 1223 bedrooms
- 344 bedrooms
- 1045+ bedrooms
Average number of cars or other vehicles available in houses/condos:
Average number of cars or other vehicles available in apartments:
| This neighborhood: | 1.8 |
| San Francisco: | 1.5 |
Average number of cars or other vehicles available in apartments:
| Here: | |
| city: |
Percentage of units with a mortgage:
| Miraloma Park: | 61.1% |
| San Francisco: | 62.3% |
Housing prices:
- Average estimated value of detached houses in 2022 (56.4% of all units):
Miraloma Park: $1,852,010 San Francisco: $1,942,973
- Average estimated value of townhouses or other attached units in 2022 (40.7% of all units):
This neighborhood: $1,462,402 city: $1,528,422
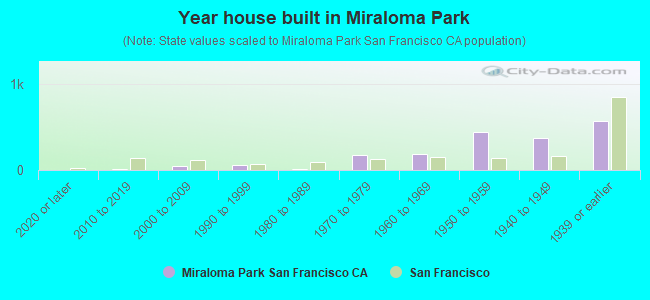
- Year house built in Miraloma Park
- 02020 or later
- 82010 to 2019
- 452000 to 2009
- 571990 to 1999
- 171980 to 1989
- 1721970 to 1979
- 1821960 to 1969
- 4491950 to 1959
- 3691940 to 1949
- 5741939 or earlier
City-data.com crime index for city in 2020 (higher means more crime):
| City: | 387.4 |
| U.S. average: | 219.5 |
Travel time to work (commute)
![Travel time to work (commute)]()
- 25Less than 5 minutes
- 215 to 9 minutes
- 12810 to 14 minutes
- 8915 to 19 minutes
- 34620 to 24 minutes
- 8125 to 29 minutes
- 46830 to 34 minutes
- 12035 to 39 minutes
- 8340 to 44 minutes
- 10345 to 59 minutes
- 10860 to 89 minutes
- 1090 or more minutes

Means of transportation to work
![Means of transportation to work]()
- 41.1%876Drove a car alone
- 5.4%116Carpooled
- 6.9%146Bus
- 7.2%154Subway or elevated rail
- 1.8%38Long-distance train or commuter rail
- 3.1%65Light rail, streetcar or trolley
- 1.5%32Motorcycle
- 7.5%160Bicycle
- 3.8%80Walked
- 1.7%37Other means
- 26.9%574Worked at home

Time leaving home to go to work
![Time leaving home to go to work]()
- 2612:00 a.m. to 4:59 a.m.
- 95:00 a.m. to 5:29 a.m.
- 405:30 a.m. to 5:59 a.m.
- 856:00 a.m. to 6:29 a.m.
- 976:30 a.m. to 6:59 a.m.
- 2017:00 a.m. to 7:29 a.m.
- 2997:30 a.m. to 7:59 a.m.
- 2868:00 a.m. to 8:29 a.m.
- 2428:30 a.m. to 8:59 a.m.
- 1689:00 a.m. to 9:59 a.m.
- 1610:00 a.m. to 10:59 a.m.
- 2611:00 a.m. to 11:59 a.m.
- 3212:00 p.m. to 3:59 p.m.
- 644:00 p.m. to 11:59 p.m.

Occupations of males:
- Percentage of males in management occupations (except farmers):
Here: 24.9% city: 17.2%
- Percentage of males in business and financial operations occupations:
Here: 6.4% city: 8.9%
- Percentage of males in computer and mathematical occupations:
Here: 13.7% city: 14.6%
- Percentage of males in architecture and engineering occupations:
Here: 7.9% city: 4.0%
- Percentage of males in life, physical, and social science occupations:
Here: 2.2% city: 2.4%
- Percentage of males in legal occupations:
Here: 2.5% city: 2.5%
- Percentage of males in education, training, and library occupations:
Here: 6.5% city: 3.4%
- Percentage of males in arts, design, entertainment, sports, and media occupations:
Here: 1.6% city: 4.9%
- Percentage of males in healthcare practitioners and technical occupations:
Here: 9.5% city: 3.2%
- Percentage of males in service occupations:
Here: 1.0% city: 11.8%
- Percentage of males in sales and office occupations:
Here: 14.6% city: 13.5%
- Percentage of males in production occupations:
Here: 1.7% city: 2.5%
- Percentage of males in transportation occupations:
Here: 4.0% city: 3.4%
- Percentage of males in material moving occupations:
Here: 1.1% city: 1.8%
Occupations of females:
- Percentage of females in management occupations (except farmers):
Here: 11.9% city: 15.8%
- Percentage of females in business and financial operations occupations:
Here: 11.7% city: 11.5%
- Percentage of females in computer and mathematical occupations:
Here: 3.0% city: 5.1%
- Percentage of females in architecture and engineering occupations:
Here: 1.6% city: 1.6%
- Percentage of females in life, physical, and social science occupations:
Here: 3.0% city: 2.9%
- Percentage of females in community and social services occupations:
Here: 1.3% city: 1.6%
- Percentage of females in legal occupations:
Here: 2.9% city: 3.0%
- Percentage of females in education, training, and library occupations:
Here: 8.7% city: 7.1%
- Percentage of females in arts, design, entertainment, sports, and media occupations:
Here: 6.9% city: 5.1%
- Percentage of females in healthcare practitioners and technical occupations:
Here: 12.7% city: 8.4%
- Percentage of females in service occupations:
Here: 15.9% city: 15.4%
- Percentage of females in sales and office occupations:
Here: 19.8% city: 19.3%
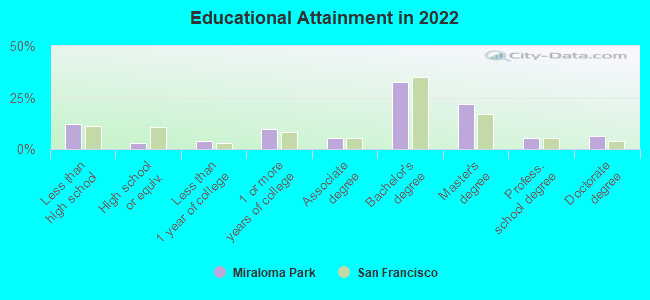
Education in this neighborhood (subdivision or community):
- Percentage of people 3 years and older in K-12 schools:
Miraloma Park: 16.3% San Francisco: 9.7%
- Percentage of people 3 years and older in undergraduate colleges:
Miraloma Park: 2.5% San Francisco: 4.8%
- Percentage of people 3 years and older in grad. or professional schools:
Miraloma Park: 2.4% San Francisco: 2.6%
- Percentage of students K-12 enrolled in private schools:
Miraloma Park: 70.2% San Francisco: 36.5%
Percentage of population below poverty level:
| Miraloma Park: | 3.6% |
| San Francisco: | 10.4% |
Median year owner moved in (as recorded in 2022):
| Miraloma Park: | 2000 |
| San Francisco: | 2007 |
Percentage of married-couple families with both working:
| Miraloma Park: | 101.7% |
| San Francisco: | 75.9% |
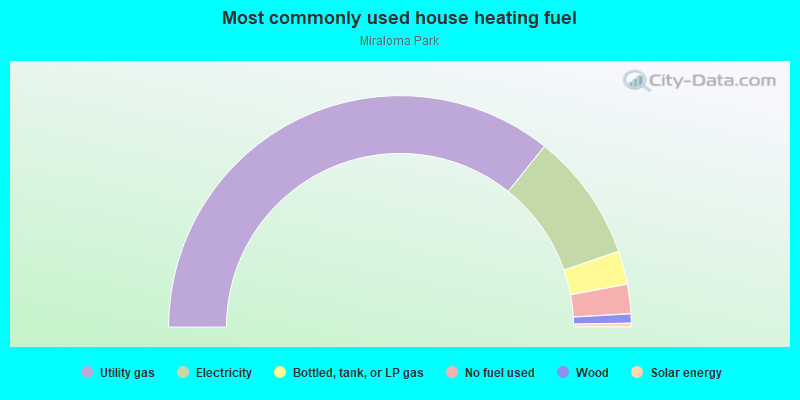
- 71.4%Utility gas
- 17.9%Electricity
- 4.7%Bottled, tank, or LP gas
- 4.1%No fuel used
- 1.3%Wood
- 0.5%Solar energy
Roads and streets:
Marietta Dr
Length: 1.68 miles
Directions: E-W, N-S, SE-NW, SW-NE
Address range: 1 to 499
Directions: E-W, N-S, SE-NW, SW-NE
Address range: 1 to 499
Teresita Blvd
Length: 1.28 miles
Directions: E-W, N-S, SE-NW, SW-NE
Address range: 1 to 1098
Directions: E-W, N-S, SE-NW, SW-NE
Address range: 1 to 1098
Portola Dr
Length: 1.04 miles
Directions: E-W, N-S, SW-NE
Address range: 633 to 1150
Directions: E-W, N-S, SW-NE
Address range: 633 to 1150
Juanita Way
Length: 0.66 miles
Directions: E-W, N-S, SE-NW, SW-NE
Address range: 1 to 298
Directions: E-W, N-S, SE-NW, SW-NE
Address range: 1 to 298
Molimo Dr
Length: 0.48 miles
Directions: E-W, N-S, SE-NW, SW-NE
Address range: 1 to 299
Directions: E-W, N-S, SE-NW, SW-NE
Address range: 1 to 299
Evelyn Way
Length: 0.48 miles
Directions: E-W, SE-NW
Address range: 1 to 299
Directions: E-W, SE-NW
Address range: 1 to 299
Bella Vista Way
Length: 0.47 miles
Directions: E-W, SE-NW, SW-NE
Address range: 1 to 599
Directions: E-W, SE-NW, SW-NE
Address range: 1 to 599
Los Palmos Dr
Length: 0.47 miles
Directions: E-W, N-S, SE-NW, SW-NE
Address range: 1 to 399
Directions: E-W, N-S, SE-NW, SW-NE
Address range: 1 to 399
Melrose Ave
Length: 0.43 miles
Directions: E-W, N-S, SE-NW, SW-NE
Address range: 1 to 313
Directions: E-W, N-S, SE-NW, SW-NE
Address range: 1 to 313
Rockdale Dr
Length: 0.43 miles
Directions: E-W, N-S, SE-NW, SW-NE
Address range: 500 to 955
Directions: E-W, N-S, SE-NW, SW-NE
Address range: 500 to 955
Foerster St
Length: 0.36 miles
Directions: E-W, N-S, SE-NW, SW-NE
Address range: 670 to 899
Directions: E-W, N-S, SE-NW, SW-NE
Address range: 670 to 899
Malta Dr
Length: 0.33 miles
Directions: E-W, N-S, SE-NW
Address range: 1 to 41
Directions: E-W, N-S, SE-NW
Address range: 1 to 41
Myra Way
Length: 0.31 miles
Directions: E-W, N-S, SE-NW, SW-NE
Address range: 553 to 835
Directions: E-W, N-S, SE-NW, SW-NE
Address range: 553 to 835
Stillings Ave
Length: 0.23 miles
Directions: E-W, SE-NW
Address range: 100 to 299
Directions: E-W, SE-NW
Address range: 100 to 299
Agua Way
Length: 0.21 miles
Direction: E-W
Address range: 1 to 99
Direction: E-W
Address range: 1 to 99
el Sereno Ct
Length: 0.19 miles
Direction: E-W
Address range: 1 to 99
Direction: E-W
Address range: 1 to 99
Sequoia Way
Length: 0.18 miles
Direction: N-S
Address range: 1 to 99
Direction: N-S
Address range: 1 to 99
Reposa Way
Length: 0.17 miles
Direction: SW-NE
Address range: 1 to 299
Direction: SW-NE
Address range: 1 to 299
Arroyo Way
Length: 0.17 miles
Directions: N-S, SW-NE
Address range: 1 to 99
Directions: N-S, SW-NE
Address range: 1 to 99
Chaves Ave
Length: 0.16 miles
Direction: SW-NE
Address range: 1 to 199
Direction: SW-NE
Address range: 1 to 199
Dorcas Way
Length: 0.15 miles
Directions: E-W, N-S
Address range: 1 to 199
Directions: E-W, N-S
Address range: 1 to 199
Fowler Ave
Length: 0.15 miles
Directions: E-W, SE-NW, SW-NE
Address range: 100 to 299
Directions: E-W, SE-NW, SW-NE
Address range: 100 to 299
Valletta Ct
Length: 0.15 miles
Directions: E-W, N-S, SE-NW, SW-NE
Address range: 1 to 99
Directions: E-W, N-S, SE-NW, SW-NE
Address range: 1 to 99
Marne Ave
Length: 0.15 miles
Directions: E-W, N-S, SE-NW, SW-NE
Address range: 1 to 99
Directions: E-W, N-S, SE-NW, SW-NE
Address range: 1 to 99
Verna St
Length: 0.15 miles
Direction: N-S
Address range: 1 to 199
Direction: N-S
Address range: 1 to 199
Encline Ct
Length: 0.14 miles
Directions: E-W, SW-NE
Address range: 1 to 199
Directions: E-W, SW-NE
Address range: 1 to 199
del Sur Ave
Length: 0.13 miles
Directions: E-W, SW-NE
Address range: 1 to 199
Directions: E-W, SW-NE
Address range: 1 to 199
Foerster
Length: 0.13 miles
Directions: E-W, N-S, SW-NE
Directions: E-W, N-S, SW-NE
Gaviota Way
Length: 0.13 miles
Direction: N-S
Address range: 1 to 99
Direction: N-S
Address range: 1 to 99
Omar Way
Length: 0.12 miles
Direction: E-W
Address range: 1 to 199
Direction: E-W
Address range: 1 to 199
Gatun Aly
Length: 0.10 miles
Direction: N-S
Address range: 1 to 199
Direction: N-S
Address range: 1 to 199
la Bica Way
Length: 0.10 miles
Direction: N-S
Address range: 9 to 99
Direction: N-S
Address range: 9 to 99
Vista Verde Ct
Length: 0.10 miles
Directions: N-S, SE-NW
Address range: 1 to 99
Directions: N-S, SE-NW
Address range: 1 to 99
Stanford Heights Ave
Length: 0.09 miles
Directions: N-S, SW-NE
Address range: 100 to 299
Directions: N-S, SW-NE
Address range: 100 to 299
31st St
Length: 0.08 miles
Direction: E-W
Direction: E-W
Rio Ct
Length: 0.07 miles
Direction: E-W
Address range: 1 to 99
Direction: E-W
Address range: 1 to 99
Avoca Aly
Length: 0.06 miles
Direction: SE-NW
Address range: 1 to 99
Direction: SE-NW
Address range: 1 to 99
Isola Way
Length: 0.05 miles
Direction: SW-NE
Address range: 1 to 99
Direction: SW-NE
Address range: 1 to 99
Detroit St
Length: 0.05 miles
Direction: N-S
Address range: 800 to 899
Direction: N-S
Address range: 800 to 899
Rex Ave
Length: 0.05 miles
Direction: SE-NW
Address range: 1 to 99
Direction: SE-NW
Address range: 1 to 99
del Vale Ave
Length: 0.04 miles
Directions: N-S, SE-NW
Address range: 1 to 99
Directions: N-S, SE-NW
Address range: 1 to 99
Mercato Ct
Length: 0.02 miles
Direction: SW-NE
Address range: 1 to 99
Direction: SW-NE
Address range: 1 to 99