Estimated zip code population in 2022: 21,008 Zip code population in 2010: 19,289 Zip code population in 2000: 20,624
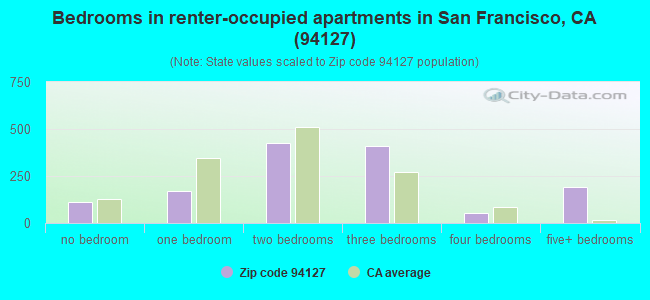
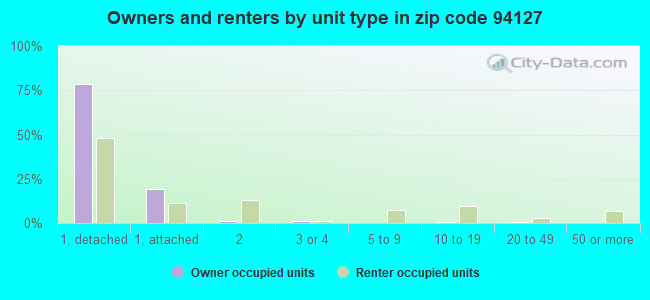
Houses and condos: 7,935 Renter-occupied apartments: 1,352
% of renters here:
18%
State:
44%
March 2022 cost of living index in zip code 94127: 133.1 (high, U.S. average is 100)
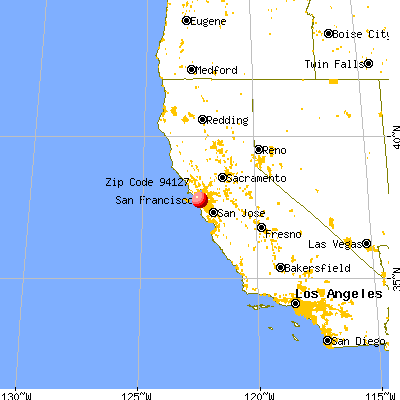
Land area: 1.8 sq. mi. Water area: 0.0 sq. mi.
Population density: 11,866 people per square mile
(high).
OSM Map
General Map
Google Map
MSN Map
OSM Map
General Map
Google Map
MSN Map
OSM Map
General Map
Google Map
MSN Map
OSM Map
General Map
Google Map
MSN Map
Please wait while loading the map...
Real estate property taxes paid for housing units in 2022:
This zip code:
0.5% ($10,292)
California:
0.7% ($4,831)
Median real estate property taxes paid for housing units with mortgages in 2022: $10,330 (0.5%) Median real estate property taxes paid for housing units with no mortgage in 2022: $6,325 (0.4%)
Estimated median house/condo value in 2022: $1,926,078
94127:
$1,926,078
California:
$715,900
According to our research of California and other state lists, there were 4 registered sex offenders living in 94127 zip code as of May 04, 2024. The ratio of all residents to sex offenders in zip code 94127 is 5,240 to 1. The ratio of registered sex offenders to all residents in this zip code is much lower than the state average.
Median resident age:
This zip code:
47.0 years
California median age:
37.9 years
Average household size:
This zip code:
2.7 people
California:
2.8 people
Averages for the 2020 tax year for zip code 94127, filed in 2021:
Average Adjusted Gross Income (AGI) in 2020: $266,432 (Individual Income Tax Returns)
Here:
$266,432
State:
$95,910
Salary/wage: $219,416 (reported on 73.0% of returns)
Here:
$219,416
State:
$77,331
(% of AGI for various income ranges: 1259.2% for AGIs below $25k, 3963.4% for AGIs $25k-50k, 7274.3% for AGIs $50k-75k, 10924.0% for AGIs $75k-100k, 19635.3% for AGIs $100k-200k, 197001.3% for AGIs over 200k)
Taxable interest for individuals: $3,545 (reported on 64.3% of returns)
This zip code:
$3,545
California:
$2,294
(% of AGI for various income ranges: 76.9% for AGIs below $25k, 93.2% for AGIs $25k-50k, 189.8% for AGIs $50k-75k, 300.8% for AGIs $75k-100k, 417.4% for AGIs $100k-200k, 2376.7% for AGIs over 200k)
Ordinary dividends: $13,312 (reported on 56.3% of returns)
Here:
$13,312
State:
$10,949
(% of AGI for various income ranges: 150.7% for AGIs below $25k, 296.2% for AGIs $25k-50k, 418.9% for AGIs $50k-75k, 828.5% for AGIs $75k-100k, 1377.5% for AGIs $100k-200k, 8209.1% for AGIs over 200k)
Net capital gain/loss in AGI: +$79,144 (reported on 52.8% of returns)
Here:
+$79,144
State:
+$49,306
(% of AGI for various income ranges: 89.3% for AGIs below $25k, 291.4% for AGIs $25k-50k, 390.4% for AGIs $50k-75k, 686.0% for AGIs $75k-100k, 1565.9% for AGIs $100k-200k, 59081.6% for AGIs over 200k)
Profit/loss from business: +$44,691 (reported on 20.6% of returns)
Here:
+$44,691
State:
+$15,671
(% of AGI for various income ranges: 186.9% for AGIs below $25k, 527.5% for AGIs $25k-50k, 658.9% for AGIs $50k-75k, 902.8% for AGIs $75k-100k, 1571.4% for AGIs $100k-200k, 10045.5% for AGIs over 200k)
Taxable individual retirement arrangement distribution: $34,215 (reported on 13.5% of returns)
94127:
$34,215
California:
$23,505
(% of AGI for various income ranges: 99.9% for AGIs below $25k, 270.7% for AGIs $25k-50k, 339.2% for AGIs $50k-75k, 786.5% for AGIs $75k-100k, 1577.5% for AGIs $100k-200k, 3841.9% for AGIs over 200k)
Self-employed (Keogh) retirement plans: $40,628 (reported on 4.5% of returns)
94127:
$40,628
California:
$30,163
(% of AGI for various income ranges: 134.7% for AGIs $50k-75k, 236.9% for AGIs $100k-200k, 2313.2% for AGIs over 200k)
Total itemized deductions: $44,899 (reported on 33.9% of returns)
Here:
$44,899
State:
$39,517
(% of AGI for various income ranges: 285.2% for AGIs below $25k, 647.5% for AGIs $25k-50k, 957.4% for AGIs $50k-75k, 1747.5% for AGIs $75k-100k, 3034.7% for AGIs $100k-200k, 16220.1% for AGIs over 200k)
Charity contributions: $13,023 (reported on 28.6% of returns)
Here:
$13,023
State:
$12,598
(% of AGI for various income ranges: 14.6% for AGIs below $25k, 42.1% for AGIs $25k-50k, 93.8% for AGIs $50k-75k, 199.5% for AGIs $75k-100k, 415.8% for AGIs $100k-200k, 4778.3% for AGIs over 200k)
Taxes paid: $9,453 (reported on 33.7% of returns)
94127:
$9,453
State:
$8,807
(% of AGI for various income ranges: 69.3% for AGIs below $25k, 132.0% for AGIs $25k-50k, 210.6% for AGIs $50k-75k, 431.5% for AGIs $75k-100k, 821.2% for AGIs $100k-200k, 3111.4% for AGIs over 200k)
Earned income credit: $1,150 (reported on 3.5% of returns)
Here:
$1,150
State:
$2,074
(% of AGI for various income ranges: 33.2% for AGIs below $25k, 24.1% for AGIs $25k-50k)
Percentage of individuals using paid preparers for their 2020 taxes: 90.4%
Here:
90%
State:
92%
(% for various income ranges: 87.5% for AGIs below $25k, 89.1% for AGIs $25k-50k, 91.1% for AGIs $50k-75k, 87.6% for AGIs $75k-100k, 89.9% for AGIs $100k-200k, 93.3% for AGIs over 200k)
Averages for the 2012 tax year for zip code 94127, filed in 2013:
Average Adjusted Gross Income (AGI) in 2012: $158,955 (Individual Income Tax Returns)
Here:
$158,955
State:
$72,726
Salary/wage: $123,220 (reported on 74.4% of returns)
Here:
$123,220
State:
$59,079
(% of AGI for various income ranges: 61.3% for AGIs below $25k, 67.4% for AGIs $25k-50k, 64.2% for AGIs $50k-75k, 57.2% for AGIs $75k-100k, 65.1% for AGIs $100k-200k, 54.5% for AGIs over 200k)
Taxable interest for individuals: $2,563 (reported on 63.2% of returns)
This zip code:
$2,563
California:
$2,146
(% of AGI for various income ranges: 2.6% for AGIs below $25k, 1.2% for AGIs $25k-50k, 1.4% for AGIs $50k-75k, 1.5% for AGIs $75k-100k, 1.2% for AGIs $100k-200k, 0.9% for AGIs over 200k)
Ordinary dividends: $8,941 (reported on 49.8% of returns)
Here:
$8,941
State:
$9,308
(% of AGI for various income ranges: 6.8% for AGIs below $25k, 3.3% for AGIs $25k-50k, 3.6% for AGIs $50k-75k, 3.5% for AGIs $75k-100k, 2.9% for AGIs $100k-200k, 2.6% for AGIs over 200k)
Net capital gain/loss in AGI: +$50,852 (reported on 42.5% of returns)
Here:
+$50,852
State:
+$30,460
(% of AGI for various income ranges: 0.7% for AGIs below $25k, 0.5% for AGIs $25k-50k, 1.1% for AGIs $50k-75k, 1.3% for AGIs $75k-100k, 2.2% for AGIs $100k-200k, 19.7% for AGIs over 200k)
Profit/loss from business: +$44,729 (reported on 22.3% of returns)
Here:
+$44,729
State:
+$17,064
(% of AGI for various income ranges: 13.6% for AGIs below $25k, 7.9% for AGIs $25k-50k, 6.2% for AGIs $50k-75k, 7.5% for AGIs $75k-100k, 6.7% for AGIs $100k-200k, 5.8% for AGIs over 200k)
Taxable individual retirement arrangement distribution: $23,370 (reported on 14.3% of returns)
94127:
$23,370
California:
$19,557
(% of AGI for various income ranges: 3.8% for AGIs below $25k, 3.0% for AGIs $25k-50k, 3.6% for AGIs $50k-75k, 4.6% for AGIs $75k-100k, 3.3% for AGIs $100k-200k, 1.4% for AGIs over 200k)
Self-employment retirement plans: $30,276 (reported on 4.8% of returns)
94127:
$30,276
California:
$24,530
(% of AGI for various income ranges: 0.8% for AGIs below $25k, 0.5% for AGIs $50k-75k, 0.5% for AGIs $75k-100k, 0.8% for AGIs $100k-200k, 1.1% for AGIs over 200k)
Total itemized deductions: $46,833 (19% of AGI, reported on 58.3% of returns)
Here:
$46,833
State:
$34,004
Here:
19.1% of AGI
State:
22.7% of AGI
(% of AGI for various income ranges: 22.7% for AGIs below $25k, 15.2% for AGIs $25k-50k, 18.4% for AGIs $50k-75k, 20.5% for AGIs $75k-100k, 20.7% for AGIs $100k-200k, 15.8% for AGIs over 200k)
Charity contributions: $5,019 (reported on 50.4% of returns)
Here:
$5,019
State:
$4,659
(% of AGI for various income ranges: 1.1% for AGIs below $25k, 0.9% for AGIs $25k-50k, 1.4% for AGIs $50k-75k, 1.9% for AGIs $75k-100k, 1.9% for AGIs $100k-200k, 1.5% for AGIs over 200k)
Taxes paid: $24,040 (reported on 58.2% of returns)
94127:
$24,040
State:
$14,448
(% of AGI for various income ranges: 5.2% for AGIs below $25k, 3.6% for AGIs $25k-50k, 5.8% for AGIs $50k-75k, 7.3% for AGIs $75k-100k, 9.0% for AGIs $100k-200k, 9.4% for AGIs over 200k)
Earned income credit: $991 (reported on 4.6% of returns)
Here:
$991
State:
$2,286
(% of AGI for various income ranges: 1.4% for AGIs below $25k, 0.2% for AGIs $25k-50k)
Percentage of individuals using paid preparers for their 2012 taxes: 59.1%
Here:
59%
State:
64%
(% for various income ranges: 50.0% for AGIs below $25k, 51.4% for AGIs $25k-50k, 57.5% for AGIs $50k-75k, 62.4% for AGIs $75k-100k, 62.0% for AGIs $100k-200k, 70.4% for AGIs over 200k)
Averages for the 2004 tax year for zip code 94127, filed in 2005:
Average Adjusted Gross Income (AGI) in 2004: $103,438 (Individual Income Tax Returns)
Here:
$103,438
State:
$58,600
Salary/wage: $88,754 (reported on 71.6% of returns)
Here:
$88,754
State:
$49,455
(% of AGI for various income ranges: 57.5% for AGIs $10k-25k, 65.5% for AGIs $25k-50k, 64.0% for AGIs $50k-75k, 65.9% for AGIs $75k-100k, 59.5% for AGIs over 100k)
Taxable interest for individuals: $2,963 (reported on 71.2% of returns)
This zip code:
$2,963
California:
$2,365
(% of AGI for various income ranges: 6.1% for AGIs $10k-25k, 3.4% for AGIs $25k-50k, 3.3% for AGIs $50k-75k, 2.6% for AGIs $75k-100k, 1.6% for AGIs over 100k)
Taxable dividends: $5,254 (reported on 52.8% of returns)
Here:
$5,254
State:
$4,746
(% of AGI for various income ranges: 5.9% for AGIs $10k-25k, 3.2% for AGIs $25k-50k, 2.7% for AGIs $50k-75k, 3.2% for AGIs $75k-100k, 2.4% for AGIs over 100k)
Net capital gain/loss: +$19,387 (reported on 46.5% of returns)
Here:
+$19,387
State:
+$23,418
(% of AGI for various income ranges: 0.9% for AGIs $10k-25k, 0.8% for AGIs $25k-50k, 1.6% for AGIs $50k-75k, 2.3% for AGIs $75k-100k, 10.6% for AGIs over 100k)
Profit/loss from business: +$37,305 (reported on 21.9% of returns)
Here:
+$37,305
State:
+$16,826
(% of AGI for various income ranges: 10.6% for AGIs $10k-25k, 7.8% for AGIs $25k-50k, 7.2% for AGIs $50k-75k, 7.6% for AGIs $75k-100k, 7.9% for AGIs over 100k)
IRA payment deduction: $3,618 (reported on 3.9% of returns)
94127:
$3,618
California:
$3,192
(% of AGI for various income ranges: 0.5% for AGIs $10k-25k, 0.5% for AGIs $25k-50k, 0.3% for AGIs $50k-75k, 0.2% for AGIs $75k-100k, 0.1% for AGIs over 100k)
Self-employed pension: $21,263 (reported on 5.7% of returns)
Here:
$21,263
California:
$17,688
(% of AGI for various income ranges: 0.2% for AGIs $10k-25k, 0.3% for AGIs $25k-50k, 0.6% for AGIs $50k-75k, 0.7% for AGIs $75k-100k, 1.4% for AGIs over 100k)
Total itemized deductions: $36,140 (22% of AGI, reported on 55.5% of returns)
Here:
$36,140
State:
$28,113
Here:
21.9% of AGI
State:
25.3% of AGI
(% of AGI for various income ranges: 24.6% for AGIs $10k-25k, 19.3% for AGIs $25k-50k, 20.7% for AGIs $50k-75k, 22.4% for AGIs $75k-100k, 18.5% for AGIs over 100k)
Charity contributions deductions: $4,427 (3% of AGI, reported on 49.9% of returns)
Here:
$4,427
State:
$3,923
Here:
2.5% of AGI
State:
3.3% of AGI
(% of AGI for various income ranges: 1.6% for AGIs $10k-25k, 1.7% for AGIs $25k-50k, 1.9% for AGIs $50k-75k, 2.1% for AGIs $75k-100k, 2.2% for AGIs over 100k)
Total tax: $21,848 (reported on 85.6% of returns)
94127:
$21,848
State:
$10,761
(% of AGI for various income ranges: 5.6% for AGIs $10k-25k, 8.9% for AGIs $25k-50k, 11.4% for AGIs $50k-75k, 12.2% for AGIs $75k-100k, 20.2% for AGIs over 100k)
Earned income credit: $950 (reported on 4.3% of returns)
Here:
$950
State:
$1,763
Percentage of individuals using paid preparers for their 2004 taxes: 61.8%
Here:
62%
State:
66%
(% for various income ranges: 56.8% for AGIs below $10k, 59.1% for AGIs $10k-25k, 56.6% for AGIs $25k-50k, 60.2% for AGIs $50k-75k, 63.8% for AGIs $75k-100k, 68.2% for AGIs over 100k)
Likely homosexual households (counted as self-reported same-sex unmarried-partner households)
Lesbian couples: 0.4% of all households
Gay men: 1.1% of all households
Household received Food Stamps/SNAP in the past 12 months: 206 Household did not receive Food Stamps/SNAP in the past 12 months: 7,115
Women who had a birth in the past 12 months: 183 (170 now married, 12 unmarried) Women who did not have a birth in the past 12 months: 3,808 (1,876 now married, 1,916 unmarried)
Housing units in zip code 94127 with a mortgage: 3,929 (556 second mortgage, 31 home equity loan, 485 both second mortgage and home equity loan) Houses without a mortgage: 87
Median monthly owner costs for units with a mortgage: $3,876 Median monthly owner costs for units without a mortgage: $965
Residents with income below the poverty level in 2022:
This zip code:
5.0%
Whole state:
12.2%
Residents with income below 50% of the poverty level in 2022:
This zip code:
2.4%
Whole state:
6.2%
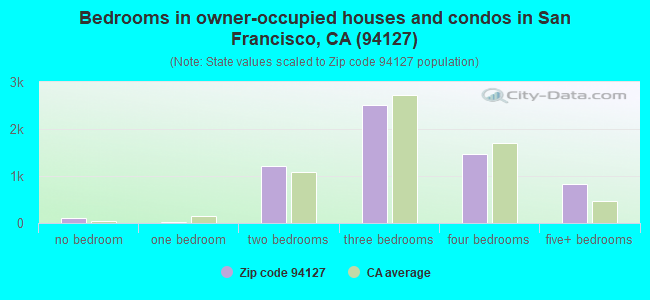
Median number of rooms in houses and condos:
Here:
6.7
State:
6.0
Median number of rooms in apartments:
Here:
5.1
State:
3.9
Notable locations in this zip code not listed on our city pages
Notable locations in zip code 94127: West Portal Branch Library (A), Ingleside Branch Library (B), San Francisco Fire Department Station 39 (C). Display/hide their locations on the map
Churches in zip code 94127 include: First Church of the Nazarene (A), Ebenezer Lutheran Church (B), Saint Brendans Roman Catholic Church (C). Display/hide their locations on the map
Parks in zip code 94127 include: Aptos Playground (1), Miralona Playground (2), Mount Davidson Park (3), Sunnyside Playground (4), West Portal Playground (5). Display/hide their locations on the map
3,105 married couples with children.
266 single-parent households (98 men, 168 women).
71.0% of residents of 94127 zip code speak English at home.
5.8% of residents speak Spanish at home (86% very well, 5% well, 5% not well, 3% not at all).
5.4% of residents speak other Indo-European language at home (95% very well, 5% well).
17.1% of residents speak Asian or Pacific Island language at home (56% very well, 23% well, 12% not well, 9% not at all).
1.0% of residents speak other language at home (91% very well, 7% well, 1% not well).
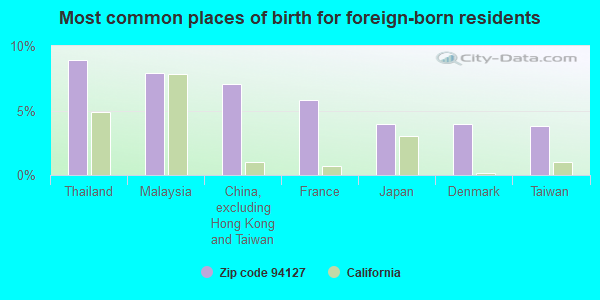
Foreign born population: 4,879 (23.2%) (76.4% of them are naturalized citizens)
Facilities with environmental interests located in this zip code:
APTOS MIDDLE SCHOOL (105 APTOS AVE in SAN FRANCISCO, CA)
(Geographic Names Information System) (National Center for Education Statistics) - STATE ID-6062020 Organizations: SAN FRANCISCO UNIFIED (SCHOOL DISTRICT)
EQUILON ENTERPRISES (701 PORTOLA in SAN FRANCISCO, CA) . Federal Facility
STATE MASTER (California - Hazardous Waste Tracking) - HAZARDOU WASTE PROGRAM Small Quantity Generators, between 100 kg and 1000 kg of hazardous waste/month (Resource Conservation and Recovery Act (tracking hazardous waste)) - notification Organizations: EQUILON ENTERPRISES, LLC (CONTACT/OWNER)
Alternative names: SHELL OIL CO
MIRALOMA ELEMENTARY (175 OMAR WAY in SAN FRANCISCO, CA)
(National Center for Education Statistics) - STATE ID-6041438 Organizations: SAN FRANCISCO UNIFIED (SCHOOL DISTRICT)
ANNABELLE'S FRENCH CLEANER (363 W PORTAL AVENUE in SAN FRANCISCO, CA)
CRITERIA AND HAZARDOUS AIR POLLUTANT INVENTORY (Inventory of air pollution sources) Business SIC classification: DRYCLEANING PLANTS, EXCEPT RUG CLEANING
L I F E MONTESSORI, INC (62 LENOX WAY in SAN FRANCISCO, CA)
COMPLIANCE ACTIVITY (Tracking inspections of insecticide, fungicide, and rodenticide, and toxic substances)
CHILDREN'S SCHOOL OF SAN FRANCISO (399 SAN FERNANDO WAY in SAN FRANCISCO, CA)
COMPLIANCE ACTIVITY (Tracking inspections of insecticide, fungicide, and rodenticide, and toxic substances)
MIRALOMA CLEANERS (667 PORTOLA DRIVE in SAN FRANCISCO, CA)
CRITERIA AND HAZARDOUS AIR POLLUTANT INVENTORY (Inventory of air pollution sources) Business SIC classification: DRYCLEANING PLANTS, EXCEPT RUG CLEANING
Housing units lacking complete plumbing facilities: 1.8% Housing units lacking complete kitchen facilities: 1.8%
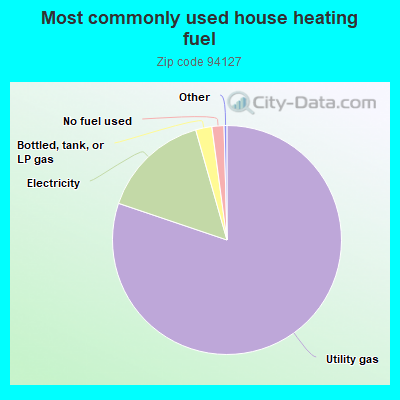
80.2%Utility gas
15.4%Electricity
2.3%Bottled, tank, or LP gas
1.7%No fuel used
Population in 1990: 17,906. Population change in the 1990s: +2,718 (+15.2%).
Place of birth for U.S.-born residents:
This state: 10,834
Northeast: 1,423
Midwest: 1,325
South: 1,014
West: 972
68% of the 94127 zip code residents lived in the same house 5 years ago. Out of people who lived in different houses, 64% lived in this county. Out of people who lived in different counties, 50% lived in California.
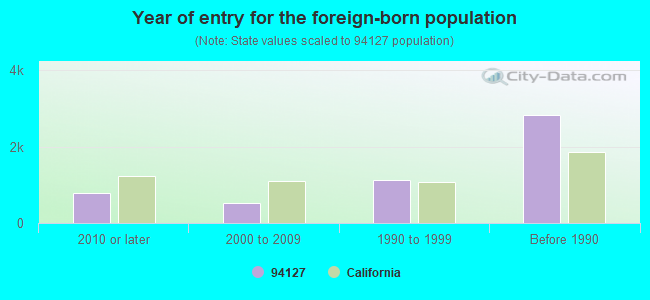
92% of the 94127 zip code residents lived in the same house 1 year ago. Out of people who lived in different houses, 49% moved from this county. Out of people who lived in different houses, 14% moved from different county within same state. Out of people who lived in different houses, 19% moved from different state. Out of people who lived in different houses, 24% moved from abroad.
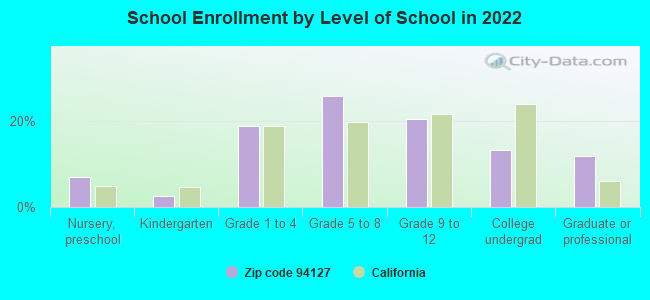
Private vs. public school enrollment:
Students in private schools in grades 1 to 8 (elementary and middle school): 1,193
Here:
61.1%
California:
10.5%
Students in private schools in grades 9 to 12 (high school): 388
Here:
45.0%
California:
8.5%
Students in private undergraduate colleges: 70
Here:
12.6%
California:
15.9%
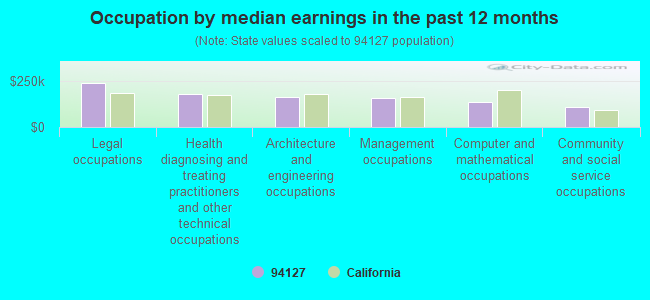
Occupation by median earnings in the past 12 months ($)
237,352Legal occupations
180,189Health diagnosing and treating practitioners and other technical occupations
162,045Architecture and engineering occupations
158,079Management occupations
134,341Computer and mathematical occupations
108,122Community and social service occupations
Companies with federal contracts located in this zip code:
BIOMETRIX INC (2419 OCEAN AVE in SAN FRANCISCO, CA; small business)
$99,741 with Department of Defense for Other Defense -- Basic Research (R&D). Signed on 2002-07-31. Completion date: 2003-01-31.
INTEGRATED DIAGNOSTIC AND REHA (236 W PORTAL AVE STE 389 in SAN FRANCISCO, CA; small business) : $63,000 in 4 contractsfrom 2002 to 2005
$63,000 with Department of Veterans Affairs for Medical and Surgical Instruments, Equipment, and Supplies. Signed on 2002-09-15. Completion date: 2002-10-15.
$3,560 with Army for Medical and Surgical Instruments, Equipment, and Supplies. Taking place in SC. Signed on 2004-05-09. Completion date: 2004-05-28.
-$65, same as above.Signed on 2005-06-24. Completion date: 2004-05-28.
-$3,495, same as above.Signed on 2005-08-27. Completion date: 2004-05-28.
Top industries in this zip code by the number of employees in 2005:
2005 - 2018 National Fire Incident Reporting System (NFIRS) incidents
Based on the data from the years 2005 - 2018 the average number of fire incidents per year is 26. The highest number of fire incidents - 43 took place in 2017, and the least - 12 in 2012. The data has a growing trend.
When looking into fire subcategories, the most incidents belonged to: Structure Fires (65.5%), and Outside Fires (21.0%).
Fire incident types reported to NFIRS in Zip Code 94127


 Nearest zip codes: 94131, 94112, 94116, 94132, 94114, 94122.


 Based on the data from the years 2005 - 2018 the average number of fire incidents per year is 26. The highest number of fire incidents - 43 took place in 2017, and the least - 12 in 2012. The data has a growing trend.
 When looking into fire subcategories, the most incidents belonged to: Structure Fires (65.5%), and Outside Fires (21.0%).