West Portal neighborhood in San Francisco, California (CA), 94116, 94127, 94132 detailed profile
Settings
X

Business Search - 14 Million verified businesses
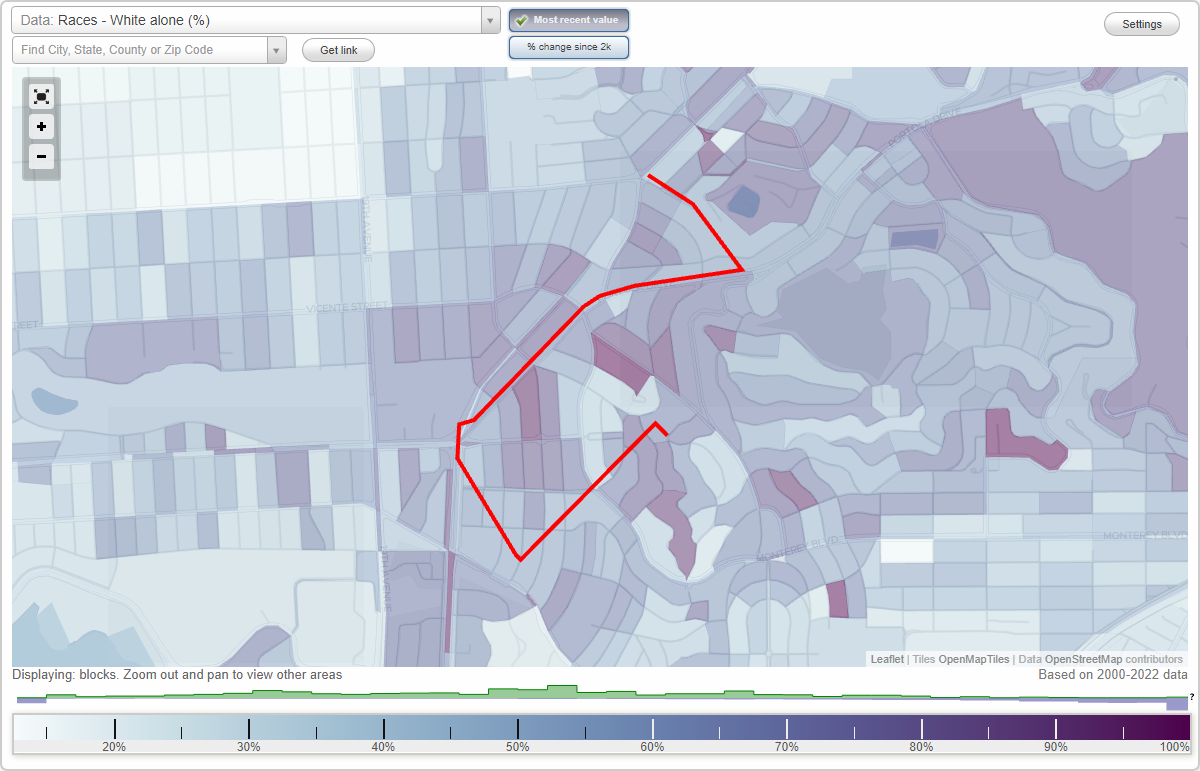
Area: 0.226 square miles
Population: 2,811
Population density:
| West Portal: | 12,418 people per square mile |
| San Francisco: | 17,313 people per square mile |

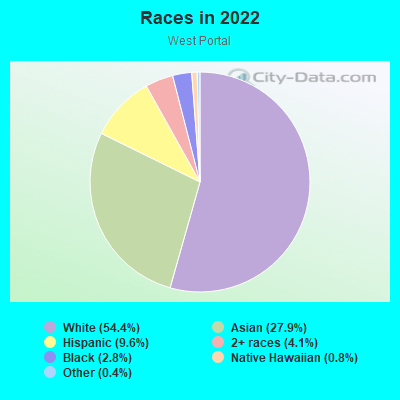
- 1,55654.4%White
- 79727.9%Asian
- 2759.6%Hispanic or Latino
- 1184.1%Two or more races
- 812.8%Black
- 220.8%Native Hawaiian and Other
Pacific Islander - 120.4%Some other race
Median household income in 2022:
| West Portal: | $200,919 |
| San Francisco: | $136,692 |
Distribution of median household income
![Distribution of median household income]()
- 34Less than $10,000
- 138$10,000 to $19,999
- 62$20,000 to $29,999
- 79$30,000 to $39,999
- 170$40,000 to $49,999
- 31$50,000 to $59,999
- 45$60,000 to $74,999
- 130$75,000 to $99,999
- 77$100,000 to $124,999
- 234$125,000 to $149,999
- 62$150,000 to $199,999
- 483$200,000 or more

Distribution of owner-occupied house/condo value
![Distribution of owner-occupied house/condo value]()
- 40Less than $50,000
- 31$100,000 to $149,999
- 30$150,000 to $199,999
- 35$500,000 to $749,999
- 76$750,000 to $999,999
- 755$1,000,000 or more

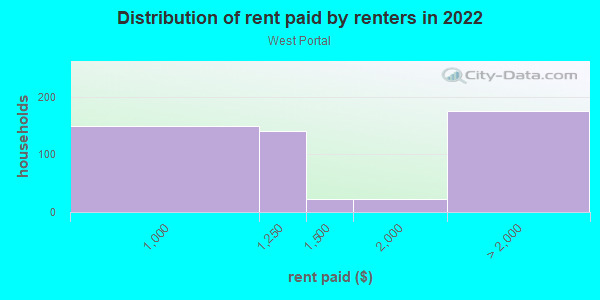
Distribution of rent paid by renters
![Distribution of rent paid by renters]()
- 150$900 to $999
- 141$1,000 to $1,249
- 22$1,250 to $1,499
- 23$1,500 to $1,999
- 175$2,000 or more
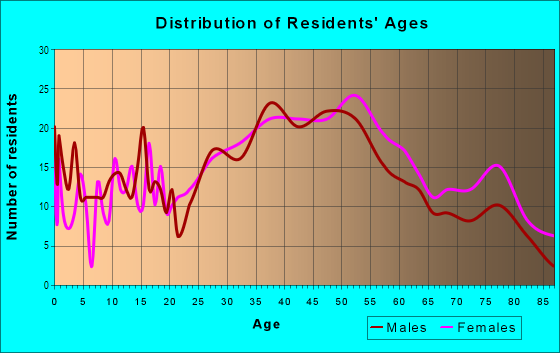
| Males: | 1,413 |
| Females: | 1,397 |
Males:
| This neighborhood: | 48.2 years |
| Whole city: | 40.3 years |
| This neighborhood: | 49.6 years |
| Whole city: | 40.5 years |
Average household size:
| West Portal: | 2.6 people |
| San Francisco: | 2.2 people |
Percentage of family households:
| West Portal: | 41.1% |
| San Francisco: | 30.3% |
| Here: | 63.4% |
| San Francisco: | 35.3% |
Percentage of married-couple families with children (among all households):
| West Portal: | 36.2% |
| San Francisco: | 35.9% |
Percentage of single-mother households (among all households):
| West Portal: | 3.8% |
| San Francisco: | 6.0% |
Percentage of never married males 15 years old and over:
Percentage of never married females 15 years old and over:
| West Portal: | 9.6% |
| San Francisco: | 24.6% |
Percentage of never married females 15 years old and over:
| West Portal: | 10.8% |
| city: | 19.9% |
Percentage of people that speak English not well or not at all:
| West Portal: | 4.3% |
| San Francisco: | 10.9% |
Percentage of people born in this state:
Percentage of people born in another U.S. state:
Percentage of native residents but born outside the U.S.:
Percentage of foreign born residents:
| Here: | 47.2% |
| San Francisco: | 40.8% |
Percentage of people born in another U.S. state:
| West Portal: | 18.0% |
| San Francisco: | 23.4% |
Percentage of native residents but born outside the U.S.:
| Here: | 3.0% |
| city: | 2.6% |
Percentage of foreign born residents:
| Here: | 31.8% |
| San Francisco: | 33.2% |
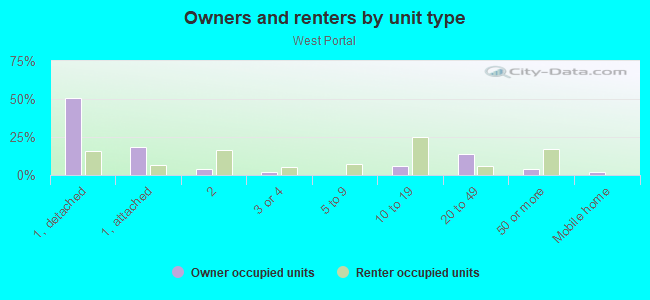
Owner-occupied
Renter-occupied

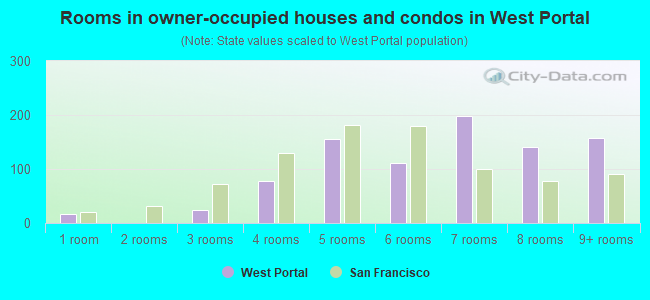
- Rooms in owner-occupied houses and condos in West Portal
- 171 room
- 02 rooms
- 253 rooms
- 774 rooms
- 1555 rooms
- 1116 rooms
- 1997 rooms
- 1418 rooms
- 1589+ rooms
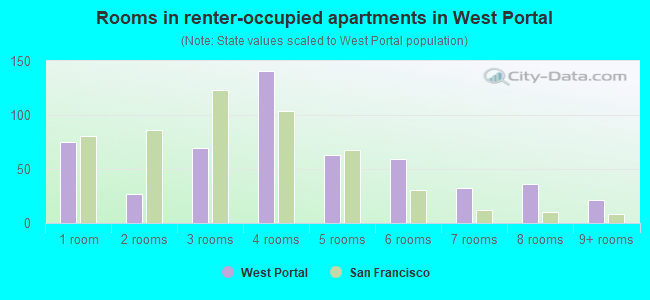
- Rooms in renter-occupied apartments in West Portal
- 751 room
- 272 rooms
- 693 rooms
- 1414 rooms
- 635 rooms
- 596 rooms
- 327 rooms
- 368 rooms
- 219+ rooms
Owner-occupied
Renter-occupied
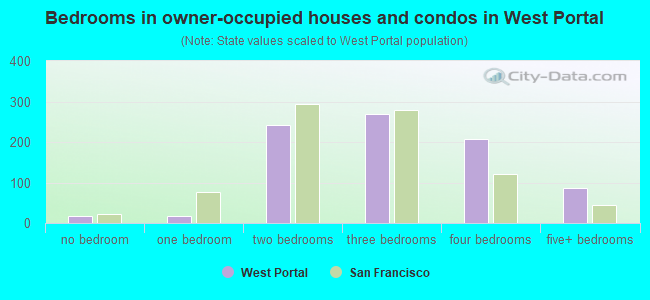
- Bedrooms in owner-occupied houses and condos in West Portal
- 17no bedroom
- 171 bedroom
- 2422 bedrooms
- 2683 bedrooms
- 2084 bedrooms
- 865+ bedrooms
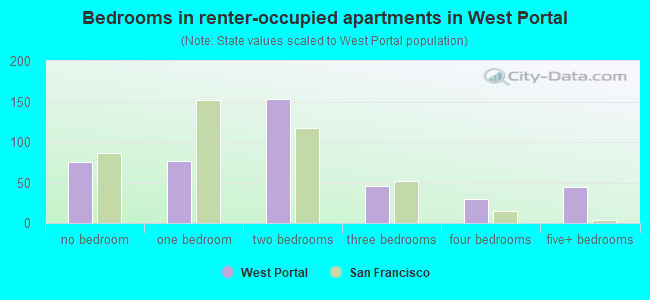
- Bedrooms in renter-occupied apartments in West Portal
- 75no bedroom
- 761 bedroom
- 1532 bedrooms
- 463 bedrooms
- 304 bedrooms
- 455+ bedrooms
Average number of cars or other vehicles available in houses/condos:
Average number of cars or other vehicles available in apartments:
| This neighborhood: | 1.8 |
| San Francisco: | 1.5 |
Average number of cars or other vehicles available in apartments:
| Here: | |
| city: |
Percentage of units with a mortgage:
| West Portal: | 53.9% |
| San Francisco: | 62.3% |
Average estimated value of detached houses in 2022 (57.3% of all units):
| West Portal: | $2,305,189 |
| San Francisco: | $1,942,973 |
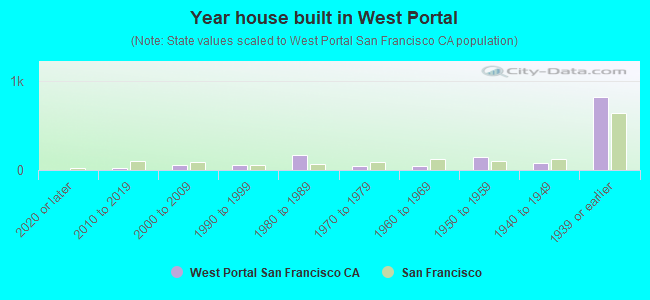
- Year house built in West Portal
- 02020 or later
- 202010 to 2019
- 532000 to 2009
- 521990 to 1999
- 1641980 to 1989
- 421970 to 1979
- 401960 to 1969
- 1431950 to 1959
- 801940 to 1949
- 8151939 or earlier
City-data.com crime index for city in 2020 (higher means more crime):
| City: | 387.4 |
| U.S. average: | 219.5 |
Travel time to work (commute)
![Travel time to work (commute)]()
- 17Less than 5 minutes
- 145 to 9 minutes
- 10610 to 14 minutes
- 9915 to 19 minutes
- 8420 to 24 minutes
- 4525 to 29 minutes
- 27630 to 34 minutes
- 12635 to 39 minutes
- 6740 to 44 minutes
- 12545 to 59 minutes
- 6660 to 89 minutes
- 2490 or more minutes

Means of transportation to work
![Means of transportation to work]()
- 31.6%420Drove a car alone
- 8.8%117Carpooled
- 14.2%189Bus
- 9.8%130Subway or elevated rail
- 3.4%45Long-distance train or commuter rail
- 7.2%95Light rail, streetcar or trolley
- 0.8%10Taxi
- 3.5%46Bicycle
- 5.8%77Walked
- 1.4%18Other means
- 23.1%307Worked at home

Time leaving home to go to work
![Time leaving home to go to work]()
- 1712:00 a.m. to 4:59 a.m.
- 45:00 a.m. to 5:29 a.m.
- 215:30 a.m. to 5:59 a.m.
- 986:00 a.m. to 6:29 a.m.
- 596:30 a.m. to 6:59 a.m.
- 807:00 a.m. to 7:29 a.m.
- 2307:30 a.m. to 7:59 a.m.
- 2118:00 a.m. to 8:29 a.m.
- 608:30 a.m. to 8:59 a.m.
- 1449:00 a.m. to 9:59 a.m.
- 3610:00 a.m. to 10:59 a.m.
- 2911:00 a.m. to 11:59 a.m.
- 5912:00 p.m. to 3:59 p.m.
- 44:00 p.m. to 11:59 p.m.

Occupations of males:
- Percentage of males in management occupations (except farmers):
Here: 16.4% city: 17.2%
- Percentage of males in business and financial operations occupations:
Here: 11.1% city: 8.9%
- Percentage of males in computer and mathematical occupations:
Here: 17.4% city: 14.6%
- Percentage of males in architecture and engineering occupations:
Here: 7.6% city: 4.0%
- Percentage of males in community and social services occupations:
Here: 1.7% city: 1.0%
- Percentage of males in legal occupations:
Here: 5.0% city: 2.5%
- Percentage of males in education, training, and library occupations:
Here: 5.4% city: 3.4%
- Percentage of males in healthcare practitioners and technical occupations:
Here: 3.3% city: 3.2%
- Percentage of males in service occupations:
Here: 10.3% city: 11.8%
- Percentage of males in sales and office occupations:
Here: 11.6% city: 13.5%
- Percentage of males in construction, extraction, and maintenance occupations:
Here: 6.7% city: 3.1%
- Percentage of males in production occupations:
Here: 2.1% city: 2.5%
Occupations of females:
- Percentage of females in management occupations (except farmers):
Here: 16.4% city: 15.8%
- Percentage of females in business and financial operations occupations:
Here: 6.2% city: 11.5%
- Percentage of females in computer and mathematical occupations:
Here: 3.7% city: 5.1%
- Percentage of females in architecture and engineering occupations:
Here: 1.3% city: 1.6%
- Percentage of females in life, physical, and social science occupations:
Here: 2.4% city: 2.9%
- Percentage of females in community and social services occupations:
Here: 1.5% city: 1.6%
- Percentage of females in education, training, and library occupations:
Here: 10.8% city: 7.1%
- Percentage of females in arts, design, entertainment, sports, and media occupations:
Here: 6.3% city: 5.1%
- Percentage of females in healthcare practitioners and technical occupations:
Here: 11.9% city: 8.4%
- Percentage of females in service occupations:
Here: 5.5% city: 15.4%
- Percentage of females in sales and office occupations:
Here: 26.2% city: 19.3%
- Percentage of females in production occupations:
Here: 3.5% city: 1.5%
- Percentage of females in transportation occupations:
Here: 3.4% city: 0.8%
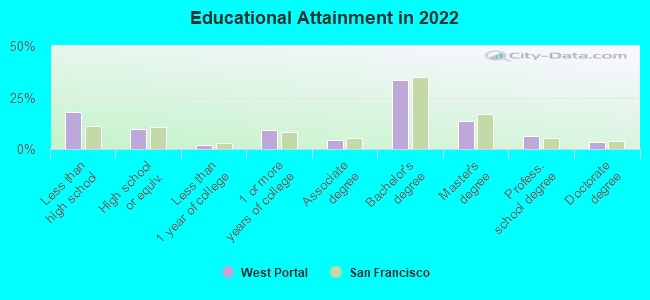
Education in this neighborhood (subdivision or community):
- Percentage of people 3 years and older in K-12 schools:
West Portal: 25.9% San Francisco: 9.7%
- Percentage of people 3 years and older in undergraduate colleges:
West Portal: 3.3% San Francisco: 4.8%
- Percentage of people 3 years and older in grad. or professional schools:
West Portal: 4.5% San Francisco: 2.6%
- Percentage of students K-12 enrolled in private schools:
West Portal: 62.9% San Francisco: 36.5%
Percentage of population below poverty level:
| West Portal: | 4.9% |
| San Francisco: | 10.4% |
Median year owner moved in (as recorded in 2022):
| West Portal: | 2002 |
| San Francisco: | 2007 |
Percentage of married-couple families with both working:
| West Portal: | 99.7% |
| San Francisco: | 75.9% |
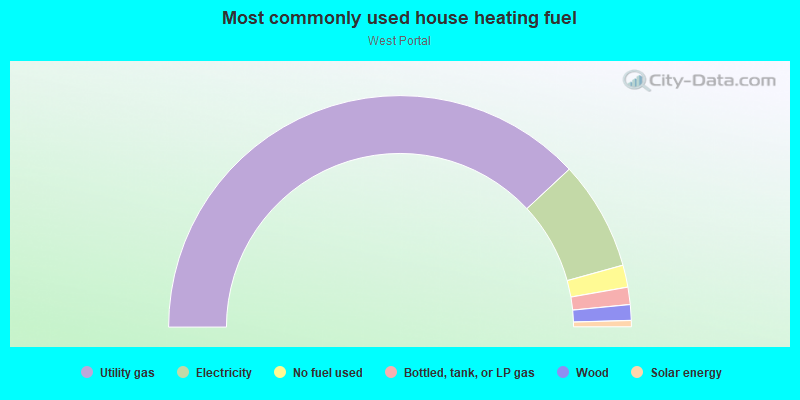
- 76.2%Utility gas
- 15.3%Electricity
- 3.1%No fuel used
- 2.4%Bottled, tank, or LP gas
- 2.2%Wood
- 0.9%Solar energy
Roads and streets:
W Portal Ave
Length: 0.89 miles
Directions: E-W, N-S, SW-NE
Address range: 1 to 399
Directions: E-W, N-S, SW-NE
Address range: 1 to 399
Ulloa St
Length: 0.72 miles
Directions: E-W, SE-NW
Address range: 500 to 1299
Directions: E-W, SE-NW
Address range: 500 to 1299
Wawona St
Length: 0.45 miles
Directions: N-S, SW-NE
Address range: 1 to 299
Directions: N-S, SW-NE
Address range: 1 to 299
Taraval St
Length: 0.45 miles
Direction: E-W
Address range: 1 to 399
Direction: E-W
Address range: 1 to 399
Kensington Way
Length: 0.40 miles
Directions: E-W, SE-NW
Address range: 100 to 399
Directions: E-W, SE-NW
Address range: 100 to 399
14th Ave
Length: 0.39 miles
Directions: N-S, SE-NW
Address range: 2400 to 2799
Directions: N-S, SE-NW
Address range: 2400 to 2799
Forest Side Ave
Length: 0.27 miles
Directions: N-S, SW-NE
Address range: 1 to 199
Directions: N-S, SW-NE
Address range: 1 to 199
Madrone Ave
Length: 0.26 miles
Directions: N-S, SW-NE
Address range: 1 to 199
Directions: N-S, SW-NE
Address range: 1 to 199
Granville Way
Length: 0.25 miles
Directions: E-W, N-S, SE-NW
Address range: 100 to 299
Directions: E-W, N-S, SE-NW
Address range: 100 to 299
Claremont Blvd
Length: 0.24 miles
Directions: N-S, SW-NE
Address range: 1 to 299
Directions: N-S, SW-NE
Address range: 1 to 299
Vicente St
Length: 0.21 miles
Directions: E-W, SE-NW, SW-NE
Address range: 58 to 299
Directions: E-W, SE-NW, SW-NE
Address range: 58 to 299
Lenox Way
Length: 0.21 miles
Directions: N-S, SW-NE
Address range: 1 to 199
Directions: N-S, SW-NE
Address range: 1 to 199
Allston Way
Length: 0.18 miles
Directions: N-S, SE-NW
Address range: 1 to 99
Directions: N-S, SE-NW
Address range: 1 to 99
Briarcliff Ter
Length: 0.17 miles
Direction: E-W
Direction: E-W
Funston Ave
Length: 0.13 miles
Direction: N-S
Address range: 2400 to 2499
Direction: N-S
Address range: 2400 to 2499
Dorchester Way
Length: 0.12 miles
Direction: SE-NW
Address range: 100 to 199
Direction: SE-NW
Address range: 100 to 199
Verdun Way
Length: 0.07 miles
Direction: SE-NW
Direction: SE-NW
15th Ave
Length: 0.05 miles
Direction: SE-NW
Address range: 2800 to 2899
Direction: SE-NW
Address range: 2800 to 2899