Westwood Highlands neighborhood in San Francisco, California (CA), 94127 detailed profile
Settings
X

Business Search - 14 Million verified businesses
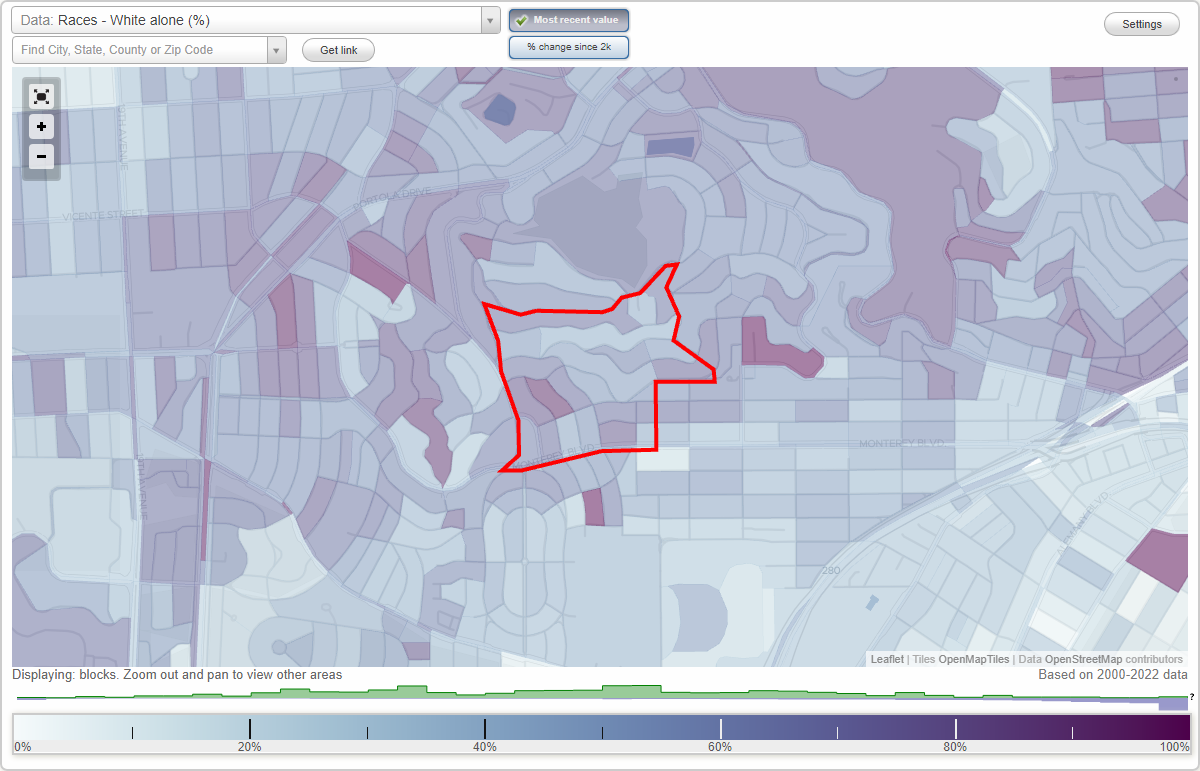
Area: 0.142 square miles
Population: 1,767
Population density:
| Westwood Highlands: | 12,461 people per square mile |
| San Francisco: | 17,313 people per square mile |

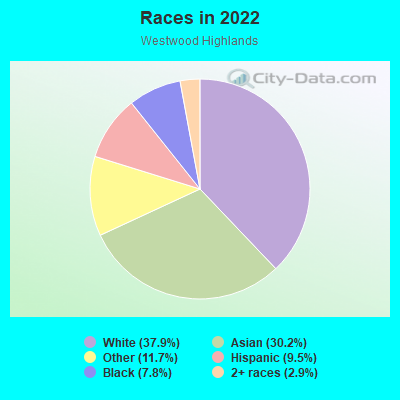
- 70337.9%White
- 56130.2%Asian
- 21711.7%Some other race
- 1769.5%Hispanic or Latino
- 1447.8%Black
- 542.9%Two or more races
Distribution of median household income
![Distribution of median household income]()
- 33Less than $10,000
- 39$10,000 to $19,999
- 34$20,000 to $29,999
- 74$30,000 to $39,999
- 44$40,000 to $49,999
- 39$50,000 to $59,999
- 16$60,000 to $74,999
- 31$75,000 to $99,999
- 34$100,000 to $124,999
- 28$125,000 to $149,999
- 141$150,000 to $199,999
- 329$200,000 or more

Distribution of owner-occupied house/condo value
![Distribution of owner-occupied house/condo value]()
- 8Less than $50,000
- 18$100,000 to $149,999
- 16$150,000 to $199,999
- 19$250,000 to $299,999
- 31$300,000 to $399,999
- 16$500,000 to $749,999
- 27$750,000 to $999,999
- 526$1,000,000 or more

Distribution of rent paid by renters
![Distribution of rent paid by renters]()
- 13$200 to $299
- 34$400 to $499
- 41$700 to $799
- 31$800 to $899
- 54$1,000 to $1,249
- 15$1,250 to $1,499
- 59$1,500 to $1,999
- 256$2,000 or more

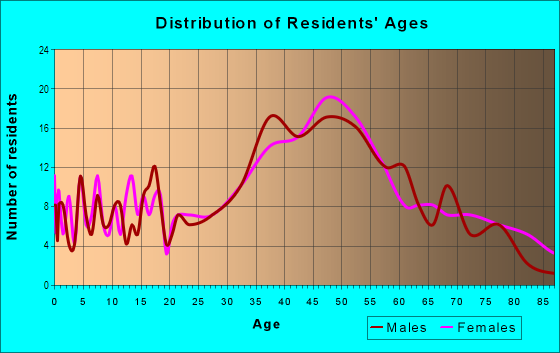
| Males: | 930 |
| Females: | 837 |
Males:
| This neighborhood: | 44.1 years |
| Whole city: | 40.3 years |
| This neighborhood: | 48.3 years |
| Whole city: | 40.5 years |
Average household size:
| Westwood Highlands: | 2.6 people |
| San Francisco: | 2.2 people |
Percentage of family households:
| Westwood Highlands: | 35.7% |
| San Francisco: | 30.3% |
| Here: | 67.3% |
| San Francisco: | 35.3% |
Percentage of married-couple families with children (among all households):
| Westwood Highlands: | 35.3% |
| San Francisco: | 35.9% |
Percentage of single-mother households (among all households):
| Westwood Highlands: | 1.4% |
| San Francisco: | 6.0% |
Percentage of never married males 15 years old and over:
Percentage of never married females 15 years old and over:
| Westwood Highlands: | 11.1% |
| San Francisco: | 24.6% |
Percentage of never married females 15 years old and over:
| Westwood Highlands: | 8.9% |
| city: | 19.9% |
Percentage of people that speak English not well or not at all:
| Westwood Highlands: | 2.5% |
| San Francisco: | 10.9% |
Percentage of people born in this state:
Percentage of people born in another U.S. state:
Percentage of native residents but born outside the U.S.:
Percentage of foreign born residents:
| Here: | 48.8% |
| San Francisco: | 40.8% |
Percentage of people born in another U.S. state:
| Westwood Highlands: | 22.1% |
| San Francisco: | 23.4% |
Percentage of native residents but born outside the U.S.:
| Here: | 2.4% |
| city: | 2.6% |
Percentage of foreign born residents:
| Here: | 26.7% |
| San Francisco: | 33.2% |
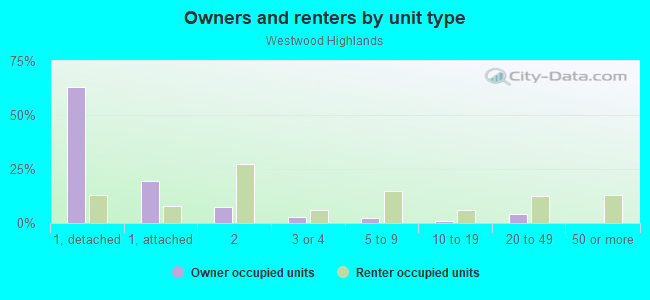
Owner-occupied
Renter-occupied

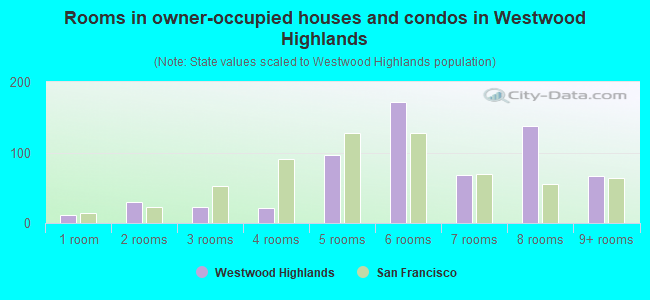
- Rooms in owner-occupied houses and condos in Westwood Highlands
- 121 room
- 302 rooms
- 223 rooms
- 214 rooms
- 965 rooms
- 1726 rooms
- 687 rooms
- 1378 rooms
- 669+ rooms
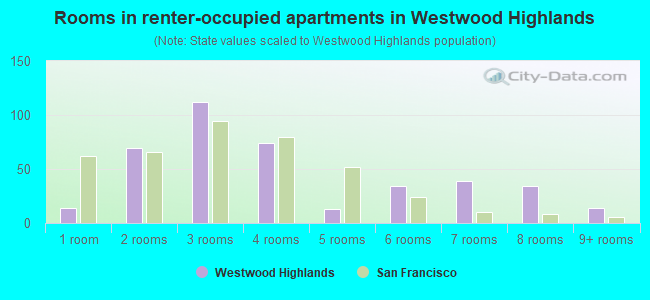
- Rooms in renter-occupied apartments in Westwood Highlands
- 141 room
- 692 rooms
- 1123 rooms
- 744 rooms
- 135 rooms
- 346 rooms
- 397 rooms
- 348 rooms
- 149+ rooms
Owner-occupied
Renter-occupied
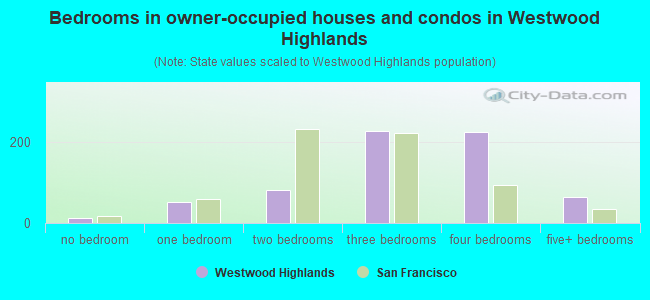
- Bedrooms in owner-occupied houses and condos in Westwood Highlands
- 12no bedroom
- 521 bedroom
- 812 bedrooms
- 2253 bedrooms
- 2244 bedrooms
- 645+ bedrooms
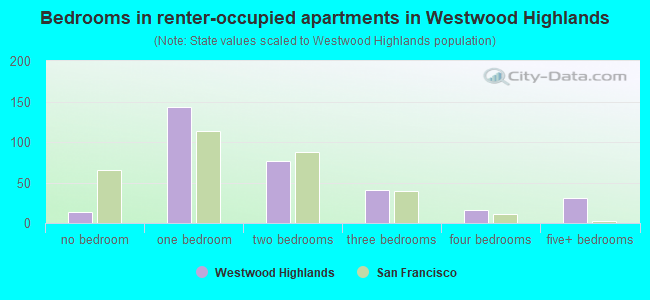
- Bedrooms in renter-occupied apartments in Westwood Highlands
- 14no bedroom
- 1431 bedroom
- 762 bedrooms
- 413 bedrooms
- 164 bedrooms
- 315+ bedrooms
Average number of cars or other vehicles available in houses/condos:
Average number of cars or other vehicles available in apartments:
| This neighborhood: | 1.7 |
| San Francisco: | 1.5 |
Average number of cars or other vehicles available in apartments:
| Here: | 2.4 |
| city: | 0.8 |
Percentage of units with a mortgage:
| Westwood Highlands: | 58.9% |
| San Francisco: | 62.3% |
Average estimated value of detached houses in 2022 (83.0% of all units):
| Westwood Highlands: | $1,827,961 |
| San Francisco: | $1,942,973 |
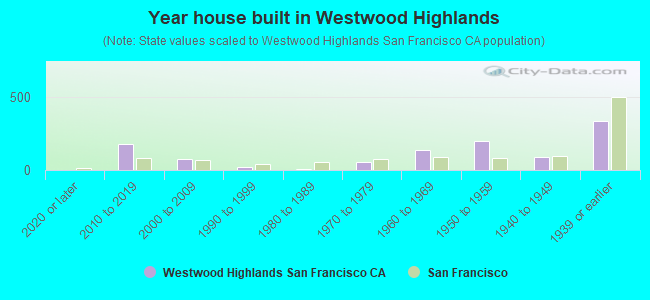
- Year house built in Westwood Highlands
- 02020 or later
- 1782010 to 2019
- 782000 to 2009
- 201990 to 1999
- 71980 to 1989
- 571970 to 1979
- 1391960 to 1969
- 1961950 to 1959
- 891940 to 1949
- 3361939 or earlier
City-data.com crime index for city in 2020 (higher means more crime):
| City: | 387.4 |
| U.S. average: | 219.5 |
Travel time to work (commute)
![Travel time to work (commute)]()
- 15Less than 5 minutes
- 125 to 9 minutes
- 5110 to 14 minutes
- 5615 to 19 minutes
- 13620 to 24 minutes
- 3525 to 29 minutes
- 19830 to 34 minutes
- 4035 to 39 minutes
- 3640 to 44 minutes
- 4645 to 59 minutes
- 7860 to 89 minutes
- 1490 or more minutes

Means of transportation to work
![Means of transportation to work]()
- 51.4%471Drove a car alone
- 4.8%44Carpooled
- 3.8%35Bus
- 6.1%56Subway or elevated rail
- 1.4%13Long-distance train or commuter rail
- 1.9%17Light rail, streetcar or trolley
- 2.1%19Taxi
- 6.2%57Motorcycle
- 6.5%60Bicycle
- 2.2%20Walked
- 1.2%11Other means
- 21.5%197Worked at home

Time leaving home to go to work
![Time leaving home to go to work]()
- 5912:00 a.m. to 4:59 a.m.
- 65:00 a.m. to 5:29 a.m.
- 115:30 a.m. to 5:59 a.m.
- 446:00 a.m. to 6:29 a.m.
- 466:30 a.m. to 6:59 a.m.
- 807:00 a.m. to 7:29 a.m.
- 1237:30 a.m. to 7:59 a.m.
- 1278:00 a.m. to 8:29 a.m.
- 1018:30 a.m. to 8:59 a.m.
- 769:00 a.m. to 9:59 a.m.
- 1210:00 a.m. to 10:59 a.m.
- 1011:00 a.m. to 11:59 a.m.
- 2212:00 p.m. to 3:59 p.m.
- 294:00 p.m. to 11:59 p.m.

Occupations of males:
- Percentage of males in management occupations (except farmers):
Here: 34.5% city: 17.2%
- Percentage of males in business and financial operations occupations:
Here: 1.9% city: 8.9%
- Percentage of males in computer and mathematical occupations:
Here: 8.7% city: 14.6%
- Percentage of males in architecture and engineering occupations:
Here: 2.3% city: 4.0%
- Percentage of males in life, physical, and social science occupations:
Here: 1.9% city: 2.4%
- Percentage of males in legal occupations:
Here: 2.9% city: 2.5%
- Percentage of males in education, training, and library occupations:
Here: 11.9% city: 3.4%
- Percentage of males in arts, design, entertainment, sports, and media occupations:
Here: 3.6% city: 4.9%
- Percentage of males in healthcare practitioners and technical occupations:
Here: 6.9% city: 3.2%
- Percentage of males in sales and office occupations:
Here: 19.2% city: 13.5%
Occupations of females:
- Percentage of females in management occupations (except farmers):
Here: 17.3% city: 15.8%
- Percentage of females in business and financial operations occupations:
Here: 17.2% city: 11.5%
- Percentage of females in computer and mathematical occupations:
Here: 4.9% city: 5.1%
- Percentage of females in life, physical, and social science occupations:
Here: 2.5% city: 2.9%
- Percentage of females in community and social services occupations:
Here: 4.8% city: 1.6%
- Percentage of females in education, training, and library occupations:
Here: 3.5% city: 7.1%
- Percentage of females in arts, design, entertainment, sports, and media occupations:
Here: 4.3% city: 5.1%
- Percentage of females in healthcare practitioners and technical occupations:
Here: 12.4% city: 8.4%
- Percentage of females in service occupations:
Here: 12.3% city: 15.4%
- Percentage of females in sales and office occupations:
Here: 19.1% city: 19.3%
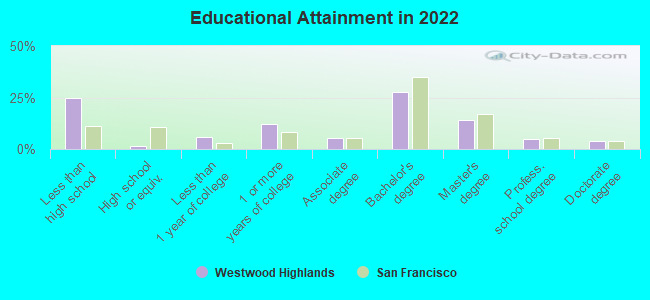
Education in this neighborhood (subdivision or community):
- Percentage of people 3 years and older in K-12 schools:
Westwood Highlands: 15.1% San Francisco: 9.7%
- Percentage of people 3 years and older in undergraduate colleges:
Westwood Highlands: 3.9% San Francisco: 4.8%
- Percentage of people 3 years and older in grad. or professional schools:
Westwood Highlands: 5.7% San Francisco: 2.6%
- Percentage of students K-12 enrolled in private schools:
Westwood Highlands: 83.3% San Francisco: 36.5%
Percentage of population below poverty level:
| Westwood Highlands: | 5.4% |
| San Francisco: | 10.4% |
Median year owner moved in (as recorded in 2022):
| Westwood Highlands: | 2000 |
| San Francisco: | 2007 |
Percentage of married-couple families with both working:
| Westwood Highlands: | 112.3% |
| San Francisco: | 75.9% |
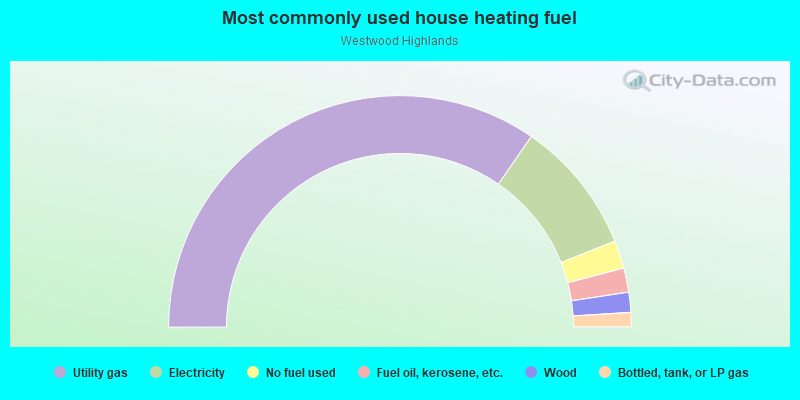
- 69.3%Utility gas
- 18.7%Electricity
- 3.9%No fuel used
- 3.4%Fuel oil, kerosene, etc.
- 2.8%Wood
- 2.0%Bottled, tank, or LP gas
Roads and streets:
Monterey Blvd
Length: 0.76 miles
Directions: E-W, SW-NE
Address range: 801 to 985
Directions: E-W, SW-NE
Address range: 801 to 985
Los Palmos Dr
Length: 0.51 miles
Directions: E-W, SE-NW, SW-NE
Address range: 400 to 699
Directions: E-W, SE-NW, SW-NE
Address range: 400 to 699
Cresta Vista Dr
Length: 0.38 miles
Directions: E-W, SE-NW, SW-NE
Address range: 86 to 365
Directions: E-W, SE-NW, SW-NE
Address range: 86 to 365
Brentwood Ave
Length: 0.32 miles
Directions: E-W, SE-NW, SW-NE
Address range: 1 to 162
Directions: E-W, SE-NW, SW-NE
Address range: 1 to 162
Hazelwood Ave
Length: 0.32 miles
Directions: E-W, N-S, SE-NW
Address range: 200 to 499
Directions: E-W, N-S, SE-NW
Address range: 200 to 499
Mangels Ave
Length: 0.30 miles
Direction: E-W
Address range: 700 to 999
Direction: E-W
Address range: 700 to 999
Melrose Ave
Length: 0.25 miles
Directions: E-W, SW-NE
Address range: 336 to 599
Directions: E-W, SW-NE
Address range: 336 to 599
Colon Ave
Length: 0.23 miles
Directions: N-S, SE-NW
Address range: 300 to 499
Directions: N-S, SE-NW
Address range: 300 to 499
Valdez Ave
Length: 0.21 miles
Directions: N-S, SE-NW
Address range: 200 to 399
Directions: N-S, SE-NW
Address range: 200 to 399
Burlwood Dr
Length: 0.19 miles
Directions: E-W, SE-NW, SW-NE
Address range: 1 to 99
Directions: E-W, SE-NW, SW-NE
Address range: 1 to 99
Joost Ave
Length: 0.11 miles
Direction: E-W
Address range: 800 to 899
Direction: E-W
Address range: 800 to 899
Ridgewood Ave
Length: 0.10 miles
Direction: N-S
Address range: 200 to 399
Direction: N-S
Address range: 200 to 399
Lulu Aly
Length: 0.10 miles
Direction: SE-NW
Address range: 1 to 59
Direction: SE-NW
Address range: 1 to 59
Plymouth Ave
Length: 0.08 miles
Direction: N-S
Address range: 1600 to 1649
Direction: N-S
Address range: 1600 to 1649
Bella Vista Way
Length: 0.06 miles
Direction: SE-NW
Address range: 600 to 699
Direction: SE-NW
Address range: 600 to 699
Stanford Heights Ave
Length: 0.03 miles
Direction: SW-NE
Address range: 1 to 20
Direction: SW-NE
Address range: 1 to 20