Sunnyside neighborhood in San Francisco, California (CA), 94112, 94127, 94131 detailed profile
Settings
X

Business Search - 14 Million verified businesses
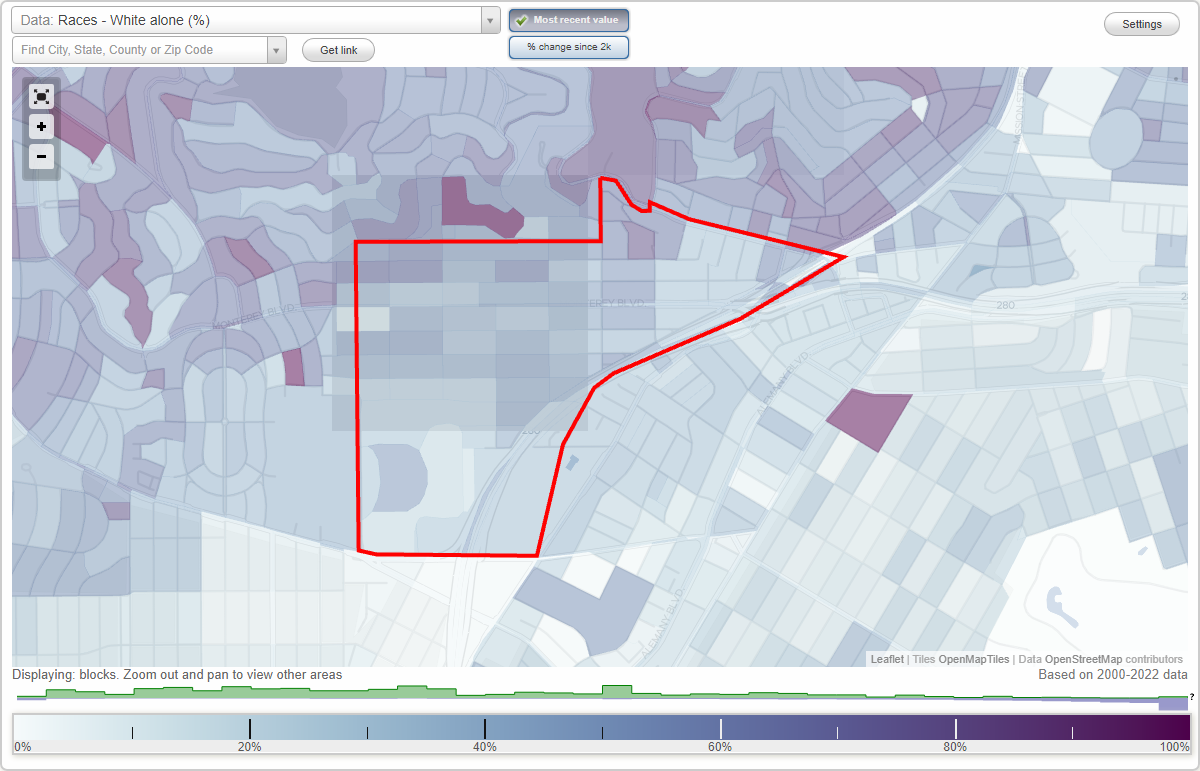
Area: 0.513 square miles
Population: 7,843
Population density:
| Sunnyside: | 15,280 people per square mile |
| San Francisco: | 17,313 people per square mile |

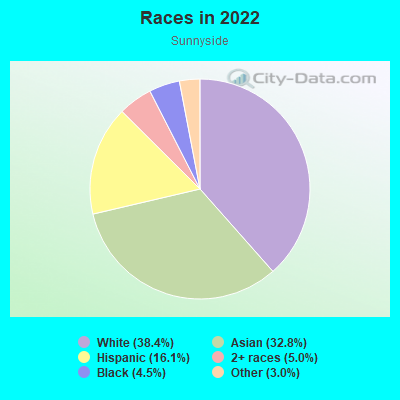
- 3,09238.4%White
- 2,63632.8%Asian
- 1,29716.1%Hispanic or Latino
- 4065.0%Two or more races
- 3634.5%Black
- 2443.0%Some other race
- 50.06%American Indian
Distribution of median household income
![Distribution of median household income]()
- 143Less than $10,000
- 259$10,000 to $19,999
- 112$20,000 to $29,999
- 387$30,000 to $39,999
- 454$40,000 to $49,999
- 90$50,000 to $59,999
- 162$60,000 to $74,999
- 160$75,000 to $99,999
- 325$100,000 to $124,999
- 292$125,000 to $149,999
- 362$150,000 to $199,999
- 1,399$200,000 or more

Distribution of owner-occupied house/condo value
![Distribution of owner-occupied house/condo value]()
- 187Less than $50,000
- 37$100,000 to $149,999
- 89$150,000 to $199,999
- 37$200,000 to $249,999
- 68$250,000 to $299,999
- 21$300,000 to $399,999
- 34$400,000 to $499,999
- 66$500,000 to $749,999
- 175$750,000 to $999,999
- 1,762$1,000,000 or more

Distribution of rent paid by renters
![Distribution of rent paid by renters]()
- 221$200 to $299
- 81$300 to $399
- 131$400 to $499
- 162$700 to $799
- 109$800 to $899
- 240$1,000 to $1,249
- 153$1,250 to $1,499
- 213$1,500 to $1,999
- 1,077$2,000 or more

| Males: | 3,946 |
| Females: | 3,897 |
Males:
| This neighborhood: | 42.2 years |
| Whole city: | 40.3 years |
| This neighborhood: | 45.7 years |
| Whole city: | 40.5 years |
Average household size:
| Sunnyside: | 7.6 people |
| San Francisco: | 2.2 people |
Percentage of family households:
| Sunnyside: | 42.4% |
| San Francisco: | 30.3% |
| Here: | 54.1% |
| San Francisco: | 35.3% |
Percentage of married-couple families with children (among all households):
| Sunnyside: | 33.2% |
| San Francisco: | 35.9% |
Percentage of single-mother households (among all households):
| Sunnyside: | 4.8% |
| San Francisco: | 6.0% |
Percentage of never married males 15 years old and over:
Percentage of never married females 15 years old and over:
| Sunnyside: | 20.1% |
| San Francisco: | 24.6% |
Percentage of never married females 15 years old and over:
| Sunnyside: | 16.6% |
| city: | 19.9% |
Percentage of people that speak English not well or not at all:
| Sunnyside: | 5.9% |
| San Francisco: | 10.9% |
Percentage of people born in this state:
Percentage of people born in another U.S. state:
Percentage of native residents but born outside the U.S.:
Percentage of foreign born residents:
| Here: | 46.7% |
| San Francisco: | 40.8% |
Percentage of people born in another U.S. state:
| Sunnyside: | 25.2% |
| San Francisco: | 23.4% |
Percentage of native residents but born outside the U.S.:
| Here: | 4.7% |
| city: | 2.6% |
Percentage of foreign born residents:
| Here: | 23.4% |
| San Francisco: | 33.2% |
Owner-occupied
Renter-occupied

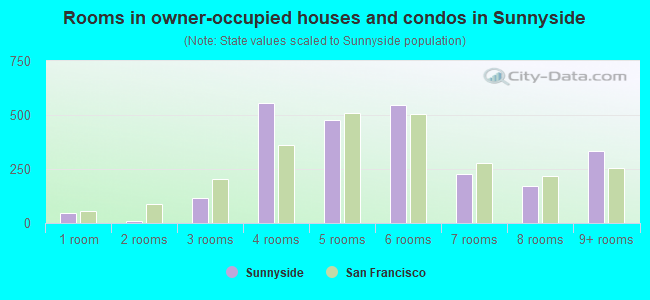
- Rooms in owner-occupied houses and condos in Sunnyside
- 451 room
- 112 rooms
- 1173 rooms
- 5544 rooms
- 4765 rooms
- 5476 rooms
- 2257 rooms
- 1728 rooms
- 3349+ rooms
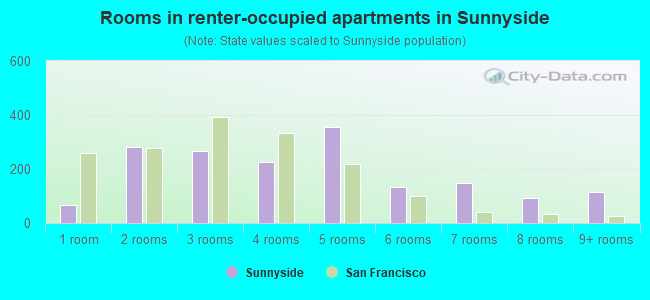
- Rooms in renter-occupied apartments in Sunnyside
- 671 room
- 2812 rooms
- 2653 rooms
- 2274 rooms
- 3545 rooms
- 1346 rooms
- 1477 rooms
- 928 rooms
- 1169+ rooms
Owner-occupied
Renter-occupied
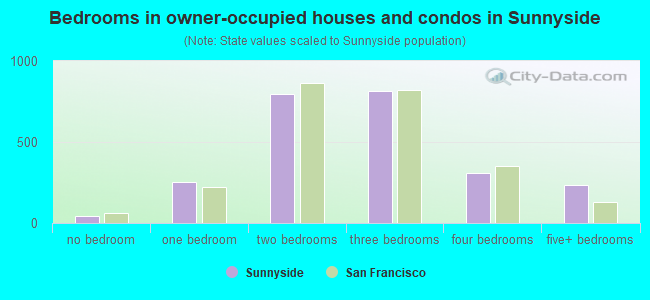
- Bedrooms in owner-occupied houses and condos in Sunnyside
- 45no bedroom
- 2521 bedroom
- 7952 bedrooms
- 8143 bedrooms
- 3104 bedrooms
- 2325+ bedrooms
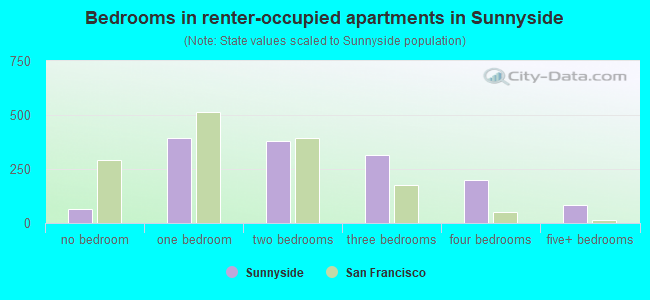
- Bedrooms in renter-occupied apartments in Sunnyside
- 67no bedroom
- 3921 bedroom
- 3802 bedrooms
- 3163 bedrooms
- 1974 bedrooms
- 845+ bedrooms
Average number of cars or other vehicles available in houses/condos:
Average number of cars or other vehicles available in apartments:
| This neighborhood: | 1.7 |
| San Francisco: | 1.5 |
Average number of cars or other vehicles available in apartments:
| Here: | 1.2 |
| city: | 0.8 |
Percentage of units with a mortgage:
| Sunnyside: | 69.5% |
| San Francisco: | 62.3% |
Housing prices:
- Average estimated value of detached houses in 2022 (52.8% of all units):
Sunnyside: $1,827,535 San Francisco: $1,942,973
- Average estimated value of townhouses or other attached units in 2022 (28.7% of all units):
This neighborhood: $1,216,583 city: $1,528,422
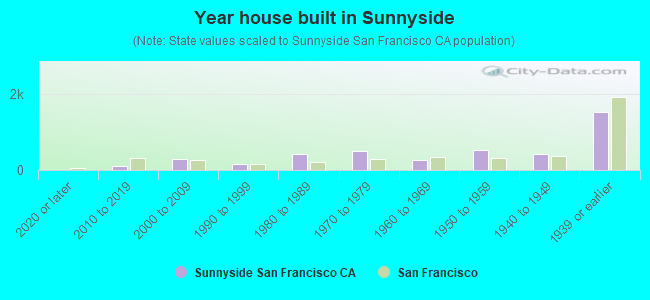
- Year house built in Sunnyside
- 02020 or later
- 1162010 to 2019
- 2812000 to 2009
- 1541990 to 1999
- 4241980 to 1989
- 5121970 to 1979
- 2541960 to 1969
- 5371950 to 1959
- 4251940 to 1949
- 1,5381939 or earlier
City-data.com crime index for city in 2020 (higher means more crime):
| City: | 387.4 |
| U.S. average: | 219.5 |
Travel time to work (commute)
![Travel time to work (commute)]()
- 60Less than 5 minutes
- 775 to 9 minutes
- 17810 to 14 minutes
- 27215 to 19 minutes
- 37920 to 24 minutes
- 36225 to 29 minutes
- 82030 to 34 minutes
- 12335 to 39 minutes
- 13540 to 44 minutes
- 49545 to 59 minutes
- 23160 to 89 minutes
- 6590 or more minutes

Means of transportation to work
![Means of transportation to work]()
- 34.0%1,564Drove a car alone
- 8.5%389Carpooled
- 4.2%195Bus
- 17.3%795Subway or elevated rail
- 3.2%145Long-distance train or commuter rail
- 3.6%166Light rail, streetcar or trolley
- 3.5%159Taxi
- 3.7%168Motorcycle
- 2.6%119Bicycle
- 2.3%106Walked
- 3.7%171Other means
- 30.9%1,421Worked at home

Time leaving home to go to work
![Time leaving home to go to work]()
- 5512:00 a.m. to 4:59 a.m.
- 155:00 a.m. to 5:29 a.m.
- 195:30 a.m. to 5:59 a.m.
- 2366:00 a.m. to 6:29 a.m.
- 1856:30 a.m. to 6:59 a.m.
- 2377:00 a.m. to 7:29 a.m.
- 8267:30 a.m. to 7:59 a.m.
- 4898:00 a.m. to 8:29 a.m.
- 3648:30 a.m. to 8:59 a.m.
- 2939:00 a.m. to 9:59 a.m.
- 9110:00 a.m. to 10:59 a.m.
- 1311:00 a.m. to 11:59 a.m.
- 12512:00 p.m. to 3:59 p.m.
- 1424:00 p.m. to 11:59 p.m.

Occupations of males:
- Percentage of males in management occupations (except farmers):
Here: 15.5% city: 17.2%
- Percentage of males in business and financial operations occupations:
Here: 7.8% city: 8.9%
- Percentage of males in computer and mathematical occupations:
Here: 18.4% city: 14.6%
- Percentage of males in architecture and engineering occupations:
Here: 7.2% city: 4.0%
- Percentage of males in life, physical, and social science occupations:
Here: 3.1% city: 2.4%
- Percentage of males in community and social services occupations:
Here: 1.6% city: 1.0%
- Percentage of males in arts, design, entertainment, sports, and media occupations:
Here: 4.8% city: 4.9%
- Percentage of males in healthcare practitioners and technical occupations:
Here: 3.3% city: 3.2%
- Percentage of males in service occupations:
Here: 13.9% city: 11.8%
- Percentage of males in sales and office occupations:
Here: 12.9% city: 13.5%
- Percentage of males in construction, extraction, and maintenance occupations:
Here: 1.0% city: 3.1%
- Percentage of males in production occupations:
Here: 1.0% city: 2.5%
- Percentage of males in transportation occupations:
Here: 5.2% city: 3.4%
Occupations of females:
- Percentage of females in management occupations (except farmers):
Here: 17.5% city: 15.8%
- Percentage of females in business and financial operations occupations:
Here: 4.7% city: 11.5%
- Percentage of females in computer and mathematical occupations:
Here: 2.5% city: 5.1%
- Percentage of females in architecture and engineering occupations:
Here: 6.3% city: 1.6%
- Percentage of females in life, physical, and social science occupations:
Here: 5.3% city: 2.9%
- Percentage of females in legal occupations:
Here: 2.8% city: 3.0%
- Percentage of females in education, training, and library occupations:
Here: 12.1% city: 7.1%
- Percentage of females in arts, design, entertainment, sports, and media occupations:
Here: 4.5% city: 5.1%
- Percentage of females in healthcare practitioners and technical occupations:
Here: 6.6% city: 8.4%
- Percentage of females in service occupations:
Here: 10.6% city: 15.4%
- Percentage of females in sales and office occupations:
Here: 24.6% city: 19.3%
- Percentage of females in production occupations:
Here: 1.6% city: 1.5%
Percentage of people 16-64 in Armed Forces:
| Sunnyside: | 0.0% |
| San Francisco: | 0.1% |
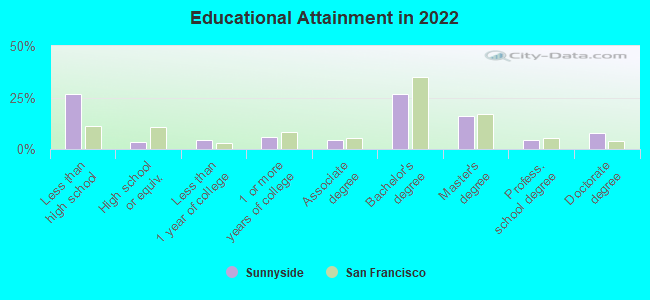
Education in this neighborhood (subdivision or community):
- Percentage of people 3 years and older in K-12 schools:
Sunnyside: 18.4% San Francisco: 9.7%
- Percentage of people 3 years and older in undergraduate colleges:
Sunnyside: 4.1% San Francisco: 4.8%
- Percentage of people 3 years and older in grad. or professional schools:
Sunnyside: 5.8% San Francisco: 2.6%
- Percentage of students K-12 enrolled in private schools:
Sunnyside: 100.6% San Francisco: 36.5%
Percentage of population below poverty level:
| Sunnyside: | 2.8% |
| San Francisco: | 10.4% |
Median year owner moved in (as recorded in 2022):
Median year renter moved in (as recorded in 2022):
| Sunnyside: | 2002 |
| San Francisco: | 2007 |
Median year renter moved in (as recorded in 2022):
| Sunnyside: | 2015 |
| San Francisco: | 2019 |
Percentage of married-couple families with both working:
| Sunnyside: | 105.0% |
| San Francisco: | 75.9% |
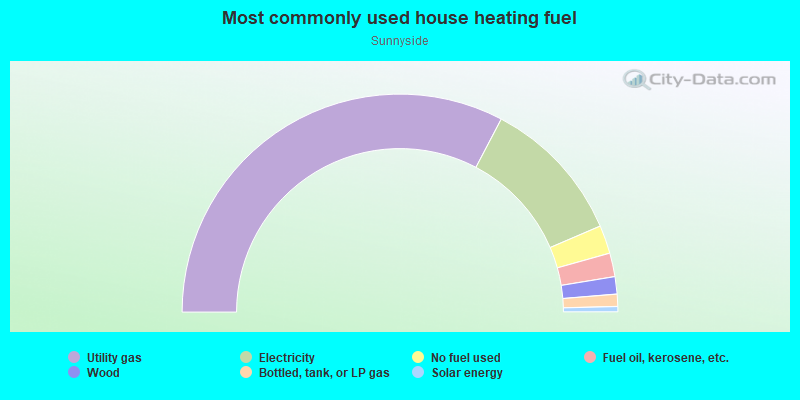
- 65.4%Utility gas
- 21.7%Electricity
- 4.2%No fuel used
- 3.5%Fuel oil, kerosene, etc.
- 2.6%Wood
- 1.8%Bottled, tank, or LP gas
- 0.8%Solar energy
Limited-access highways (interstate or state) in this neighborhood:
I- 280
Length: 1.52 miles
Directions: E-W, N-S, SW-NE
Directions: E-W, N-S, SW-NE
Roads and streets:
Monterey Blvd
Length: 2.29 miles
Directions: E-W, SE-NW, SW-NE
Address range: 1 to 699
Directions: E-W, SE-NW, SW-NE
Address range: 1 to 699
Circular Ave
Length: 1.25 miles
Directions: E-W, SW-NE
Address range: 2 to 699
Directions: E-W, SW-NE
Address range: 2 to 699
Joost Ave
Length: 1.13 miles
Directions: E-W, SE-NW
Address range: 1 to 699
Directions: E-W, SE-NW
Address range: 1 to 699
Mangels Ave
Length: 0.92 miles
Direction: E-W
Address range: 1 to 599
Direction: E-W
Address range: 1 to 599
Bosworth St
Length: 0.91 miles
Directions: E-W, SE-NW
Address range: 493 to 1099
Directions: E-W, SE-NW
Address range: 493 to 1099
Hearst Ave
Length: 0.86 miles
Direction: E-W
Address range: 1 to 599
Direction: E-W
Address range: 1 to 599
Flood Ave
Length: 0.81 miles
Direction: E-W
Address range: 1 to 561
Direction: E-W
Address range: 1 to 561
Staples Ave
Length: 0.68 miles
Direction: E-W
Address range: 1 to 499
Direction: E-W
Address range: 1 to 499
Judson Ave
Length: 0.60 miles
Direction: E-W
Address range: 100 to 499
Direction: E-W
Address range: 100 to 499
San Jose Ave
Length: 0.57 miles
Direction: SW-NE
Address range: 24 to 1579
Direction: SW-NE
Address range: 24 to 1579
Cloud Cir
Length: 0.49 miles
Directions: E-W, N-S, SE-NW, SW-NE
Address range: 1 to 299
Directions: E-W, N-S, SE-NW, SW-NE
Address range: 1 to 299
Edna St
Length: 0.44 miles
Direction: N-S
Address range: 1 to 799
Direction: N-S
Address range: 1 to 799
Phelan Ave
Length: 0.38 miles
Direction: N-S
Address range: 19 to 399
Direction: N-S
Address range: 19 to 399
Arco Way
Length: 0.38 miles
Directions: E-W, N-S, SW-NE
Address range: 1 to 799
Directions: E-W, N-S, SW-NE
Address range: 1 to 799
West Rd
Length: 0.36 miles
Directions: E-W, N-S, SE-NW, SW-NE
Directions: E-W, N-S, SE-NW, SW-NE
Marston Ave
Length: 0.35 miles
Directions: E-W, SW-NE
Address range: 1 to 199
Directions: E-W, SW-NE
Address range: 1 to 199
Detroit St
Length: 0.33 miles
Direction: N-S
Address range: 100 to 699
Direction: N-S
Address range: 100 to 699
Gennessee St
Length: 0.32 miles
Direction: N-S
Address range: 1 to 599
Direction: N-S
Address range: 1 to 599
Foerster St
Length: 0.32 miles
Direction: N-S
Address range: 1 to 599
Direction: N-S
Address range: 1 to 599
Baden St
Length: 0.28 miles
Directions: N-S, SE-NW
Address range: 1 to 499
Directions: N-S, SE-NW
Address range: 1 to 499
Congo St
Length: 0.26 miles
Directions: N-S, SW-NE
Address range: 1 to 499
Directions: N-S, SW-NE
Address range: 1 to 499
Havelock St
Length: 0.19 miles
Direction: E-W
Address range: 150 to 399
Direction: E-W
Address range: 150 to 399
Martha Ave
Length: 0.18 miles
Directions: E-W, N-S, SE-NW, SW-NE
Address range: 1 to 99
Directions: E-W, N-S, SE-NW, SW-NE
Address range: 1 to 99
Science Cir
Length: 0.17 miles
Directions: N-S, SE-NW, SW-NE
Address range: 1 to 99
Directions: N-S, SE-NW, SW-NE
Address range: 1 to 99
East Rd
Length: 0.17 miles
Directions: E-W, N-S, SW-NE
Directions: E-W, N-S, SW-NE
Diamond St
Length: 0.12 miles
Directions: N-S, SW-NE
Address range: 2900 to 2999
Directions: N-S, SW-NE
Address range: 2900 to 2999
Lippard Ave
Length: 0.11 miles
Direction: N-S
Address range: 100 to 199
Direction: N-S
Address range: 100 to 199
Nordhoff St
Length: 0.10 miles
Directions: N-S, SE-NW
Address range: 1 to 99
Directions: N-S, SE-NW
Address range: 1 to 99
Brompton Ave
Length: 0.10 miles
Direction: N-S
Address range: 100 to 199
Direction: N-S
Address range: 100 to 199
Acadia St
Length: 0.09 miles
Direction: N-S
Address range: 100 to 299
Direction: N-S
Address range: 100 to 299
Burnside Ave
Length: 0.09 miles
Direction: N-S
Address range: 100 to 199
Direction: N-S
Address range: 100 to 199
Chilton Ave
Length: 0.09 miles
Direction: N-S
Address range: 100 to 199
Direction: N-S
Address range: 100 to 199
Hamerton Ave
Length: 0.08 miles
Direction: N-S
Address range: 100 to 199
Direction: N-S
Address range: 100 to 199
Paulding St
Length: 0.07 miles
Directions: E-W, SE-NW
Address range: 47 to 99
Directions: E-W, SE-NW
Address range: 47 to 99
Calvert Dr
Length: 0.03 miles
Direction: E-W
Address range: 94 to 99
Direction: E-W
Address range: 94 to 99
Stillings Ave
Length: 0.03 miles
Direction: E-W
Address range: 1 to 48
Direction: E-W
Address range: 1 to 48
Gorham St
Length: 0.01 miles
Direction: SE-NW
Direction: SE-NW