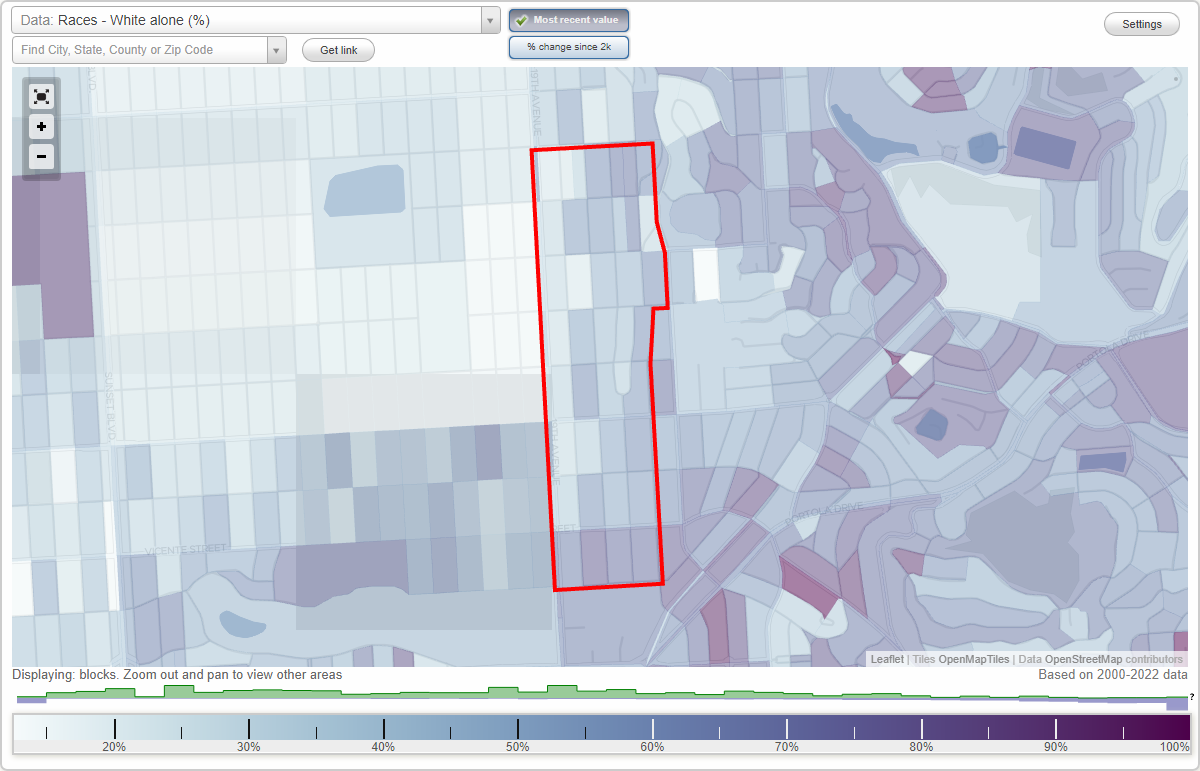
Inner Parkside neighborhood in San Francisco, California (CA), 94116 detailed profile
Settings
X

Business Search - 14 Million verified businesses
Area: 0.276 square miles
Population: 4,817
Population density:
| Inner Parkside: | 17,442 people per square mile |
| San Francisco: | 17,313 people per square mile |

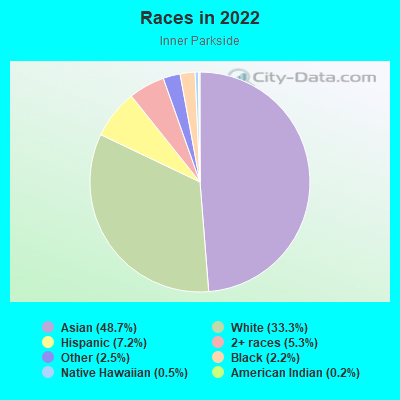
- 2,44748.7%Asian
- 1,67133.3%White
- 3637.2%Hispanic or Latino
- 2675.3%Two or more races
- 1272.5%Some other race
- 1102.2%Black
- 270.5%Native Hawaiian and Other
Pacific Islander - 100.2%American Indian
Median household income in 2022:
| Inner Parkside: | $144,444 |
| San Francisco: | $136,692 |
Distribution of median household income
![Distribution of median household income]()
- 39Less than $10,000
- 248$10,000 to $19,999
- 55$20,000 to $29,999
- 320$30,000 to $39,999
- 262$40,000 to $49,999
- 54$50,000 to $59,999
- 98$60,000 to $74,999
- 269$75,000 to $99,999
- 219$100,000 to $124,999
- 168$125,000 to $149,999
- 177$150,000 to $199,999
- 637$200,000 or more

Distribution of owner-occupied house/condo value
![Distribution of owner-occupied house/condo value]()
- 44Less than $50,000
- 14$100,000 to $149,999
- 64$150,000 to $199,999
- 32$300,000 to $399,999
- 33$400,000 to $499,999
- 64$500,000 to $749,999
- 116$750,000 to $999,999
- 1,316$1,000,000 or more

Distribution of rent paid by renters
![Distribution of rent paid by renters]()
- 109$900 to $999
- 113$1,000 to $1,249
- 12$1,250 to $1,499
- 32$1,500 to $1,999
- 297$2,000 or more

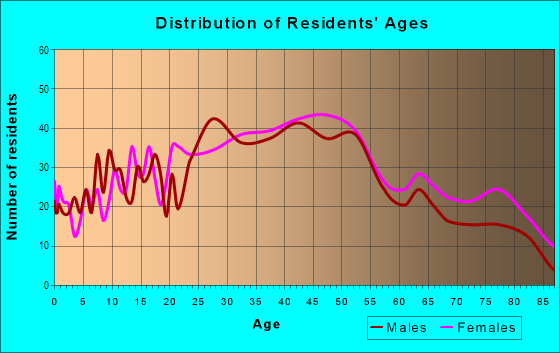
| Males: | 2,324 |
| Females: | 2,492 |
Males:
| This neighborhood: | 47.7 years |
| Whole city: | 40.3 years |
| This neighborhood: | 52.0 years |
| Whole city: | 40.5 years |
Average household size:
| Inner Parkside: | 7.0 people |
| San Francisco: | 2.2 people |
Percentage of family households:
| Inner Parkside: | 29.1% |
| San Francisco: | 30.3% |
| Here: | 56.7% |
| San Francisco: | 35.3% |
Percentage of married-couple families with children (among all households):
| Inner Parkside: | 35.0% |
| San Francisco: | 35.9% |
Percentage of single-mother households (among all households):
| Inner Parkside: | 2.7% |
| San Francisco: | 6.0% |
Percentage of never married males 15 years old and over:
Percentage of never married females 15 years old and over:
| Inner Parkside: | 14.5% |
| San Francisco: | 24.6% |
Percentage of never married females 15 years old and over:
| Inner Parkside: | 12.0% |
| city: | 19.9% |
Percentage of people that speak English not well or not at all:
| Inner Parkside: | 12.0% |
| San Francisco: | 10.9% |
Percentage of people born in this state:
Percentage of people born in another U.S. state:
Percentage of native residents but born outside the U.S.:
Percentage of foreign born residents:
| Here: | 44.2% |
| San Francisco: | 40.8% |
Percentage of people born in another U.S. state:
| Inner Parkside: | 18.6% |
| San Francisco: | 23.4% |
Percentage of native residents but born outside the U.S.:
| Here: | 2.5% |
| city: | 2.6% |
Percentage of foreign born residents:
| Here: | 34.7% |
| San Francisco: | 33.2% |
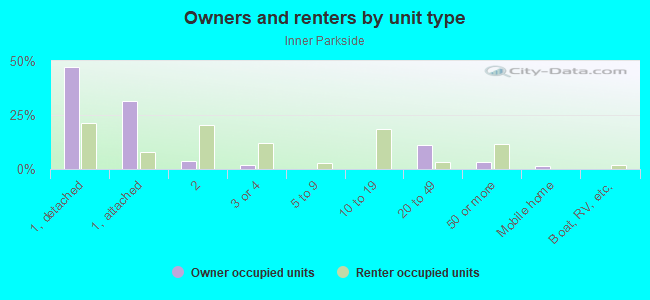
Owner-occupied
Renter-occupied

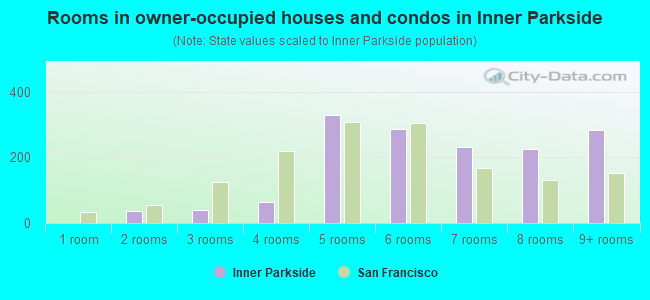
- Rooms in owner-occupied houses and condos in Inner Parkside
- 01 room
- 362 rooms
- 413 rooms
- 644 rooms
- 3295 rooms
- 2856 rooms
- 2327 rooms
- 2268 rooms
- 2849+ rooms
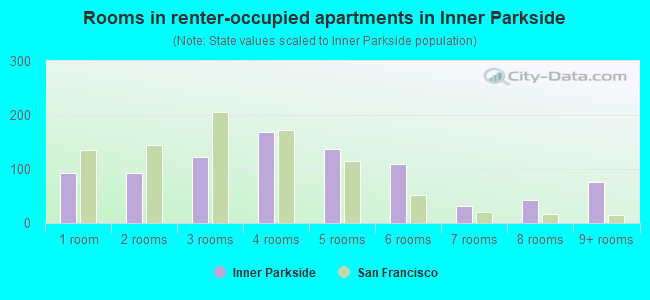
- Rooms in renter-occupied apartments in Inner Parkside
- 921 room
- 922 rooms
- 1223 rooms
- 1694 rooms
- 1375 rooms
- 1106 rooms
- 327 rooms
- 438 rooms
- 769+ rooms
Owner-occupied
Renter-occupied
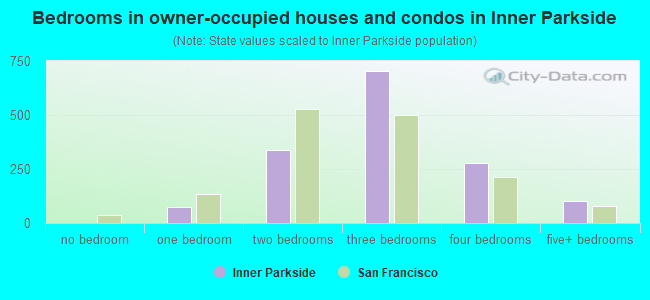
- Bedrooms in owner-occupied houses and condos in Inner Parkside
- 0no bedroom
- 761 bedroom
- 3392 bedrooms
- 7023 bedrooms
- 2784 bedrooms
- 1015+ bedrooms
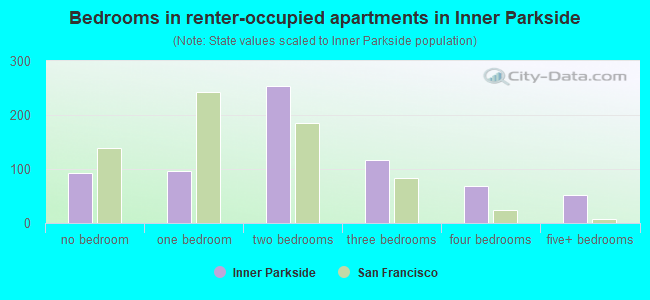
- Bedrooms in renter-occupied apartments in Inner Parkside
- 92no bedroom
- 971 bedroom
- 2542 bedrooms
- 1173 bedrooms
- 694 bedrooms
- 515+ bedrooms
Average number of cars or other vehicles available in houses/condos:
Average number of cars or other vehicles available in apartments:
| This neighborhood: | 1.6 |
| San Francisco: | 1.5 |
Average number of cars or other vehicles available in apartments:
| Here: | |
| city: |
Percentage of units with a mortgage:
| Inner Parkside: | 52.3% |
| San Francisco: | 62.3% |
Housing prices:
- Average estimated value of detached houses in 2022 (51.9% of all units):
Inner Parkside: $1,857,973 San Francisco: $1,942,973
- Average estimated value of townhouses or other attached units in 2022 (31.1% of all units):
This neighborhood: $1,570,049 city: $1,528,422
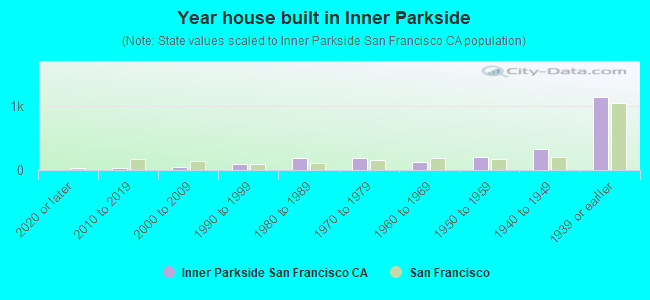
- Year house built in Inner Parkside
- 02020 or later
- 252010 to 2019
- 402000 to 2009
- 891990 to 1999
- 1801980 to 1989
- 1891970 to 1979
- 1261960 to 1969
- 2071950 to 1959
- 3231940 to 1949
- 1,1341939 or earlier
City-data.com crime index for city in 2020 (higher means more crime):
| City: | 387.4 |
| U.S. average: | 219.5 |
Travel time to work (commute)
![Travel time to work (commute)]()
- 51Less than 5 minutes
- 485 to 9 minutes
- 10710 to 14 minutes
- 14115 to 19 minutes
- 29220 to 24 minutes
- 11325 to 29 minutes
- 39130 to 34 minutes
- 16035 to 39 minutes
- 10840 to 44 minutes
- 23845 to 59 minutes
- 11360 to 89 minutes
- 3690 or more minutes

Means of transportation to work
![Means of transportation to work]()
- 39.6%814Drove a car alone
- 12.6%259Carpooled
- 11.0%227Bus
- 5.0%103Subway or elevated rail
- 0.8%16Long-distance train or commuter rail
- 6.2%127Light rail, streetcar or trolley
- 5.3%109Taxi
- 2.7%56Bicycle
- 2.7%56Walked
- 2.0%41Other means
- 24.6%505Worked at home

Time leaving home to go to work
![Time leaving home to go to work]()
- 2312:00 a.m. to 4:59 a.m.
- 215:00 a.m. to 5:29 a.m.
- 285:30 a.m. to 5:59 a.m.
- 956:00 a.m. to 6:29 a.m.
- 1326:30 a.m. to 6:59 a.m.
- 1887:00 a.m. to 7:29 a.m.
- 3897:30 a.m. to 7:59 a.m.
- 4018:00 a.m. to 8:29 a.m.
- 858:30 a.m. to 8:59 a.m.
- 1869:00 a.m. to 9:59 a.m.
- 6610:00 a.m. to 10:59 a.m.
- 6311:00 a.m. to 11:59 a.m.
- 7912:00 p.m. to 3:59 p.m.
- 774:00 p.m. to 11:59 p.m.

Occupations of males:
- Percentage of males in management occupations (except farmers):
Here: 13.5% city: 17.2%
- Percentage of males in business and financial operations occupations:
Here: 7.2% city: 8.9%
- Percentage of males in computer and mathematical occupations:
Here: 14.5% city: 14.6%
- Percentage of males in architecture and engineering occupations:
Here: 6.0% city: 4.0%
- Percentage of males in life, physical, and social science occupations:
Here: 3.0% city: 2.4%
- Percentage of males in community and social services occupations:
Here: 1.3% city: 1.0%
- Percentage of males in legal occupations:
Here: 5.7% city: 2.5%
- Percentage of males in education, training, and library occupations:
Here: 6.7% city: 3.4%
- Percentage of males in healthcare practitioners and technical occupations:
Here: 4.9% city: 3.2%
- Percentage of males in service occupations:
Here: 11.7% city: 11.8%
- Percentage of males in sales and office occupations:
Here: 14.9% city: 13.5%
- Percentage of males in construction, extraction, and maintenance occupations:
Here: 5.8% city: 3.1%
- Percentage of males in production occupations:
Here: 2.6% city: 2.5%
Occupations of females:
- Percentage of females in management occupations (except farmers):
Here: 13.2% city: 15.8%
- Percentage of females in business and financial operations occupations:
Here: 9.0% city: 11.5%
- Percentage of females in computer and mathematical occupations:
Here: 4.8% city: 5.1%
- Percentage of females in architecture and engineering occupations:
Here: 3.5% city: 1.6%
- Percentage of females in life, physical, and social science occupations:
Here: 5.7% city: 2.9%
- Percentage of females in legal occupations:
Here: 1.8% city: 3.0%
- Percentage of females in education, training, and library occupations:
Here: 6.5% city: 7.1%
- Percentage of females in arts, design, entertainment, sports, and media occupations:
Here: 7.7% city: 5.1%
- Percentage of females in healthcare practitioners and technical occupations:
Here: 12.6% city: 8.4%
- Percentage of females in service occupations:
Here: 11.2% city: 15.4%
- Percentage of females in sales and office occupations:
Here: 18.6% city: 19.3%
- Percentage of females in production occupations:
Here: 1.4% city: 1.5%
- Percentage of females in material moving occupations:
Here: 3.6% city: 0.8%
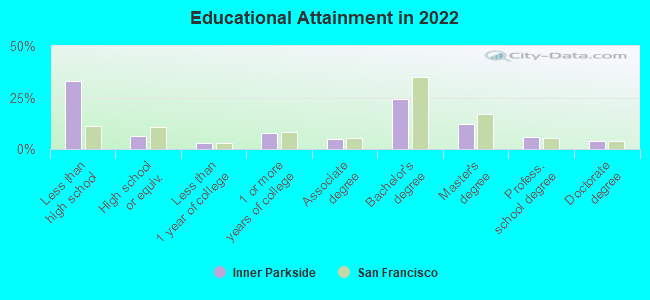
Education in this neighborhood (subdivision or community):
- Percentage of people 3 years and older in K-12 schools:
Inner Parkside: 18.6% San Francisco: 9.7%
- Percentage of people 3 years and older in undergraduate colleges:
Inner Parkside: 4.0% San Francisco: 4.8%
- Percentage of people 3 years and older in grad. or professional schools:
Inner Parkside: 5.4% San Francisco: 2.6%
- Percentage of students K-12 enrolled in private schools:
Inner Parkside: 66.0% San Francisco: 36.5%
Percentage of population below poverty level:
| Inner Parkside: | 4.9% |
| San Francisco: | 10.4% |
Median year owner moved in (as recorded in 2022):
| Inner Parkside: | 2002 |
| San Francisco: | 2007 |
Percentage of married-couple families with both working:
| Inner Parkside: | 81.7% |
| San Francisco: | 75.9% |
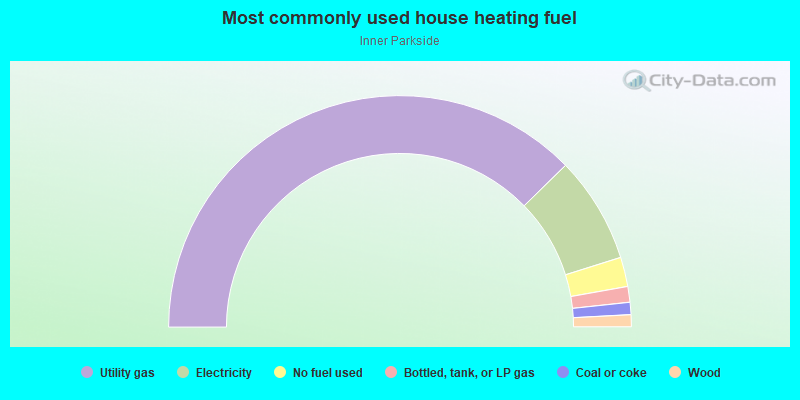
- 75.4%Utility gas
- 14.9%Electricity
- 4.1%No fuel used
- 2.2%Bottled, tank, or LP gas
- 1.7%Coal or coke
- 1.7%Wood
Highways in this neighborhood:
State Hwy 1 (19th Ave)
Length: 1.84 miles
Directions: N-S, SE-NW, SW-NE
Address range: 2000 to 2640
Directions: N-S, SE-NW, SW-NE
Address range: 2000 to 2640
Roads and streets:
16th Ave
Length: 0.92 miles
Directions: N-S, SE-NW
Address range: 2000 to 2699
Directions: N-S, SE-NW
Address range: 2000 to 2699
15th Ave
Length: 0.90 miles
Directions: N-S, SW-NE
Address range: 2000 to 2699
Directions: N-S, SW-NE
Address range: 2000 to 2699
18th Ave
Length: 0.90 miles
Direction: N-S
Address range: 2000 to 2699
Direction: N-S
Address range: 2000 to 2699
17th Ave
Length: 0.90 miles
Direction: N-S
Address range: 2000 to 2699
Direction: N-S
Address range: 2000 to 2699
Rivera St
Length: 0.32 miles
Direction: E-W
Address range: 450 to 899
Direction: E-W
Address range: 450 to 899
Wawona St
Length: 0.30 miles
Direction: E-W
Address range: 400 to 799
Direction: E-W
Address range: 400 to 799
Vicente St
Length: 0.30 miles
Direction: E-W
Address range: 400 to 799
Direction: E-W
Address range: 400 to 799
Ulloa St
Length: 0.30 miles
Direction: E-W
Address range: 1400 to 1799
Direction: E-W
Address range: 1400 to 1799
Taraval St
Length: 0.30 miles
Direction: E-W
Address range: 500 to 899
Direction: E-W
Address range: 500 to 899
Santiago St
Length: 0.30 miles
Direction: E-W
Address range: 400 to 799
Direction: E-W
Address range: 400 to 799
Pacheco St
Length: 0.30 miles
Direction: E-W
Address range: 1100 to 1499
Direction: E-W
Address range: 1100 to 1499
Quintara St
Length: 0.30 miles
Direction: E-W
Address range: 600 to 999
Direction: E-W
Address range: 600 to 999
Cecilia Ave
Length: 0.22 miles
Directions: N-S, SW-NE
Address range: 2100 to 2399
Directions: N-S, SW-NE
Address range: 2100 to 2399
Fanning Way
Length: 0.08 miles
Directions: N-S, SW-NE
Address range: 1 to 99
Directions: N-S, SW-NE
Address range: 1 to 99
Anglo Aly
Length: 0.05 miles
Direction: N-S
Address range: 100 to 199
Direction: N-S
Address range: 100 to 199