Westwood Park neighborhood in San Francisco, California (CA), 94112 detailed profile
Settings
X

Business Search - 14 Million verified businesses
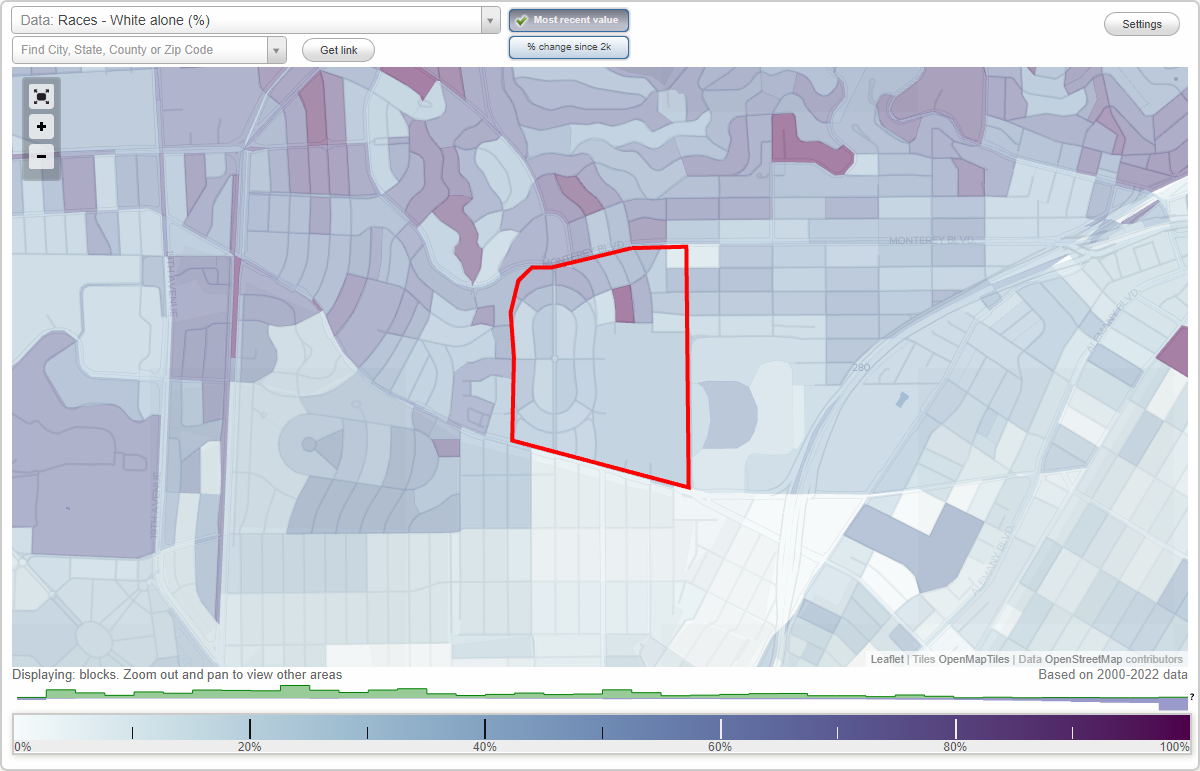
Area: 0.198 square miles
Population: 2,350
Population density:
| Westwood Park: | 11,872 people per square mile |
| San Francisco: | 17,313 people per square mile |

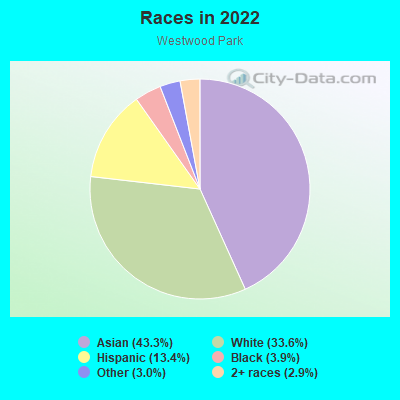
- 1,04743.3%Asian
- 81233.6%White
- 32413.4%Hispanic or Latino
- 943.9%Black
- 723.0%Some other race
- 702.9%Two or more races
Distribution of median household income
![Distribution of median household income]()
- 47Less than $10,000
- 139$10,000 to $19,999
- 34$20,000 to $29,999
- 104$30,000 to $39,999
- 51$40,000 to $49,999
- 28$50,000 to $59,999
- 42$60,000 to $74,999
- 128$75,000 to $99,999
- 109$100,000 to $124,999
- 34$125,000 to $149,999
- 148$150,000 to $199,999
- 274$200,000 or more

Distribution of owner-occupied house/condo value
![Distribution of owner-occupied house/condo value]()
- 60Less than $50,000
- 24$100,000 to $149,999
- 12$150,000 to $199,999
- 5$250,000 to $299,999
- 43$300,000 to $399,999
- 43$500,000 to $749,999
- 40$750,000 to $999,999
- 414$1,000,000 or more

Distribution of rent paid by renters
![Distribution of rent paid by renters]()
- 18$200 to $299
- 48$400 to $499
- 57$700 to $799
- 7$800 to $899
- 14$1,000 to $1,249
- 40$1,250 to $1,499
- 39$1,500 to $1,999
- 301$2,000 or more

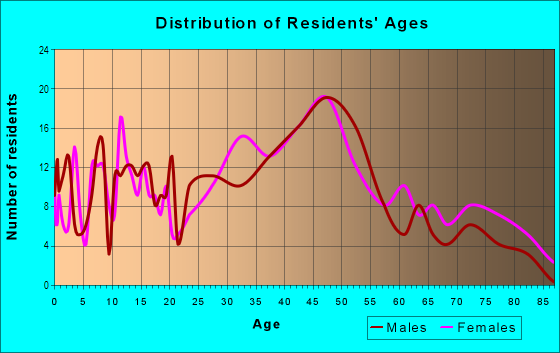
| Males: | 1,136 |
| Females: | 1,213 |
Males:
| This neighborhood: | 44.8 years |
| Whole city: | 40.3 years |
| This neighborhood: | 49.5 years |
| Whole city: | 40.5 years |
Average household size:
| Westwood Park: | 2.8 people |
| San Francisco: | 2.2 people |
Percentage of family households:
| Westwood Park: | 40.1% |
| San Francisco: | 30.3% |
| Here: | 46.3% |
| San Francisco: | 35.3% |
Percentage of married-couple families with children (among all households):
| Westwood Park: | 21.2% |
| San Francisco: | 35.9% |
Percentage of single-mother households (among all households):
| Westwood Park: | 9.5% |
| San Francisco: | 6.0% |
Percentage of never married males 15 years old and over:
Percentage of never married females 15 years old and over:
| Westwood Park: | 15.5% |
| San Francisco: | 24.6% |
Percentage of never married females 15 years old and over:
| Westwood Park: | 15.1% |
| city: | 19.9% |
Percentage of people that speak English not well or not at all:
| Westwood Park: | 8.7% |
| San Francisco: | 10.9% |
Percentage of people born in this state:
Percentage of people born in another U.S. state:
Percentage of native residents but born outside the U.S.:
Percentage of foreign born residents:
| Here: | 46.5% |
| San Francisco: | 40.8% |
Percentage of people born in another U.S. state:
| Westwood Park: | 21.4% |
| San Francisco: | 23.4% |
Percentage of native residents but born outside the U.S.:
| Here: | 1.8% |
| city: | 2.6% |
Percentage of foreign born residents:
| Here: | 30.3% |
| San Francisco: | 33.2% |
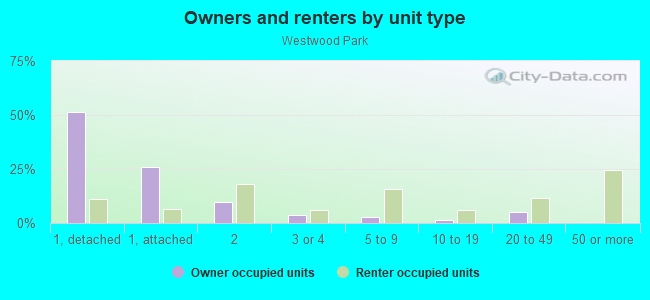
Owner-occupied
Renter-occupied

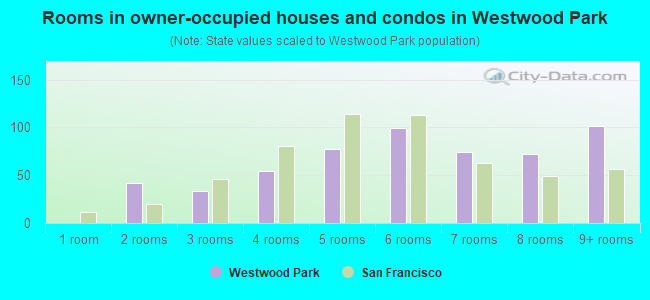
- Rooms in owner-occupied houses and condos in Westwood Park
- 01 room
- 422 rooms
- 343 rooms
- 544 rooms
- 775 rooms
- 996 rooms
- 747 rooms
- 728 rooms
- 1029+ rooms
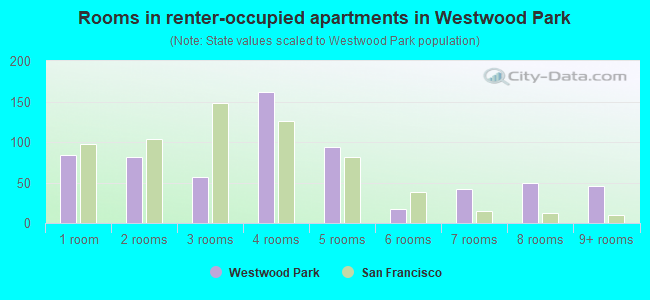
- Rooms in renter-occupied apartments in Westwood Park
- 841 room
- 822 rooms
- 573 rooms
- 1624 rooms
- 945 rooms
- 176 rooms
- 427 rooms
- 498 rooms
- 469+ rooms
Owner-occupied
Renter-occupied
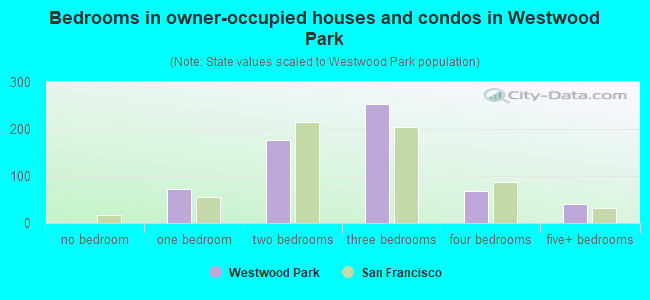
- Bedrooms in owner-occupied houses and condos in Westwood Park
- 0no bedroom
- 731 bedroom
- 1772 bedrooms
- 2533 bedrooms
- 684 bedrooms
- 405+ bedrooms
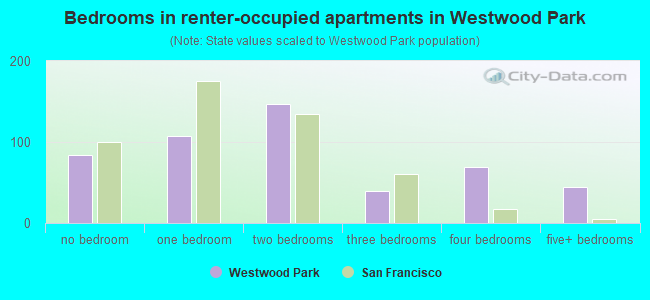
- Bedrooms in renter-occupied apartments in Westwood Park
- 84no bedroom
- 1081 bedroom
- 1472 bedrooms
- 393 bedrooms
- 694 bedrooms
- 455+ bedrooms
Average number of cars or other vehicles available in houses/condos:
Average number of cars or other vehicles available in apartments:
| This neighborhood: | 1.8 |
| San Francisco: | 1.5 |
Average number of cars or other vehicles available in apartments:
| Here: | 1.2 |
| city: | 0.8 |
Percentage of units with a mortgage:
| Westwood Park: | 63.6% |
| San Francisco: | 62.3% |
Housing prices:
- Average estimated value of detached houses in 2022 (56.1% of all units):
Westwood Park: $1,425,650 San Francisco: $1,942,973
- Average estimated value of townhouses or other attached units in 2022 (28.7% of all units):
This neighborhood: $1,128,395 city: $1,528,422
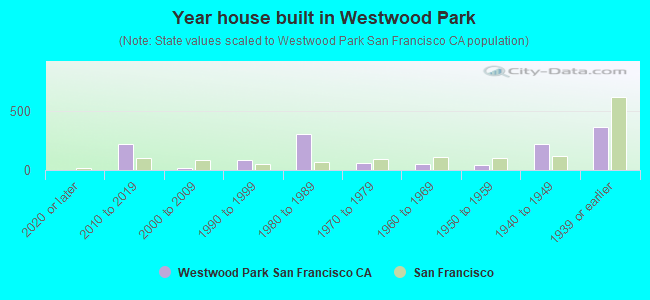
- Year house built in Westwood Park
- 02020 or later
- 2172010 to 2019
- 142000 to 2009
- 801990 to 1999
- 3031980 to 1989
- 581970 to 1979
- 471960 to 1969
- 451950 to 1959
- 2211940 to 1949
- 3631939 or earlier
City-data.com crime index for city in 2020 (higher means more crime):
| City: | 387.4 |
| U.S. average: | 219.5 |
Travel time to work (commute)
![Travel time to work (commute)]()
- 17Less than 5 minutes
- 235 to 9 minutes
- 4810 to 14 minutes
- 8315 to 19 minutes
- 12020 to 24 minutes
- 4225 to 29 minutes
- 18430 to 34 minutes
- 1935 to 39 minutes
- 4840 to 44 minutes
- 8545 to 59 minutes
- 12660 to 89 minutes
- 1690 or more minutes

Means of transportation to work
![Means of transportation to work]()
- 46.5%519Drove a car alone
- 2.2%24Carpooled
- 6.1%68Bus
- 10.6%118Subway or elevated rail
- 1.0%11Long-distance train or commuter rail
- 2.2%24Light rail, streetcar or trolley
- 5.5%61Taxi
- 5.6%63Motorcycle
- 3.6%40Bicycle
- 2.9%32Walked
- 2.5%28Other means
- 23.0%257Worked at home

Time leaving home to go to work
![Time leaving home to go to work]()
- 6912:00 a.m. to 4:59 a.m.
- 125:00 a.m. to 5:29 a.m.
- 65:30 a.m. to 5:59 a.m.
- 566:00 a.m. to 6:29 a.m.
- 496:30 a.m. to 6:59 a.m.
- 817:00 a.m. to 7:29 a.m.
- 1117:30 a.m. to 7:59 a.m.
- 1388:00 a.m. to 8:29 a.m.
- 948:30 a.m. to 8:59 a.m.
- 959:00 a.m. to 9:59 a.m.
- 2110:00 a.m. to 10:59 a.m.
- 311:00 a.m. to 11:59 a.m.
- 3712:00 p.m. to 3:59 p.m.
- 294:00 p.m. to 11:59 p.m.

Occupations of males:
- Percentage of males in management occupations (except farmers):
Here: 18.1% city: 17.2%
- Percentage of males in business and financial operations occupations:
Here: 12.3% city: 8.9%
- Percentage of males in computer and mathematical occupations:
Here: 5.6% city: 14.6%
- Percentage of males in life, physical, and social science occupations:
Here: 6.1% city: 2.4%
- Percentage of males in community and social services occupations:
Here: 1.0% city: 1.0%
- Percentage of males in arts, design, entertainment, sports, and media occupations:
Here: 4.1% city: 4.9%
- Percentage of males in healthcare practitioners and technical occupations:
Here: 6.1% city: 3.2%
- Percentage of males in service occupations:
Here: 4.6% city: 11.8%
- Percentage of males in sales and office occupations:
Here: 19.9% city: 13.5%
- Percentage of males in construction, extraction, and maintenance occupations:
Here: 2.0% city: 3.1%
- Percentage of males in production occupations:
Here: 3.7% city: 2.5%
- Percentage of males in transportation occupations:
Here: 1.3% city: 3.4%
Occupations of females:
- Percentage of females in management occupations (except farmers):
Here: 14.5% city: 15.8%
- Percentage of females in business and financial operations occupations:
Here: 7.8% city: 11.5%
- Percentage of females in computer and mathematical occupations:
Here: 14.9% city: 5.1%
- Percentage of females in life, physical, and social science occupations:
Here: 7.6% city: 2.9%
- Percentage of females in community and social services occupations:
Here: 4.6% city: 1.6%
- Percentage of females in education, training, and library occupations:
Here: 7.7% city: 7.1%
- Percentage of females in arts, design, entertainment, sports, and media occupations:
Here: 2.6% city: 5.1%
- Percentage of females in healthcare practitioners and technical occupations:
Here: 8.8% city: 8.4%
- Percentage of females in service occupations:
Here: 11.1% city: 15.4%
- Percentage of females in sales and office occupations:
Here: 19.6% city: 19.3%
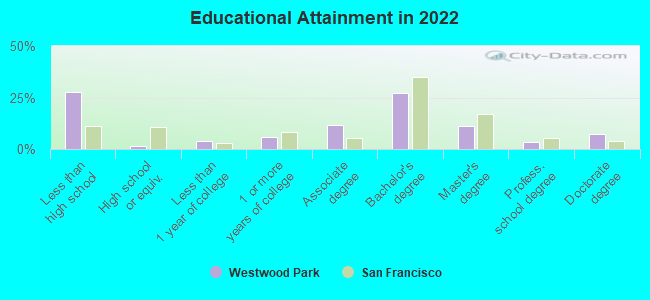
Education in this neighborhood (subdivision or community):
- Percentage of people 3 years and older in K-12 schools:
Westwood Park: 12.0% San Francisco: 9.7%
- Percentage of people 3 years and older in undergraduate colleges:
Westwood Park: 10.5% San Francisco: 4.8%
- Percentage of people 3 years and older in grad. or professional schools:
Westwood Park: 5.9% San Francisco: 2.6%
- Percentage of students K-12 enrolled in private schools:
Westwood Park: 69.7% San Francisco: 36.5%
Percentage of population below poverty level:
| Westwood Park: | 7.4% |
| San Francisco: | 10.4% |
Median year owner moved in (as recorded in 2022):
| Westwood Park: | 1999 |
| San Francisco: | 2007 |
Percentage of married-couple families with both working:
| Westwood Park: | 113.5% |
| San Francisco: | 75.9% |

- 64.9%Utility gas
- 21.2%Electricity
- 4.3%Fuel oil, kerosene, etc.
- 4.1%No fuel used
- 3.3%Wood
- 2.3%Bottled, tank, or LP gas
Roads and streets:
Miramar Ave
Length: 0.71 miles
Directions: N-S, SE-NW, SW-NE
Address range: 401 to 799
Directions: N-S, SE-NW, SW-NE
Address range: 401 to 799
Plymouth Ave
Length: 0.43 miles
Directions: E-W, N-S, SE-NW, SW-NE
Address range: 1278 to 1599
Directions: E-W, N-S, SE-NW, SW-NE
Address range: 1278 to 1599
Eastwood Dr
Length: 0.34 miles
Directions: E-W, N-S, SE-NW, SW-NE
Address range: 1 to 199
Directions: E-W, N-S, SE-NW, SW-NE
Address range: 1 to 199
Westwood Dr
Length: 0.34 miles
Directions: E-W, N-S, SE-NW, SW-NE
Address range: 1 to 199
Directions: E-W, N-S, SE-NW, SW-NE
Address range: 1 to 199
Northwood Dr
Length: 0.26 miles
Directions: E-W, SE-NW, SW-NE
Address range: 1 to 299
Directions: E-W, SE-NW, SW-NE
Address range: 1 to 299
Southwood Dr
Length: 0.25 miles
Directions: E-W, SE-NW, SW-NE
Address range: 1 to 179
Directions: E-W, SE-NW, SW-NE
Address range: 1 to 179
Montecito Ave
Length: 0.24 miles
Directions: E-W, SW-NE
Address range: 100 to 499
Directions: E-W, SW-NE
Address range: 100 to 499
Wildwood Way
Length: 0.21 miles
Direction: E-W
Address range: 1 to 399
Direction: E-W
Address range: 1 to 399
Greenwood Ave
Length: 0.17 miles
Direction: E-W
Address range: 1 to 199
Direction: E-W
Address range: 1 to 199
Hazelwood Ave
Length: 0.14 miles
Direction: N-S
Address range: 1 to 99
Direction: N-S
Address range: 1 to 99
Judson Ave
Length: 0.11 miles
Direction: E-W
Address range: 500 to 599
Direction: E-W
Address range: 500 to 599
Colon Ave
Length: 0.10 miles
Direction: N-S
Address range: 1 to 199
Direction: N-S
Address range: 1 to 199
San Ramon Way
Length: 0.09 miles
Directions: E-W, SE-NW
Address range: 100 to 1349
Directions: E-W, SE-NW
Address range: 100 to 1349
Valdez Ave
Length: 0.09 miles
Direction: N-S
Address range: 1 to 99
Direction: N-S
Address range: 1 to 99
Faxon Ave
Length: 0.06 miles
Directions: E-W, N-S, SE-NW, SW-NE
Address range: 665 to 699
Directions: E-W, N-S, SE-NW, SW-NE
Address range: 665 to 699
Ridgewood Ave
Length: 0.06 miles
Direction: N-S
Address range: 1 to 99
Direction: N-S
Address range: 1 to 99
Elmwood Way
Length: 0.06 miles
Direction: SW-NE
Address range: 1 to 99
Direction: SW-NE
Address range: 1 to 99
Pizarro Way
Length: 0.05 miles
Direction: SE-NW
Address range: 1 to 49
Direction: SE-NW
Address range: 1 to 49
Flood Ave
Length: 0.05 miles
Direction: E-W
Address range: 585 to 599
Direction: E-W
Address range: 585 to 599