Lower Nob Hill neighborhood in San Francisco, California (CA), 94102, 94108, 94109 detailed profile
Settings
X

Business Search - 14 Million verified businesses
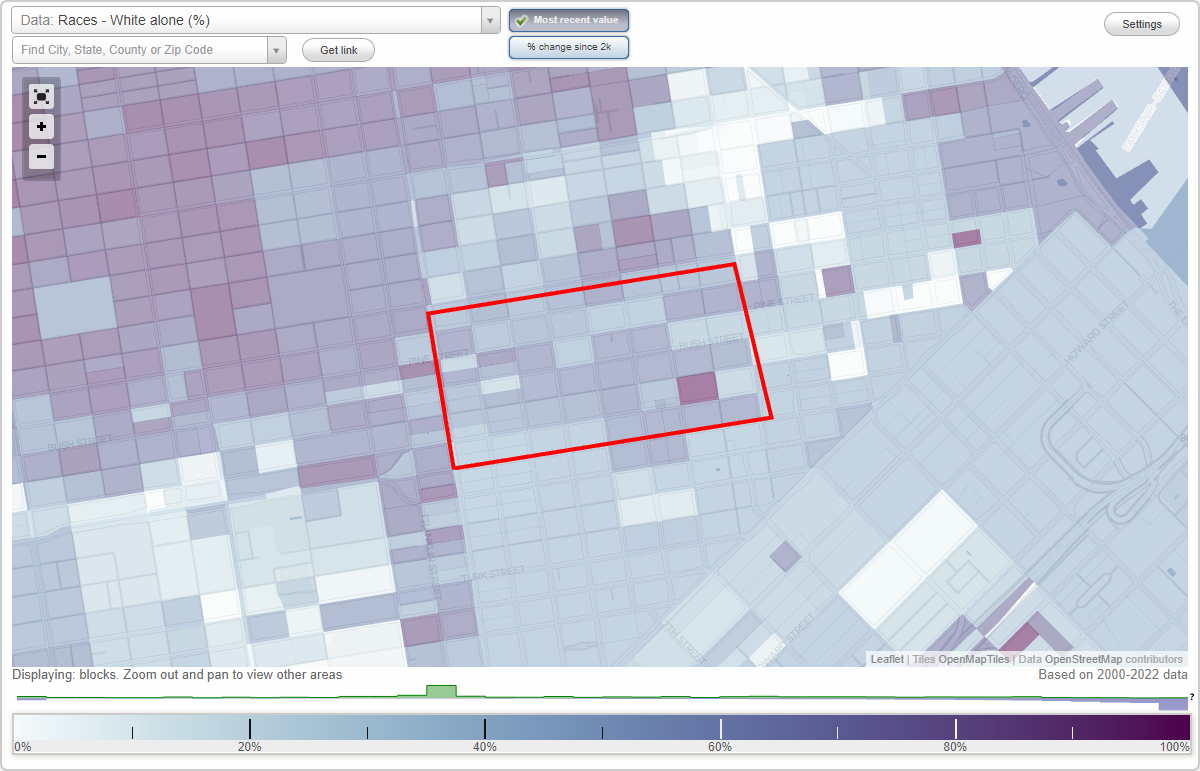
Area: 0.273 square miles
Population: 10,729
Population density:
| Lower Nob Hill: | 39,333 people per square mile |
| San Francisco: | 17,313 people per square mile |

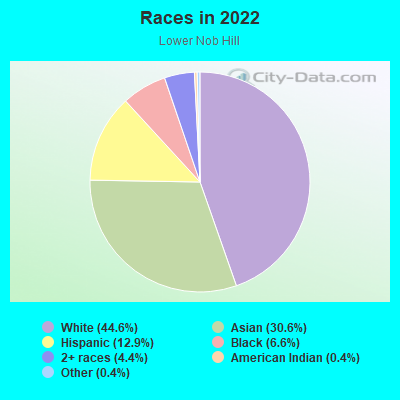
- 4,84744.6%White
- 3,32330.6%Asian
- 1,40412.9%Hispanic or Latino
- 7206.6%Black
- 4744.4%Two or more races
- 480.4%American Indian
- 480.4%Some other race
Distribution of median household income
![Distribution of median household income]()
- 814Less than $10,000
- 288$10,000 to $19,999
- 962$20,000 to $29,999
- 529$30,000 to $39,999
- 538$40,000 to $49,999
- 621$50,000 to $59,999
- 543$60,000 to $74,999
- 838$75,000 to $99,999
- 211$100,000 to $124,999
- 149$125,000 to $149,999
- 907$150,000 to $199,999
- 2,118$200,000 or more

Distribution of owner-occupied house/condo value
![Distribution of owner-occupied house/condo value]()
- 18Less than $50,000
- 241$300,000 to $399,999
- 591$500,000 to $749,999
- 406$750,000 to $999,999
- 1,201$1,000,000 or more

Distribution of rent paid by renters
![Distribution of rent paid by renters]()
- 273$200 to $299
- 36$300 to $399
- 161$400 to $499
- 122$500 to $599
- 157$600 to $699
- 90$700 to $799
- 528$800 to $899
- 163$900 to $999
- 1,127$1,000 to $1,249
- 676$1,250 to $1,499
- 1,341$1,500 to $1,999
- 3,405$2,000 or more

Median rent in 2022:
| Lower Nob Hill: | $1,703 |
| San Francisco: | $2,001 |
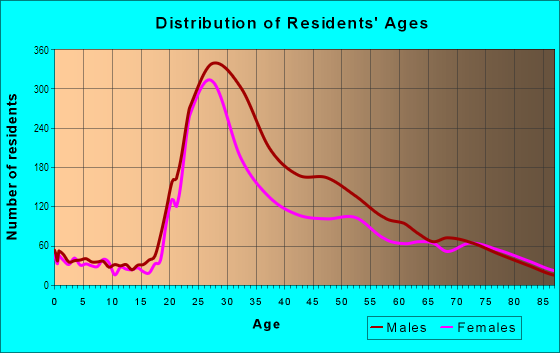
| Males: | 5,876 |
| Females: | 4,852 |
Males:
| This neighborhood: | 39.3 years |
| Whole city: | 40.3 years |
| This neighborhood: | 38.3 years |
| Whole city: | 40.5 years |
Average household size:
| Lower Nob Hill: | 1.8 people |
| San Francisco: | 2.2 people |
Percentage of family households:
| Lower Nob Hill: | 8.7% |
| San Francisco: | 30.3% |
| Here: | 11.9% |
| San Francisco: | 35.3% |
Percentage of married-couple families with children (among all households):
| Lower Nob Hill: | 60.8% |
| San Francisco: | 35.9% |
Percentage of single-mother households (among all households):
| Lower Nob Hill: | 9.8% |
| San Francisco: | 6.0% |
Percentage of never married males 15 years old and over:
Percentage of never married females 15 years old and over:
| Lower Nob Hill: | 41.1% |
| San Francisco: | 24.6% |
Percentage of never married females 15 years old and over:
| Lower Nob Hill: | 30.8% |
| city: | 19.9% |
Percentage of people that speak English not well or not at all:
| Lower Nob Hill: | 2.7% |
| San Francisco: | 10.9% |
Percentage of people born in this state:
Percentage of people born in another U.S. state:
Percentage of native residents but born outside the U.S.:
Percentage of foreign born residents:
| Here: | 34.9% |
| San Francisco: | 40.8% |
Percentage of people born in another U.S. state:
| Lower Nob Hill: | 34.8% |
| San Francisco: | 23.4% |
Percentage of native residents but born outside the U.S.:
| Here: | 7.2% |
| city: | 2.6% |
Percentage of foreign born residents:
| Here: | 23.0% |
| San Francisco: | 33.2% |
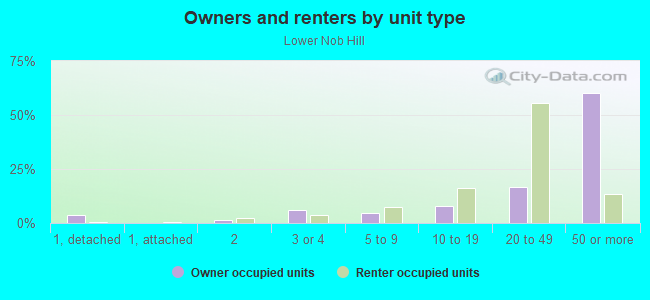
Owner-occupied
Renter-occupied

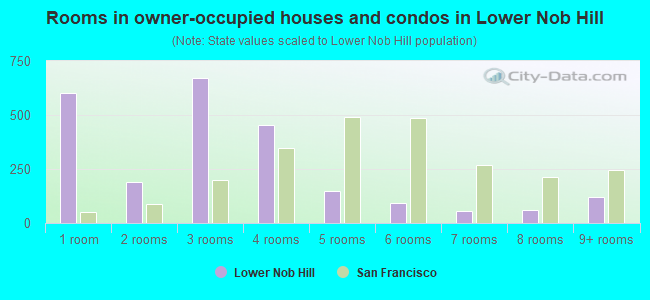
- Rooms in owner-occupied houses and condos in Lower Nob Hill
- 6021 room
- 1922 rooms
- 6693 rooms
- 4524 rooms
- 1465 rooms
- 926 rooms
- 567 rooms
- 588 rooms
- 1209+ rooms
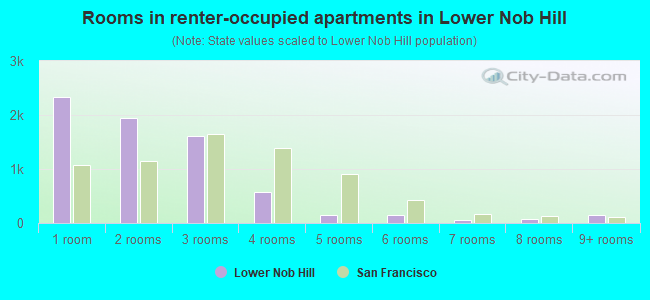
- Rooms in renter-occupied apartments in Lower Nob Hill
- 2,3291 room
- 1,9372 rooms
- 1,6133 rooms
- 5704 rooms
- 1535 rooms
- 1536 rooms
- 507 rooms
- 728 rooms
- 1459+ rooms
Owner-occupied
Renter-occupied
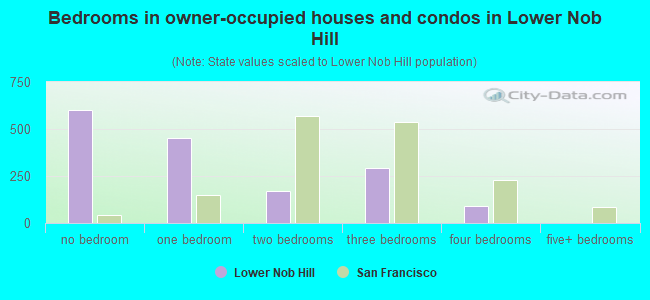
- Bedrooms in owner-occupied houses and condos in Lower Nob Hill
- 602no bedroom
- 4521 bedroom
- 1712 bedrooms
- 2943 bedrooms
- 904 bedrooms
- 05+ bedrooms
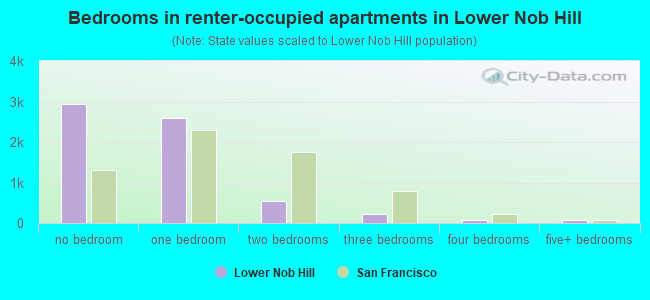
- Bedrooms in renter-occupied apartments in Lower Nob Hill
- 2,938no bedroom
- 2,5831 bedroom
- 5532 bedrooms
- 2113 bedrooms
- 724 bedrooms
- 645+ bedrooms
Average number of cars or other vehicles available in houses/condos:
Average number of cars or other vehicles available in apartments:
| This neighborhood: | |
| San Francisco: |
Average number of cars or other vehicles available in apartments:
| Here: | 0.1 |
| city: | 0.8 |
Percentage of units with a mortgage:
| Lower Nob Hill: | 72.3% |
| San Francisco: | 62.3% |
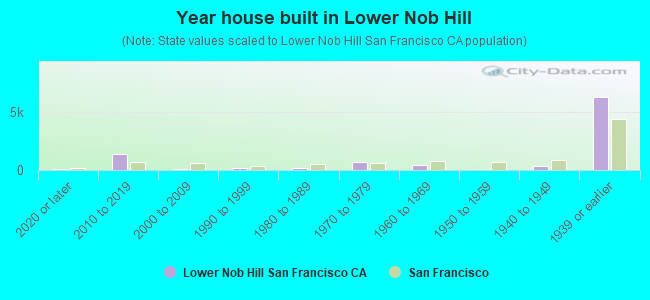
- Year house built in Lower Nob Hill
- 802020 or later
- 1,3492010 to 2019
- 1012000 to 2009
- 1941990 to 1999
- 1401980 to 1989
- 7211970 to 1979
- 4491960 to 1969
- 411950 to 1959
- 3621940 to 1949
- 6,2311939 or earlier
City-data.com crime index for city in 2020 (higher means more crime):
| City: | 387.4 |
| U.S. average: | 219.5 |
Travel time to work (commute)
![Travel time to work (commute)]()
- 71Less than 5 minutes
- 3515 to 9 minutes
- 76010 to 14 minutes
- 3,12115 to 19 minutes
- 1,68620 to 24 minutes
- 46225 to 29 minutes
- 1,38030 to 34 minutes
- 15435 to 39 minutes
- 7140 to 44 minutes
- 38045 to 59 minutes
- 68660 to 89 minutes
- 22990 or more minutes

Means of transportation to work
![Means of transportation to work]()
- 14.1%1,039Drove a car alone
- 5.4%399Carpooled
- 18.0%1,330Bus
- 3.2%240Subway or elevated rail
- 1.4%107Long-distance train or commuter rail
- 13.1%966Light rail, streetcar or trolley
- 2.2%162Ferryboat
- 1.3%99Taxi
- 0.4%27Motorcycle
- 2.6%192Bicycle
- 42.5%3,142Walked
- 4.3%316Other means
- 11.0%814Worked at home

Time leaving home to go to work
![Time leaving home to go to work]()
- 9912:00 a.m. to 4:59 a.m.
- 575:00 a.m. to 5:29 a.m.
- 885:30 a.m. to 5:59 a.m.
- 1,0146:00 a.m. to 6:29 a.m.
- 5206:30 a.m. to 6:59 a.m.
- 9077:00 a.m. to 7:29 a.m.
- 8167:30 a.m. to 7:59 a.m.
- 1,2258:00 a.m. to 8:29 a.m.
- 1,4358:30 a.m. to 8:59 a.m.
- 7679:00 a.m. to 9:59 a.m.
- 65610:00 a.m. to 10:59 a.m.
- 33611:00 a.m. to 11:59 a.m.
- 90512:00 p.m. to 3:59 p.m.
- 6414:00 p.m. to 11:59 p.m.

Occupations of males:
- Percentage of males in management occupations (except farmers):
Here: 23.1% city: 17.2%
- Percentage of males in business and financial operations occupations:
Here: 17.1% city: 8.9%
- Percentage of males in computer and mathematical occupations:
Here: 13.0% city: 14.6%
- Percentage of males in architecture and engineering occupations:
Here: 2.0% city: 4.0%
- Percentage of males in life, physical, and social science occupations:
Here: 1.5% city: 2.4%
- Percentage of males in legal occupations:
Here: 4.0% city: 2.5%
- Percentage of males in education, training, and library occupations:
Here: 6.6% city: 3.4%
- Percentage of males in arts, design, entertainment, sports, and media occupations:
Here: 4.2% city: 4.9%
- Percentage of males in healthcare practitioners and technical occupations:
Here: 2.7% city: 3.2%
- Percentage of males in service occupations:
Here: 8.1% city: 11.8%
- Percentage of males in sales and office occupations:
Here: 12.5% city: 13.5%
- Percentage of males in production occupations:
Here: 2.2% city: 2.5%
- Percentage of males in transportation occupations:
Here: 1.7% city: 3.4%
- Percentage of males in material moving occupations:
Here: 1.7% city: 1.8%
Occupations of females:
- Percentage of females in management occupations (except farmers):
Here: 13.5% city: 15.8%
- Percentage of females in business and financial operations occupations:
Here: 13.8% city: 11.5%
- Percentage of females in computer and mathematical occupations:
Here: 5.3% city: 5.1%
- Percentage of females in community and social services occupations:
Here: 18.2% city: 1.6%
- Percentage of females in legal occupations:
Here: 9.4% city: 3.0%
- Percentage of females in education, training, and library occupations:
Here: 1.4% city: 7.1%
- Percentage of females in arts, design, entertainment, sports, and media occupations:
Here: 8.0% city: 5.1%
- Percentage of females in healthcare practitioners and technical occupations:
Here: 6.8% city: 8.4%
- Percentage of females in service occupations:
Here: 4.1% city: 15.4%
- Percentage of females in sales and office occupations:
Here: 19.4% city: 19.3%
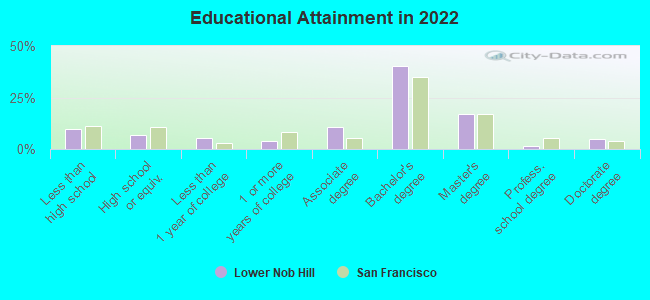
Education in this neighborhood (subdivision or community):
- Percentage of people 3 years and older in K-12 schools:
Lower Nob Hill: 16.7% San Francisco: 9.7%
- Percentage of people 3 years and older in undergraduate colleges:
Lower Nob Hill: 19.4% San Francisco: 4.8%
- Percentage of people 3 years and older in grad. or professional schools:
Lower Nob Hill: 6.9% San Francisco: 2.6%
- Percentage of students K-12 enrolled in private schools:
Lower Nob Hill: 50.3% San Francisco: 36.5%
Percentage of population below poverty level:
| Lower Nob Hill: | 10.9% |
| San Francisco: | 10.4% |
Median year renter moved in (as recorded in 2022):
| Lower Nob Hill: | 2013 |
| San Francisco: | 2019 |
Percentage of married-couple families with both working:
| Lower Nob Hill: | 127.1% |
| San Francisco: | 75.9% |
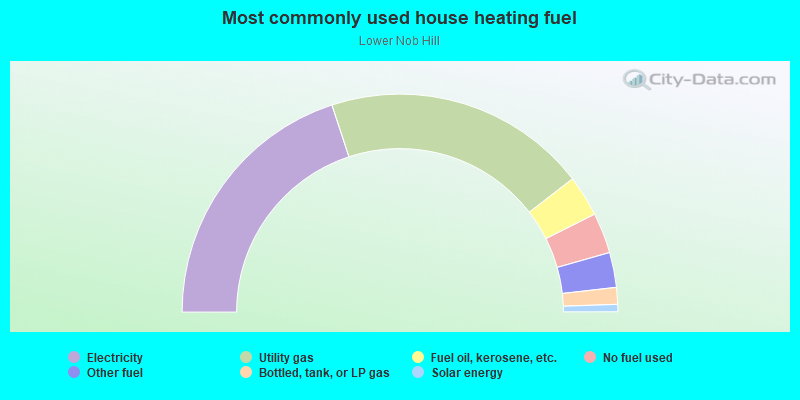
- 39.9%Electricity
- 39.2%Utility gas
- 6.1%Fuel oil, kerosene, etc.
- 6.0%No fuel used
- 5.2%Other fuel
- 2.5%Bottled, tank, or LP gas
- 1.1%Solar energy
Roads and streets:
Post St
Length: 0.80 miles
Direction: E-W
Address range: 400 to 1098
Direction: E-W
Address range: 400 to 1098
Sutter St
Length: 0.80 miles
Direction: E-W
Address range: 500 to 1199
Direction: E-W
Address range: 500 to 1199
Bush St
Length: 0.80 miles
Direction: E-W
Address range: 700 to 1399
Direction: E-W
Address range: 700 to 1399
Pine St
Length: 0.80 miles
Direction: E-W
Address range: 800 to 1499
Direction: E-W
Address range: 800 to 1499
California St
Length: 0.80 miles
Direction: E-W
Address range: 900 to 1599
Direction: E-W
Address range: 900 to 1599
Powell St
Length: 0.36 miles
Direction: N-S
Address range: 300 to 841
Direction: N-S
Address range: 300 to 841
Mason St
Length: 0.33 miles
Direction: N-S
Address range: 400 to 899
Direction: N-S
Address range: 400 to 899
Taylor St
Length: 0.31 miles
Direction: N-S
Address range: 517 to 999
Direction: N-S
Address range: 517 to 999
Larkin St
Length: 0.30 miles
Direction: N-S
Address range: 927 to 1399
Direction: N-S
Address range: 927 to 1399
Polk St
Length: 0.30 miles
Direction: N-S
Address range: 1026 to 1499
Direction: N-S
Address range: 1026 to 1499
Leavenworth St
Length: 0.29 miles
Direction: N-S
Address range: 700 to 1122
Direction: N-S
Address range: 700 to 1122
Jones St
Length: 0.28 miles
Direction: N-S
Address range: 635 to 1099
Direction: N-S
Address range: 635 to 1099
Hyde St
Length: 0.26 miles
Direction: N-S
Address range: 700 to 1099
Direction: N-S
Address range: 700 to 1099
Hemlock St
Length: 0.22 miles
Direction: E-W
Address range: 2 to 199
Direction: E-W
Address range: 2 to 199
Cedar St
Length: 0.22 miles
Direction: E-W
Address range: 1 to 199
Direction: E-W
Address range: 1 to 199
Fern St
Length: 0.22 miles
Direction: E-W
Address range: 1 to 199
Direction: E-W
Address range: 1 to 199
Frank Norris St (Austin St)
Length: 0.22 miles
Direction: E-W
Address range: 1 to 199
Direction: E-W
Address range: 1 to 199
Cosmo Pl
Length: 0.12 miles
Direction: E-W
Address range: 1 to 99
Direction: E-W
Address range: 1 to 99
Geary St
Length: 0.11 miles
Direction: E-W
Address range: 300 to 399
Direction: E-W
Address range: 300 to 399
Derby St
Length: 0.08 miles
Direction: E-W
Address range: 1 to 104
Direction: E-W
Address range: 1 to 104
Nob Hill Cir
Length: 0.04 miles
Direction: SW-NE
Address range: 1 to 99
Direction: SW-NE
Address range: 1 to 99
Isadora Duncan Ln
Length: 0.04 miles
Direction: E-W
Address range: 1 to 99
Direction: E-W
Address range: 1 to 99
Helen Pl (Helen St)
Length: 0.03 miles
Direction: N-S
Address range: 1 to 99
Direction: N-S
Address range: 1 to 99
Acorn Aly
Length: 0.03 miles
Direction: E-W
Address range: 1 to 99
Direction: E-W
Address range: 1 to 99
Vine Ter
Length: 0.03 miles
Direction: N-S
Address range: 1 to 99
Direction: N-S
Address range: 1 to 99
Meacham Pl
Length: 0.03 miles
Direction: N-S
Address range: 1 to 99
Direction: N-S
Address range: 1 to 99
Nob Hill Pl
Length: 0.03 miles
Direction: E-W
Address range: 1 to 99
Direction: E-W
Address range: 1 to 99
Hobart Aly
Length: 0.03 miles
Direction: E-W
Address range: 1 to 99
Direction: E-W
Address range: 1 to 99
Colin Pl
Length: 0.03 miles
Direction: E-W
Address range: 1 to 99
Direction: E-W
Address range: 1 to 99
Touchard St
Length: 0.02 miles
Direction: N-S
Address range: 1 to 99
Direction: N-S
Address range: 1 to 99
Trader Vic Aly
Length: 0.02 miles
Direction: N-S
Address range: 1 to 99
Direction: N-S
Address range: 1 to 99
Ophir Aly
Length: 0.02 miles
Direction: N-S
Address range: 1 to 99
Direction: N-S
Address range: 1 to 99
Shannon St
Length: 0.02 miles
Direction: N-S
Address range: 164 to 199
Direction: N-S
Address range: 164 to 199