Zion District neighborhood in San Francisco, California (CA), 94115 detailed profile
Settings
X

Business Search - 14 Million verified businesses
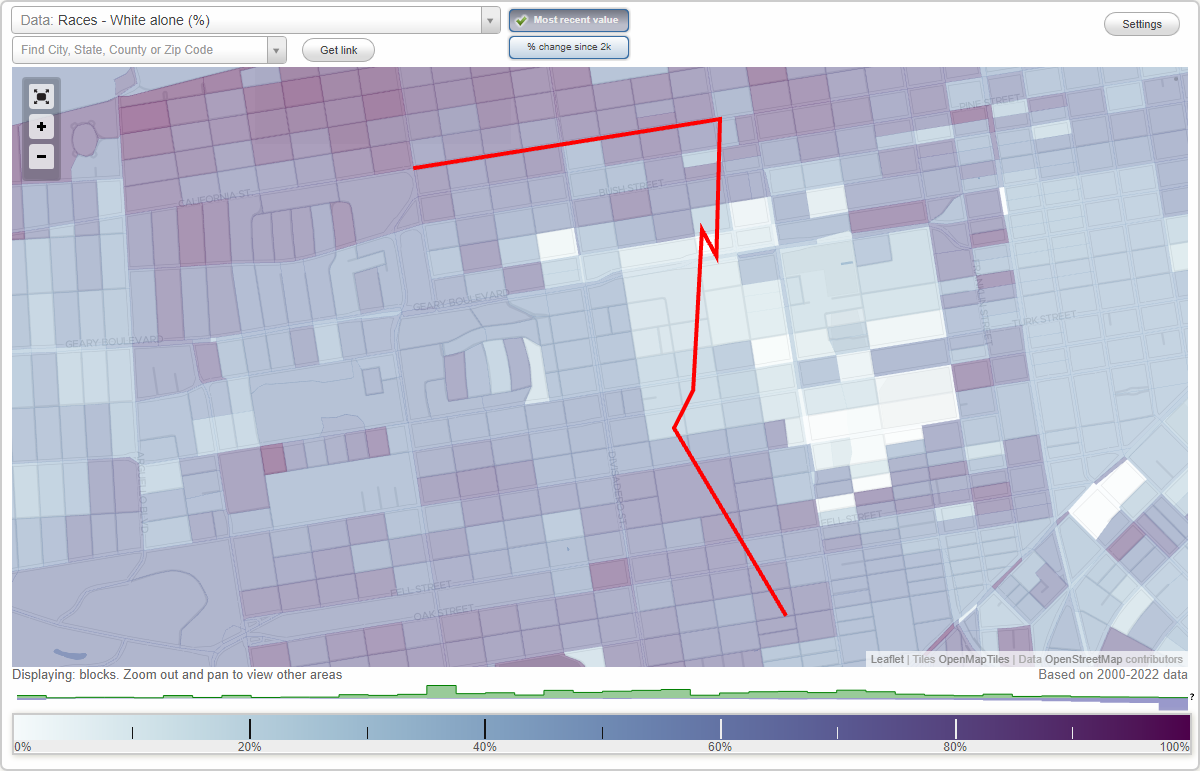
Area: 0.240 square miles
Population: 5,627
Population density:
| Zion District: | 23,450 people per square mile |
| San Francisco: | 17,313 people per square mile |

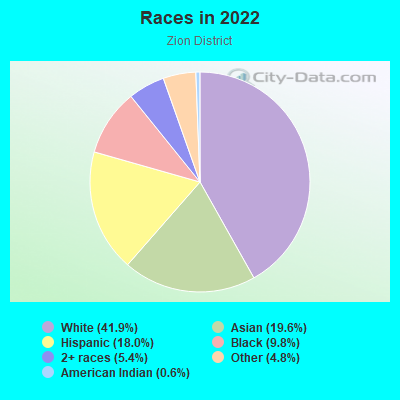
- 2,54541.9%White
- 1,19119.6%Asian
- 1,09618.0%Hispanic or Latino
- 5959.8%Black
- 3265.4%Two or more races
- 2944.8%Some other race
- 340.6%American Indian
Distribution of median household income
![Distribution of median household income]()
- 211Less than $10,000
- 514$10,000 to $19,999
- 870$20,000 to $29,999
- 273$30,000 to $39,999
- 174$40,000 to $49,999
- 53$50,000 to $59,999
- 121$60,000 to $74,999
- 236$75,000 to $99,999
- 217$100,000 to $124,999
- 105$125,000 to $149,999
- 235$150,000 to $199,999
- 915$200,000 or more

Distribution of owner-occupied house/condo value
![Distribution of owner-occupied house/condo value]()
- 228Less than $50,000
- 115$50,000 to $99,999
- 92$200,000 to $249,999
- 90$250,000 to $299,999
- 169$300,000 to $399,999
- 26$400,000 to $499,999
- 50$500,000 to $749,999
- 81$750,000 to $999,999
- 708$1,000,000 or more

Distribution of rent paid by renters
![Distribution of rent paid by renters]()
- 710$100 to $199
- 787$200 to $299
- 1,293$300 to $399
- 147$400 to $499
- 330$500 to $599
- 50$600 to $699
- 99$700 to $799
- 260$800 to $899
- 50$900 to $999
- 107$1,000 to $1,249
- 93$1,250 to $1,499
- 372$1,500 to $1,999
- 1,151$2,000 or more

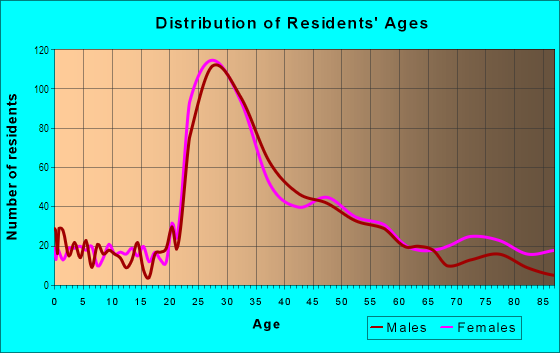
| Males: | 3,113 |
| Females: | 2,514 |
Males:
| This neighborhood: | 39.9 years |
| Whole city: | 40.3 years |
| This neighborhood: | 47.5 years |
| Whole city: | 40.5 years |
Average household size:
| Zion District: | 5.1 people |
| San Francisco: | 2.2 people |
Percentage of family households:
| Zion District: | 17.8% |
| San Francisco: | 30.3% |
| Here: | 17.2% |
| San Francisco: | 35.3% |
Percentage of married-couple families with children (among all households):
| Zion District: | 33.7% |
| San Francisco: | 35.9% |
Percentage of single-mother households (among all households):
| Zion District: | 27.8% |
| San Francisco: | 6.0% |
Percentage of never married males 15 years old and over:
Percentage of never married females 15 years old and over:
| Zion District: | 34.7% |
| San Francisco: | 24.6% |
Percentage of never married females 15 years old and over:
| Zion District: | 24.1% |
| city: | 19.9% |
Percentage of people that speak English not well or not at all:
| Zion District: | 10.7% |
| San Francisco: | 10.9% |
Percentage of people born in this state:
Percentage of people born in another U.S. state:
Percentage of native residents but born outside the U.S.:
Percentage of foreign born residents:
| Here: | 32.2% |
| San Francisco: | 40.8% |
Percentage of people born in another U.S. state:
| Zion District: | 36.9% |
| San Francisco: | 23.4% |
Percentage of native residents but born outside the U.S.:
| Here: | 3.8% |
| city: | 2.6% |
Percentage of foreign born residents:
| Here: | 27.0% |
| San Francisco: | 33.2% |
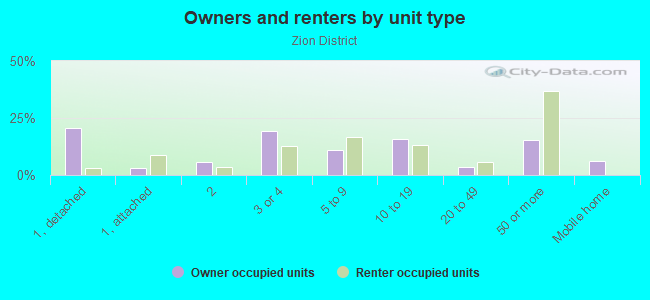
Owner-occupied
Renter-occupied

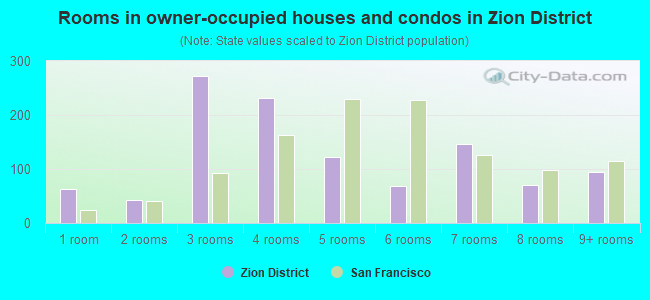
- Rooms in owner-occupied houses and condos in Zion District
- 631 room
- 432 rooms
- 2733 rooms
- 2324 rooms
- 1235 rooms
- 686 rooms
- 1477 rooms
- 718 rooms
- 959+ rooms
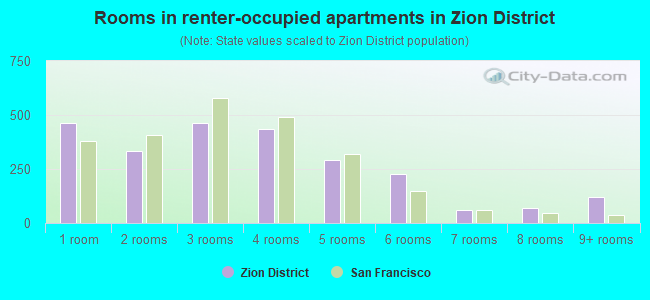
- Rooms in renter-occupied apartments in Zion District
- 4631 room
- 3352 rooms
- 4623 rooms
- 4344 rooms
- 2925 rooms
- 2286 rooms
- 607 rooms
- 688 rooms
- 1209+ rooms
Owner-occupied
Renter-occupied
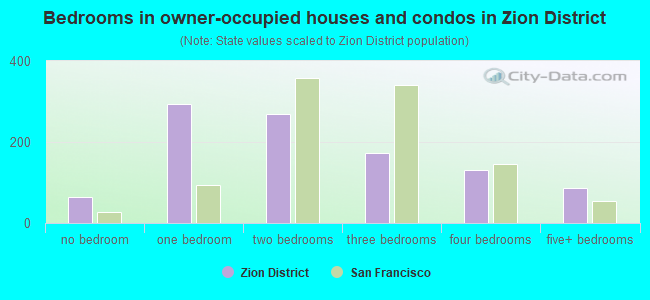
- Bedrooms in owner-occupied houses and condos in Zion District
- 63no bedroom
- 2941 bedroom
- 2692 bedrooms
- 1733 bedrooms
- 1304 bedrooms
- 875+ bedrooms
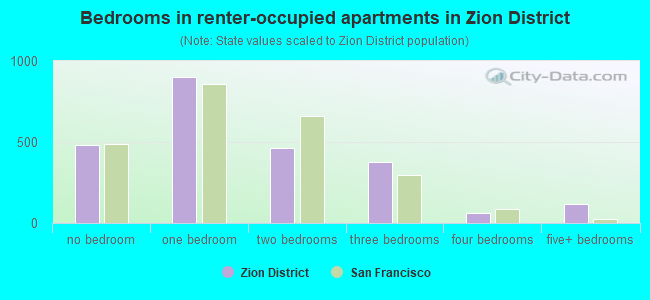
- Bedrooms in renter-occupied apartments in Zion District
- 484no bedroom
- 9021 bedroom
- 4622 bedrooms
- 3773 bedrooms
- 614 bedrooms
- 1205+ bedrooms
Average number of cars or other vehicles available in houses/condos:
Average number of cars or other vehicles available in apartments:
| This neighborhood: | 1.4 |
| San Francisco: | 1.5 |
Average number of cars or other vehicles available in apartments:
| Here: | 0.7 |
| city: | 0.8 |
Percentage of units with a mortgage:
| Zion District: | 74.9% |
| San Francisco: | 62.3% |
Housing prices:
- Average estimated value of detached houses in 2022 (9.7% of all units):
Zion District: $6,467,664 San Francisco: $1,942,973
- Average estimated value of townhouses or other attached units in 2022 (5.0% of all units):
This neighborhood: $4,623,219 city: $1,528,422
- Average estimated value of housing units in 2-unit structures in 2022 (4.3% of all units):
This neighborhood: $4,003,017 San Francisco: $1,536,932
- Average estimated '22 value of housing units in 3-to-4-unit structures (20.1% of all units):
Zion District: $1,417,290 city: $1,622,965
- Average estimated '22 value of housing units in 5-or-more-unit structures (39.0% of all units):
Zion District: $1,736,194 San Francisco: $1,155,972
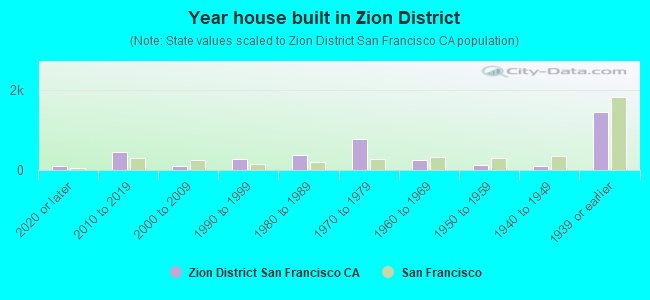
- Year house built in Zion District
- 952020 or later
- 4432010 to 2019
- 892000 to 2009
- 2801990 to 1999
- 3831980 to 1989
- 7651970 to 1979
- 2601960 to 1969
- 1301950 to 1959
- 1101940 to 1949
- 1,4501939 or earlier
City-data.com crime index for city in 2020 (higher means more crime):
| City: | 387.4 |
| U.S. average: | 219.5 |
Travel time to work (commute)
![Travel time to work (commute)]()
- 208Less than 5 minutes
- 1655 to 9 minutes
- 10110 to 14 minutes
- 12715 to 19 minutes
- 29120 to 24 minutes
- 22325 to 29 minutes
- 52130 to 34 minutes
- 4135 to 39 minutes
- 15240 to 44 minutes
- 29645 to 59 minutes
- 23160 to 89 minutes
- 10290 or more minutes

Means of transportation to work
![Means of transportation to work]()
- 16.3%514Drove a car alone
- 4.7%149Carpooled
- 21.5%679Bus
- 13.9%439Subway or elevated rail
- 5.7%180Long-distance train or commuter rail
- 1.1%34Light rail, streetcar or trolley
- 2.5%80Taxi
- 2.2%68Bicycle
- 12.6%399Walked
- 13.8%436Other means
- 32.6%1,029Worked at home

Time leaving home to go to work
![Time leaving home to go to work]()
- 4612:00 a.m. to 4:59 a.m.
- 75:00 a.m. to 5:29 a.m.
- 215:30 a.m. to 5:59 a.m.
- 1506:00 a.m. to 6:29 a.m.
- 1156:30 a.m. to 6:59 a.m.
- 3647:00 a.m. to 7:29 a.m.
- 3267:30 a.m. to 7:59 a.m.
- 6748:00 a.m. to 8:29 a.m.
- 3308:30 a.m. to 8:59 a.m.
- 1749:00 a.m. to 9:59 a.m.
- 9610:00 a.m. to 10:59 a.m.
- 1811:00 a.m. to 11:59 a.m.
- 10612:00 p.m. to 3:59 p.m.
- 624:00 p.m. to 11:59 p.m.

Occupations of males:
- Percentage of males in management occupations (except farmers):
Here: 21.3% city: 17.2%
- Percentage of males in business and financial operations occupations:
Here: 20.6% city: 8.9%
- Percentage of males in computer and mathematical occupations:
Here: 12.2% city: 14.6%
- Percentage of males in architecture and engineering occupations:
Here: 3.8% city: 4.0%
- Percentage of males in life, physical, and social science occupations:
Here: 1.2% city: 2.4%
- Percentage of males in community and social services occupations:
Here: 1.9% city: 1.0%
- Percentage of males in legal occupations:
Here: 1.1% city: 2.5%
- Percentage of males in education, training, and library occupations:
Here: 1.5% city: 3.4%
- Percentage of males in arts, design, entertainment, sports, and media occupations:
Here: 11.8% city: 4.9%
- Percentage of males in healthcare practitioners and technical occupations:
Here: 1.0% city: 3.2%
- Percentage of males in service occupations:
Here: 3.8% city: 11.8%
- Percentage of males in sales and office occupations:
Here: 14.0% city: 13.5%
- Percentage of males in construction, extraction, and maintenance occupations:
Here: 3.2% city: 3.1%
- Percentage of males in production occupations:
Here: 1.5% city: 2.5%
Occupations of females:
- Percentage of females in management occupations (except farmers):
Here: 21.6% city: 15.8%
- Percentage of females in business and financial operations occupations:
Here: 28.5% city: 11.5%
- Percentage of females in computer and mathematical occupations:
Here: 6.4% city: 5.1%
- Percentage of females in architecture and engineering occupations:
Here: 2.1% city: 1.6%
- Percentage of females in life, physical, and social science occupations:
Here: 4.2% city: 2.9%
- Percentage of females in legal occupations:
Here: 2.6% city: 3.0%
- Percentage of females in education, training, and library occupations:
Here: 2.5% city: 7.1%
- Percentage of females in arts, design, entertainment, sports, and media occupations:
Here: 2.9% city: 5.1%
- Percentage of females in healthcare practitioners and technical occupations:
Here: 4.8% city: 8.4%
- Percentage of females in service occupations:
Here: 1.9% city: 15.4%
- Percentage of females in sales and office occupations:
Here: 22.4% city: 19.3%
Percentage of people 16-64 in Armed Forces:
| Zion District: | 0.0% |
| San Francisco: | 0.1% |
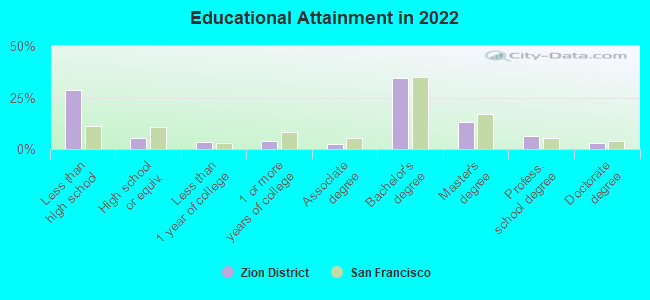
Education in this neighborhood (subdivision or community):
- Percentage of people 3 years and older in K-12 schools:
Zion District: 14.5% San Francisco: 9.7%
- Percentage of people 3 years and older in undergraduate colleges:
Zion District: 4.8% San Francisco: 4.8%
- Percentage of people 3 years and older in grad. or professional schools:
Zion District: 8.4% San Francisco: 2.6%
- Percentage of students K-12 enrolled in private schools:
Zion District: 66.1% San Francisco: 36.5%
Percentage of population below poverty level:
| Zion District: | 13.3% |
| San Francisco: | 10.4% |
Percentage of married-couple families with both working:
| Zion District: | 118.4% |
| San Francisco: | 75.9% |
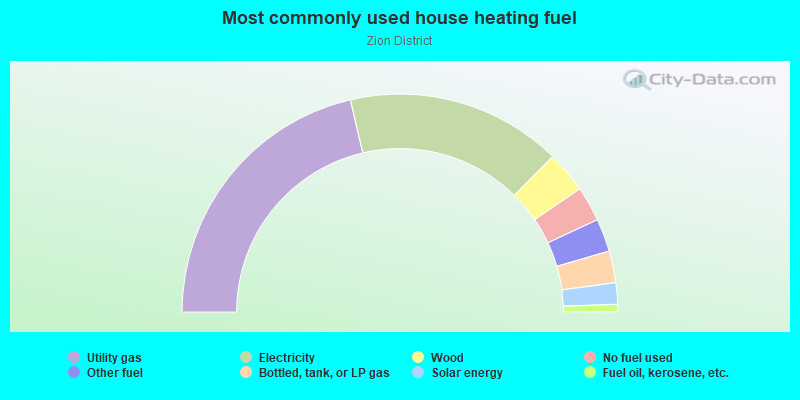
- 42.7%Utility gas
- 32.0%Electricity
- 6.2%Wood
- 5.2%No fuel used
- 4.9%Other fuel
- 4.7%Bottled, tank, or LP gas
- 3.2%Solar energy
- 1.1%Fuel oil, kerosene, etc.
Roads and streets:
Geary Blvd
Length: 1.42 miles
Directions: E-W, SE-NW, SW-NE
Address range: 1801 to 2399
Directions: E-W, SE-NW, SW-NE
Address range: 1801 to 2399
Pine St
Length: 0.80 miles
Direction: E-W
Address range: 2300 to 2999
Direction: E-W
Address range: 2300 to 2999
Bush St
Length: 0.80 miles
Direction: E-W
Address range: 2200 to 2899
Direction: E-W
Address range: 2200 to 2899
Post St
Length: 0.80 miles
Direction: E-W
Address range: 1900 to 2599
Direction: E-W
Address range: 1900 to 2599
Sutter St
Length: 0.80 miles
Direction: E-W
Address range: 2000 to 2699
Direction: E-W
Address range: 2000 to 2699
Divisadero St
Length: 0.55 miles
Directions: N-S, SE-NW
Address range: 1501 to 1899
Directions: N-S, SE-NW
Address range: 1501 to 1899
Broderick St
Length: 0.27 miles
Direction: N-S
Address range: 1400 to 1799
Direction: N-S
Address range: 1400 to 1799
Baker St
Length: 0.27 miles
Direction: N-S
Address range: 1300 to 1699
Direction: N-S
Address range: 1300 to 1699
Lyon St
Length: 0.26 miles
Direction: N-S
Address range: 1300 to 1699
Direction: N-S
Address range: 1300 to 1699
Fillmore St
Length: 0.26 miles
Direction: N-S
Address range: 1594 to 1999
Direction: N-S
Address range: 1594 to 1999
Scott St
Length: 0.25 miles
Direction: N-S
Address range: 1500 to 1899
Direction: N-S
Address range: 1500 to 1899
Steiner St
Length: 0.25 miles
Direction: N-S
Address range: 1600 to 1999
Direction: N-S
Address range: 1600 to 1999
Pierce St
Length: 0.20 miles
Direction: N-S
Address range: 1600 to 1899
Direction: N-S
Address range: 1600 to 1899
Wilmot St
Length: 0.11 miles
Direction: E-W
Address range: 100 to 199
Direction: E-W
Address range: 100 to 199
Garden St
Length: 0.11 miles
Direction: E-W
Address range: 1 to 99
Direction: E-W
Address range: 1 to 99
Leona Ter
Length: 0.06 miles
Direction: E-W
Address range: 1 to 99
Direction: E-W
Address range: 1 to 99
Avery St
Length: 0.04 miles
Direction: N-S
Address range: 1 to 99
Direction: N-S
Address range: 1 to 99
Erkson Ct
Length: 0.04 miles
Direction: N-S
Address range: 1 to 99
Direction: N-S
Address range: 1 to 99