Holly Park neighborhood in San Francisco, California (CA), 94110 detailed profile
Settings
X

Business Search - 14 Million verified businesses
Area: 0.013 square miles
Population: 362
Population density:
| Holly Park: | 27,098 people per square mile |
| San Francisco: | 17,313 people per square mile |

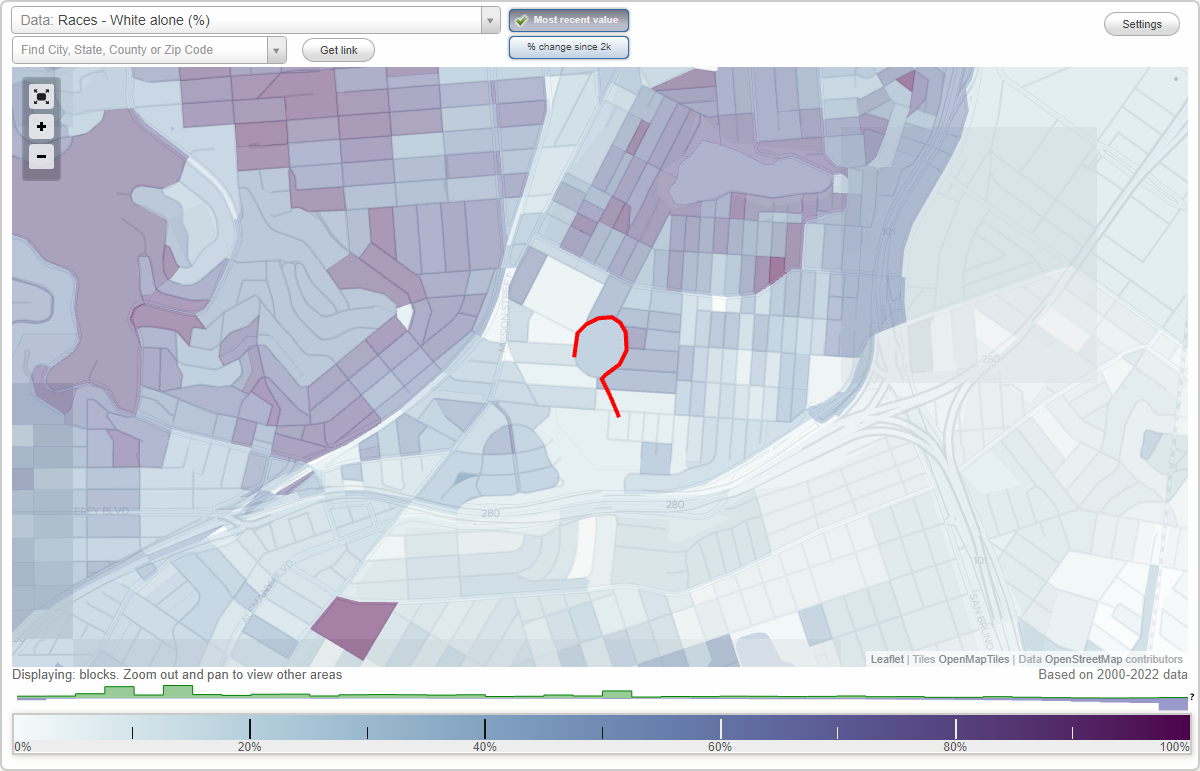
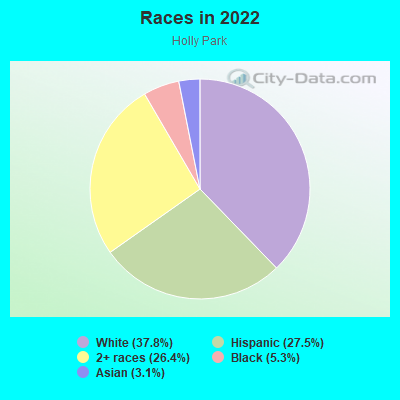
- 13637.8%White
- 9927.5%Hispanic or Latino
- 9526.4%Two or more races
- 195.3%Black
- 113.1%Asian
Distribution of median household income
![Distribution of median household income]()
- 6Less than $10,000
- 2$10,000 to $19,999
- 8$20,000 to $29,999
- 13$30,000 to $39,999
- 4$50,000 to $59,999
- 18$60,000 to $74,999
- 6$75,000 to $99,999
- 16$100,000 to $124,999
- 3$125,000 to $149,999
- 6$150,000 to $199,999
- 57$200,000 or more

Distribution of owner-occupied house/condo value
![Distribution of owner-occupied house/condo value]()
- 3Less than $50,000
- 2$100,000 to $149,999
- 2$200,000 to $249,999
- 3$750,000 to $999,999
- 76$1,000,000 or more

Distribution of rent paid by renters
![Distribution of rent paid by renters]()
- 4$200 to $299
- 2$500 to $599
- 7$700 to $799
- 5$800 to $899
- 7$900 to $999
- 2$1,000 to $1,249
- 10$1,250 to $1,499
- 10$1,500 to $1,999
- 31$2,000 or more

Median rent in 2022:
| Holly Park: | $3,485 |
| San Francisco: | $2,001 |
| Males: | 193 |
| Females: | 169 |
Males:
| This neighborhood: | 37.2 years |
| Whole city: | 40.3 years |
| This neighborhood: | 41.6 years |
| Whole city: | 40.5 years |
Average household size:
| Holly Park: | 2.8 people |
| San Francisco: | 2.2 people |
Percentage of family households:
| Holly Park: | 63.0% |
| San Francisco: | 30.3% |
| Here: | 74.2% |
| San Francisco: | 35.3% |
Percentage of married-couple families with children (among all households):
| Holly Park: | 29.9% |
| San Francisco: | 35.9% |
Percentage of single-mother households (among all households):
| Holly Park: | 1.6% |
| San Francisco: | 6.0% |
Percentage of never married males 15 years old and over:
Percentage of never married females 15 years old and over:
| Holly Park: | 14.8% |
| San Francisco: | 24.6% |
Percentage of never married females 15 years old and over:
| Holly Park: | 11.5% |
| city: | 19.9% |
Percentage of people that speak English not well or not at all:
| Holly Park: | 0.0% |
| San Francisco: | 10.9% |
Percentage of people born in this state:
Percentage of people born in another U.S. state:
Percentage of native residents but born outside the U.S.:
Percentage of foreign born residents:
| Here: | 48.7% |
| San Francisco: | 40.8% |
Percentage of people born in another U.S. state:
| Holly Park: | 29.1% |
| San Francisco: | 23.4% |
Percentage of native residents but born outside the U.S.:
| Here: | 0.5% |
| city: | 2.6% |
Percentage of foreign born residents:
| Here: | 21.7% |
| San Francisco: | 33.2% |
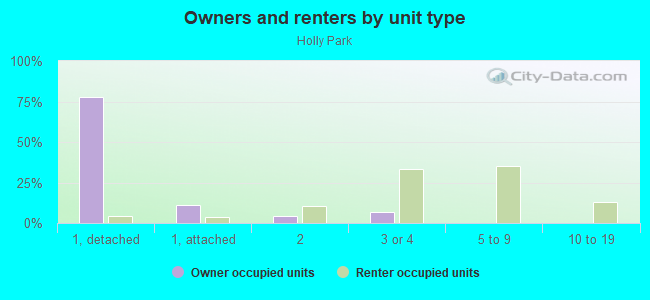
Owner-occupied
Renter-occupied

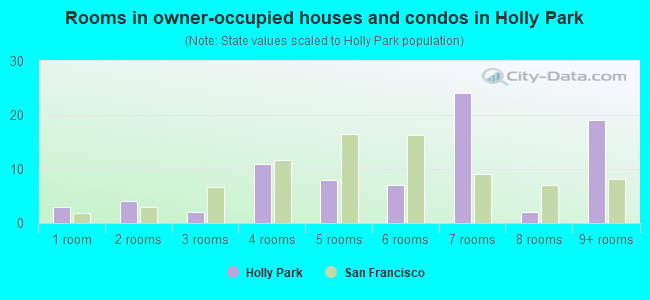
- Rooms in owner-occupied houses and condos in Holly Park
- 31 room
- 42 rooms
- 23 rooms
- 114 rooms
- 85 rooms
- 76 rooms
- 247 rooms
- 28 rooms
- 199+ rooms
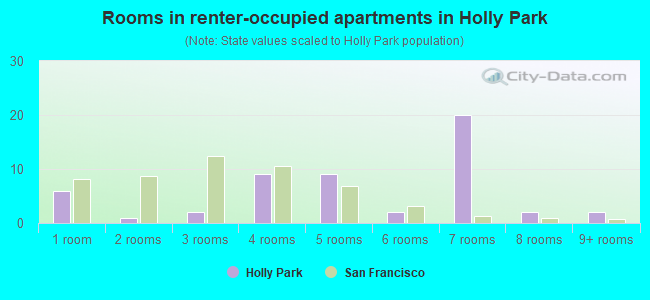
- Rooms in renter-occupied apartments in Holly Park
- 61 room
- 12 rooms
- 23 rooms
- 94 rooms
- 95 rooms
- 26 rooms
- 207 rooms
- 28 rooms
- 29+ rooms
Owner-occupied
Renter-occupied
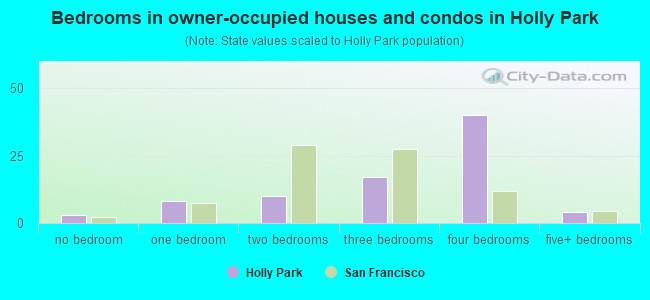
- Bedrooms in owner-occupied houses and condos in Holly Park
- 3no bedroom
- 81 bedroom
- 102 bedrooms
- 173 bedrooms
- 404 bedrooms
- 45+ bedrooms
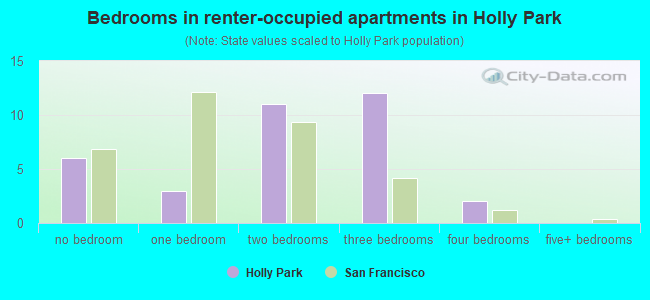
- Bedrooms in renter-occupied apartments in Holly Park
- 6no bedroom
- 31 bedroom
- 112 bedrooms
- 123 bedrooms
- 24 bedrooms
- 05+ bedrooms
Average number of cars or other vehicles available in houses/condos:
Average number of cars or other vehicles available in apartments:
| This neighborhood: | 1.7 |
| San Francisco: | 1.5 |
Average number of cars or other vehicles available in apartments:
| Here: | 1.2 |
| city: | 0.8 |
Percentage of units with a mortgage:
| Holly Park: | 58.9% |
| San Francisco: | 62.3% |
Housing prices:
- Average estimated value of detached houses in 2022 (56.3% of all units):
Holly Park: $1,694,691 San Francisco: $1,942,973
- Average estimated value of housing units in 2-unit structures in 2022 (7.6% of all units):
This neighborhood: $1,177,623 San Francisco: $1,536,932
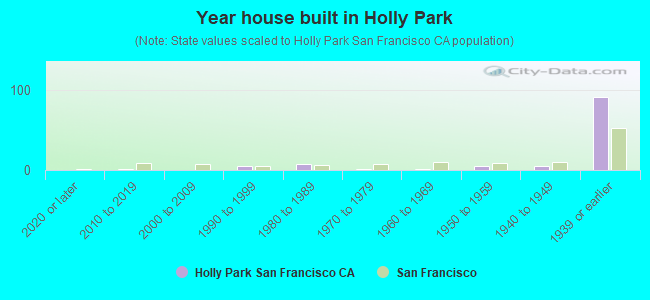
- Year house built in Holly Park
- 02020 or later
- 12010 to 2019
- 02000 to 2009
- 51990 to 1999
- 81980 to 1989
- 11970 to 1979
- 11960 to 1969
- 51950 to 1959
- 51940 to 1949
- 911939 or earlier
City-data.com crime index for city in 2020 (higher means more crime):
| City: | 387.4 |
| U.S. average: | 219.5 |
Travel time to work (commute)
![Travel time to work (commute)]()
- 55 to 9 minutes
- 1010 to 14 minutes
- 2015 to 19 minutes
- 1220 to 24 minutes
- 825 to 29 minutes
- 2230 to 34 minutes
- 2035 to 39 minutes
- 2440 to 44 minutes
- 345 to 59 minutes
- 760 to 89 minutes
- 190 or more minutes

Means of transportation to work
![Means of transportation to work]()
- 19.4%37Drove a car alone
- 26.8%51Carpooled
- 1.6%3Bus
- 6.3%12Subway or elevated rail
- 0.5%1Long-distance train or commuter rail
- 21.5%41Light rail, streetcar or trolley
- 5.8%11Taxi
- 1.1%2Motorcycle
- 22.6%43Bicycle
- 0.5%1Walked
- 19.4%37Worked at home

Time leaving home to go to work
![Time leaving home to go to work]()
- 25:30 a.m. to 5:59 a.m.
- 86:00 a.m. to 6:29 a.m.
- 86:30 a.m. to 6:59 a.m.
- 237:00 a.m. to 7:29 a.m.
- 157:30 a.m. to 7:59 a.m.
- 208:00 a.m. to 8:29 a.m.
- 178:30 a.m. to 8:59 a.m.
- 219:00 a.m. to 9:59 a.m.
- 710:00 a.m. to 10:59 a.m.
- 411:00 a.m. to 11:59 a.m.
- 112:00 p.m. to 3:59 p.m.
- 94:00 p.m. to 11:59 p.m.

Occupations of males:
- Percentage of males in management occupations (except farmers):
Here: 17.3% city: 17.2%
- Percentage of males in business and financial operations occupations:
Here: 2.7% city: 8.9%
- Percentage of males in computer and mathematical occupations:
Here: 7.2% city: 14.6%
- Percentage of males in architecture and engineering occupations:
Here: 2.4% city: 4.0%
- Percentage of males in community and social services occupations:
Here: 2.6% city: 1.0%
- Percentage of males in education, training, and library occupations:
Here: 2.2% city: 3.4%
- Percentage of males in arts, design, entertainment, sports, and media occupations:
Here: 5.5% city: 4.9%
- Percentage of males in healthcare practitioners and technical occupations:
Here: 15.7% city: 3.2%
- Percentage of males in service occupations:
Here: 29.9% city: 11.8%
- Percentage of males in construction, extraction, and maintenance occupations:
Here: 2.2% city: 3.1%
- Percentage of males in transportation occupations:
Here: 1.0% city: 3.4%
Occupations of females:
- Percentage of females in management occupations (except farmers):
Here: 14.8% city: 15.8%
- Percentage of females in business and financial operations occupations:
Here: 26.9% city: 11.5%
- Percentage of females in computer and mathematical occupations:
Here: 1.5% city: 5.1%
- Percentage of females in life, physical, and social science occupations:
Here: 2.6% city: 2.9%
- Percentage of females in community and social services occupations:
Here: 4.2% city: 1.6%
- Percentage of females in arts, design, entertainment, sports, and media occupations:
Here: 4.9% city: 5.1%
- Percentage of females in healthcare practitioners and technical occupations:
Here: 2.3% city: 8.4%
- Percentage of females in service occupations:
Here: 23.0% city: 15.4%
- Percentage of females in sales and office occupations:
Here: 18.9% city: 19.3%
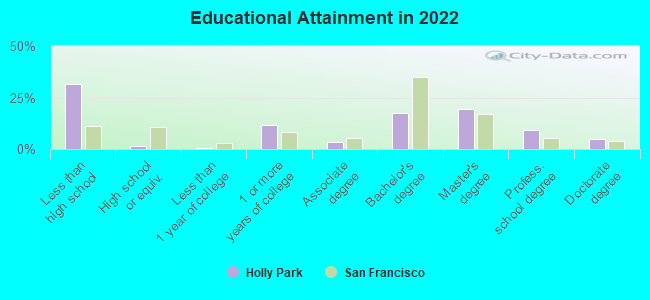
Education in this neighborhood (subdivision or community):
- Percentage of people 3 years and older in K-12 schools:
Holly Park: 15.2% San Francisco: 9.7%
- Percentage of people 3 years and older in undergraduate colleges:
Holly Park: 1.4% San Francisco: 4.8%
- Percentage of people 3 years and older in grad. or professional schools:
Holly Park: 0.9% San Francisco: 2.6%
- Percentage of students K-12 enrolled in private schools:
Holly Park: 26.4% San Francisco: 36.5%
Percentage of population below poverty level:
| Holly Park: | 2.0% |
| San Francisco: | 10.4% |
Median year owner moved in (as recorded in 2022):
Median year renter moved in (as recorded in 2022):
| Holly Park: | 2006 |
| San Francisco: | 2007 |
Median year renter moved in (as recorded in 2022):
| Holly Park: | 2012 |
| San Francisco: | 2019 |
Percentage of married-couple families with both working:
| Holly Park: | 102.9% |
| San Francisco: | 75.9% |
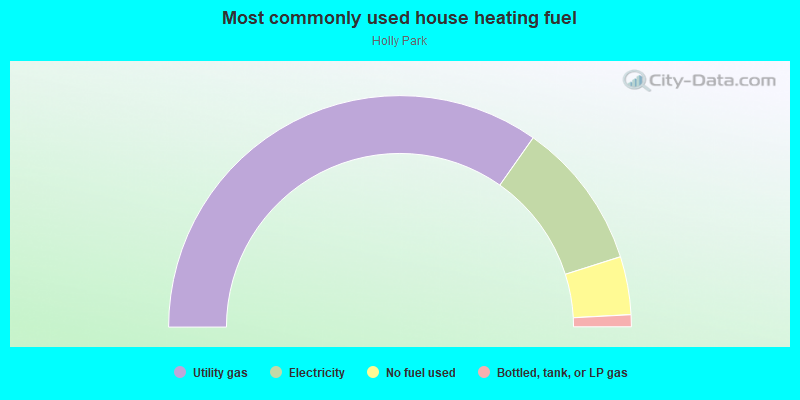
- 69.6%Utility gas
- 20.7%Electricity
- 8.1%No fuel used
- 1.7%Bottled, tank, or LP gas