Sunnydale neighborhood in San Francisco, California (CA), 94134 detailed profile
Settings
X

Business Search - 14 Million verified businesses
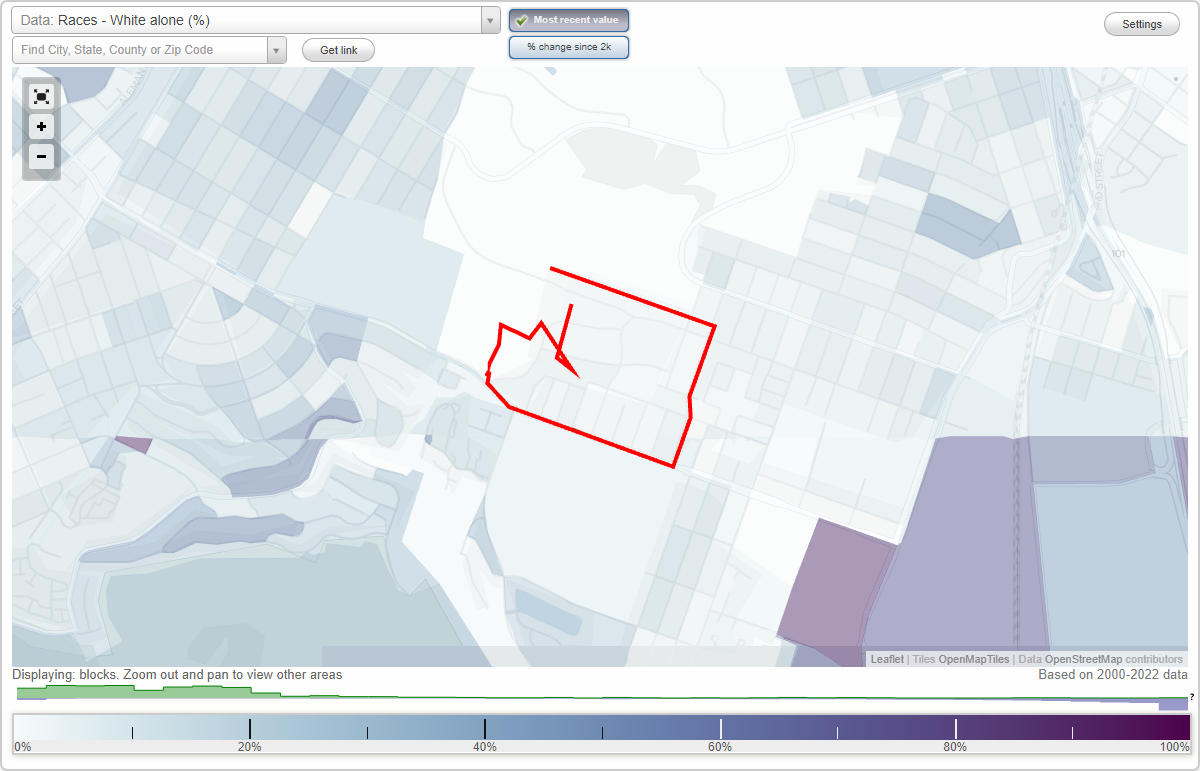
Area: 0.152 square miles
Population: 4,779
Population density:
| Sunnydale: | 31,425 people per square mile |
| San Francisco: | 17,313 people per square mile |

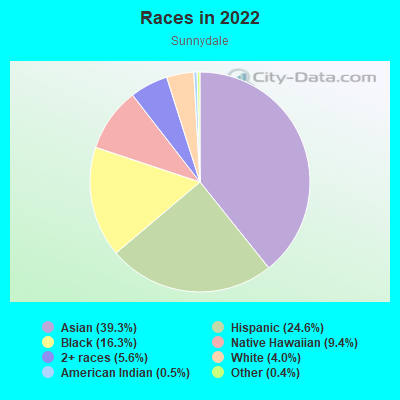
- 2,01039.3%Asian
- 1,25724.6%Hispanic or Latino
- 83216.3%Black
- 4829.4%Native Hawaiian and Other
Pacific Islander - 2845.6%Two or more races
- 2034.0%White
- 250.5%American Indian
- 230.4%Some other race
Median household income in 2022:
| Sunnydale: | $85,248 |
| San Francisco: | $136,692 |
Distribution of median household income
![Distribution of median household income]()
- 148Less than $10,000
- 259$10,000 to $19,999
- 172$20,000 to $29,999
- 140$30,000 to $39,999
- 119$40,000 to $49,999
- 67$50,000 to $59,999
- 134$60,000 to $74,999
- 135$75,000 to $99,999
- 150$100,000 to $124,999
- 81$125,000 to $149,999
- 123$150,000 to $199,999
- 164$200,000 or more

Distribution of owner-occupied house/condo value
![Distribution of owner-occupied house/condo value]()
- 7Less than $50,000
- 14$50,000 to $99,999
- 6$100,000 to $149,999
- 4$250,000 to $299,999
- 10$300,000 to $399,999
- 20$400,000 to $499,999
- 89$500,000 to $749,999
- 318$750,000 to $999,999
- 346$1,000,000 or more

Distribution of rent paid by renters
![Distribution of rent paid by renters]()
- 41Less than $100
- 22$100 to $199
- 119$200 to $299
- 152$300 to $399
- 173$400 to $499
- 212$500 to $599
- 213$600 to $699
- 195$700 to $799
- 60$800 to $899
- 125$900 to $999
- 79$1,000 to $1,249
- 126$1,250 to $1,499
- 54$1,500 to $1,999
- 218$2,000 or more

Median rent in 2022:
| Sunnydale: | $999 |
| San Francisco: | $2,001 |
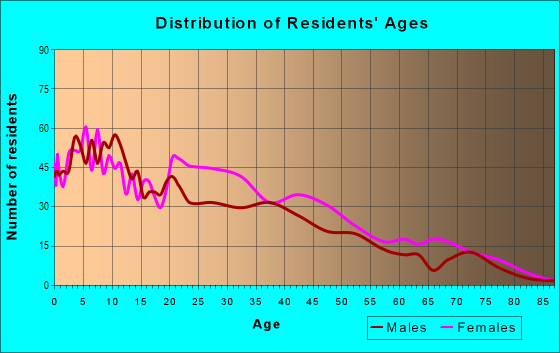
| Males: | 2,230 |
| Females: | 2,548 |
Males:
| This neighborhood: | 41.5 years |
| Whole city: | 40.3 years |
| This neighborhood: | 43.7 years |
| Whole city: | 40.5 years |
Average household size:
| Sunnydale: | 9.6 people |
| San Francisco: | 2.2 people |
Percentage of family households:
| Sunnydale: | 63.5% |
| San Francisco: | 30.3% |
| Here: | 34.5% |
| San Francisco: | 35.3% |
Percentage of married-couple families with children (among all households):
| Sunnydale: | 9.7% |
| San Francisco: | 35.9% |
Percentage of single-mother households (among all households):
| Sunnydale: | 11.5% |
| San Francisco: | 6.0% |
Percentage of never married males 15 years old and over:
Percentage of never married females 15 years old and over:
| Sunnydale: | 21.0% |
| San Francisco: | 24.6% |
Percentage of never married females 15 years old and over:
| Sunnydale: | 21.9% |
| city: | 19.9% |
Percentage of people that speak English not well or not at all:
| Sunnydale: | 20.6% |
| San Francisco: | 10.9% |
Percentage of people born in this state:
Percentage of people born in another U.S. state:
Percentage of native residents but born outside the U.S.:
Percentage of foreign born residents:
| Here: | 43.8% |
| San Francisco: | 40.8% |
Percentage of people born in another U.S. state:
| Sunnydale: | 11.0% |
| San Francisco: | 23.4% |
Percentage of native residents but born outside the U.S.:
| Here: | 1.8% |
| city: | 2.6% |
Percentage of foreign born residents:
| Here: | 43.5% |
| San Francisco: | 33.2% |
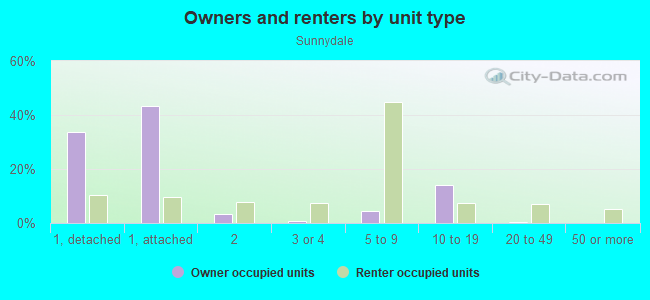
Owner-occupied
Renter-occupied

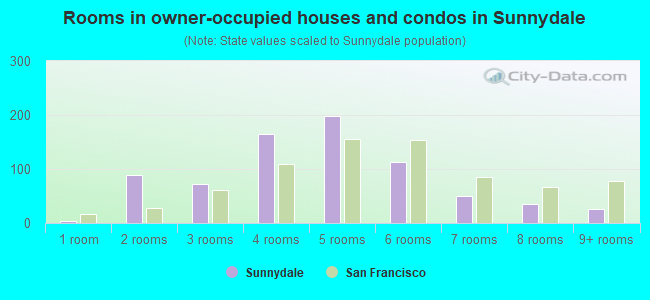
- Rooms in owner-occupied houses and condos in Sunnydale
- 41 room
- 892 rooms
- 723 rooms
- 1644 rooms
- 1995 rooms
- 1136 rooms
- 507 rooms
- 358 rooms
- 269+ rooms
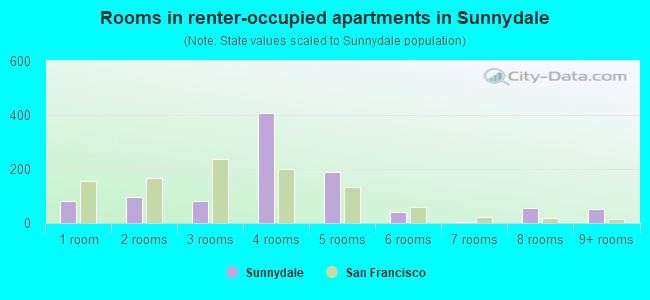
- Rooms in renter-occupied apartments in Sunnydale
- 821 room
- 972 rooms
- 823 rooms
- 4084 rooms
- 1895 rooms
- 426 rooms
- 57 rooms
- 578 rooms
- 529+ rooms
Owner-occupied
Renter-occupied
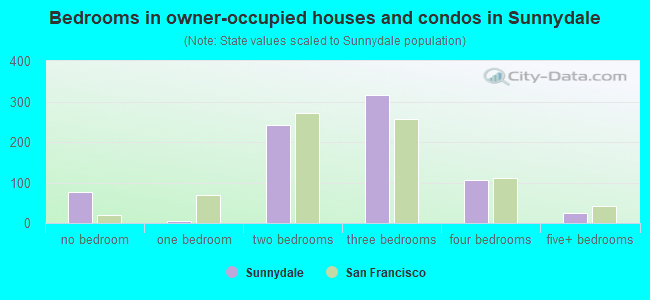
- Bedrooms in owner-occupied houses and condos in Sunnydale
- 77no bedroom
- 51 bedroom
- 2412 bedrooms
- 3173 bedrooms
- 1054 bedrooms
- 255+ bedrooms
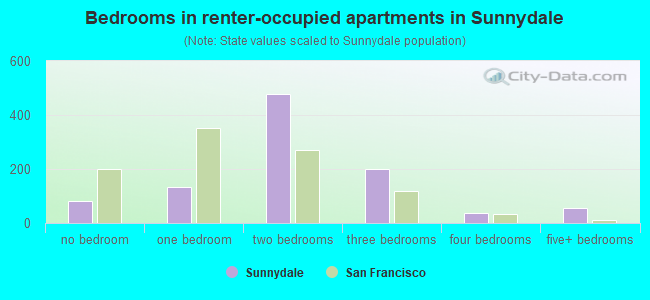
- Bedrooms in renter-occupied apartments in Sunnydale
- 82no bedroom
- 1321 bedroom
- 4772 bedrooms
- 2013 bedrooms
- 374 bedrooms
- 575+ bedrooms
Average number of cars or other vehicles available in houses/condos:
Average number of cars or other vehicles available in apartments:
| This neighborhood: | |
| San Francisco: |
Average number of cars or other vehicles available in apartments:
| Here: | 1.1 |
| city: | 0.8 |
Percentage of units with a mortgage:
| Sunnydale: | 60.4% |
| San Francisco: | 62.3% |
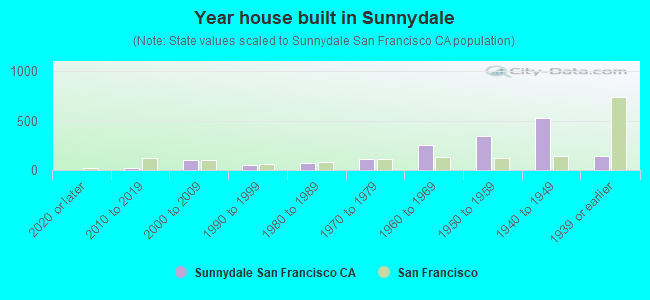
- Year house built in Sunnydale
- 02020 or later
- 212010 to 2019
- 1032000 to 2009
- 461990 to 1999
- 751980 to 1989
- 1131970 to 1979
- 2571960 to 1969
- 3461950 to 1959
- 5251940 to 1949
- 1371939 or earlier
City-data.com crime index for city in 2020 (higher means more crime):
| City: | 387.4 |
| U.S. average: | 219.5 |
Travel time to work (commute)
![Travel time to work (commute)]()
- 25Less than 5 minutes
- 845 to 9 minutes
- 12510 to 14 minutes
- 35615 to 19 minutes
- 16920 to 24 minutes
- 10025 to 29 minutes
- 38830 to 34 minutes
- 6835 to 39 minutes
- 11240 to 44 minutes
- 25245 to 59 minutes
- 21160 to 89 minutes
- 4490 or more minutes

Means of transportation to work
![Means of transportation to work]()
- 49.3%963Drove a car alone
- 13.5%263Carpooled
- 22.4%438Bus
- 3.4%67Subway or elevated rail
- 2.8%55Long-distance train or commuter rail
- 2.5%48Light rail, streetcar or trolley
- 3.8%75Taxi
- 0.3%6Motorcycle
- 0.9%18Bicycle
- 7.1%139Walked
- 2.7%52Other means
- 5.8%113Worked at home

Time leaving home to go to work
![Time leaving home to go to work]()
- 7612:00 a.m. to 4:59 a.m.
- 825:00 a.m. to 5:29 a.m.
- 805:30 a.m. to 5:59 a.m.
- 1696:00 a.m. to 6:29 a.m.
- 1896:30 a.m. to 6:59 a.m.
- 3277:00 a.m. to 7:29 a.m.
- 1977:30 a.m. to 7:59 a.m.
- 1088:00 a.m. to 8:29 a.m.
- 598:30 a.m. to 8:59 a.m.
- 1429:00 a.m. to 9:59 a.m.
- 11910:00 a.m. to 10:59 a.m.
- 3011:00 a.m. to 11:59 a.m.
- 14312:00 p.m. to 3:59 p.m.
- 1704:00 p.m. to 11:59 p.m.

Occupations of males:
- Percentage of males in management occupations (except farmers):
Here: 4.7% city: 17.2%
- Percentage of males in business and financial operations occupations:
Here: 3.6% city: 8.9%
- Percentage of males in computer and mathematical occupations:
Here: 2.2% city: 14.6%
- Percentage of males in architecture and engineering occupations:
Here: 2.0% city: 4.0%
- Percentage of males in life, physical, and social science occupations:
Here: 1.1% city: 2.4%
- Percentage of males in education, training, and library occupations:
Here: 1.0% city: 3.4%
- Percentage of males in service occupations:
Here: 28.1% city: 11.8%
- Percentage of males in sales and office occupations:
Here: 11.6% city: 13.5%
- Percentage of males in construction, extraction, and maintenance occupations:
Here: 11.7% city: 3.1%
- Percentage of males in production occupations:
Here: 5.9% city: 2.5%
- Percentage of males in transportation occupations:
Here: 17.0% city: 3.4%
- Percentage of males in material moving occupations:
Here: 4.2% city: 1.8%
Occupations of females:
- Percentage of females in management occupations (except farmers):
Here: 7.5% city: 15.8%
- Percentage of females in business and financial operations occupations:
Here: 4.8% city: 11.5%
- Percentage of females in computer and mathematical occupations:
Here: 2.1% city: 5.1%
- Percentage of females in legal occupations:
Here: 1.0% city: 3.0%
- Percentage of females in education, training, and library occupations:
Here: 3.4% city: 7.1%
- Percentage of females in healthcare practitioners and technical occupations:
Here: 4.1% city: 8.4%
- Percentage of females in service occupations:
Here: 38.0% city: 15.4%
- Percentage of females in sales and office occupations:
Here: 31.5% city: 19.3%
- Percentage of females in production occupations:
Here: 2.9% city: 1.5%
- Percentage of females in material moving occupations:
Here: 3.3% city: 0.8%
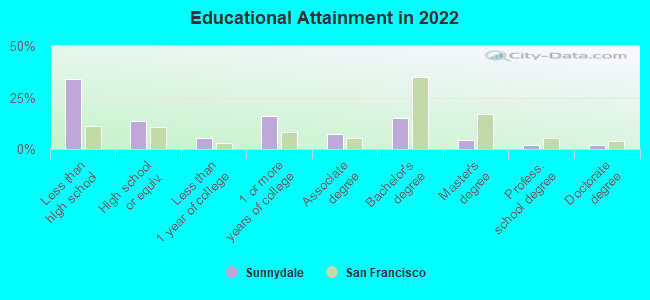
Education in this neighborhood (subdivision or community):
- Percentage of people 3 years and older in K-12 schools:
Sunnydale: 24.6% San Francisco: 9.7%
- Percentage of people 3 years and older in undergraduate colleges:
Sunnydale: 6.6% San Francisco: 4.8%
- Percentage of people 3 years and older in grad. or professional schools:
Sunnydale: 0.6% San Francisco: 2.6%
- Percentage of students K-12 enrolled in private schools:
Sunnydale: 24.9% San Francisco: 36.5%
Percentage of population below poverty level:
| Sunnydale: | 24.2% |
| San Francisco: | 10.4% |
Median year renter moved in (as recorded in 2022):
| Sunnydale: | 2010 |
| San Francisco: | 2019 |
Percentage of married-couple families with both working:
| Sunnydale: | 63.9% |
| San Francisco: | 75.9% |
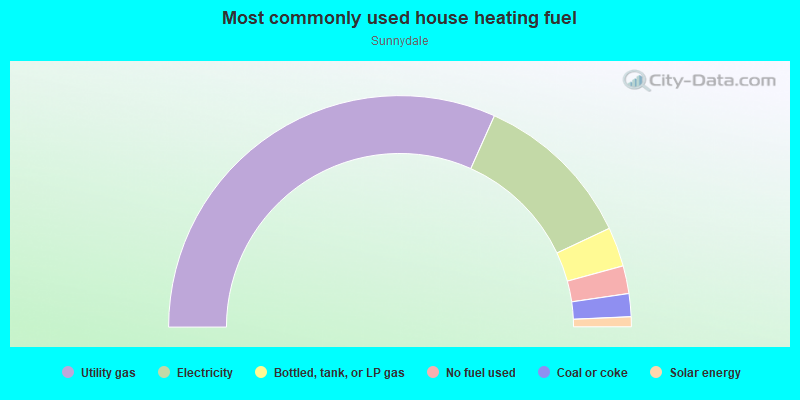
- 63.4%Utility gas
- 22.6%Electricity
- 5.5%Bottled, tank, or LP gas
- 3.9%No fuel used
- 3.2%Coal or coke
- 1.4%Solar energy
Roads and streets:
Sunnydale Ave
Length: 0.44 miles
Directions: E-W, SE-NW
Address range: 1400 to 1999
Directions: E-W, SE-NW
Address range: 1400 to 1999
Blythdale Ave
Length: 0.39 miles
Direction: E-W
Address range: 1 to 299
Direction: E-W
Address range: 1 to 299
Velasco Ave
Length: 0.32 miles
Directions: E-W, SW-NE
Address range: 400 to 899
Directions: E-W, SW-NE
Address range: 400 to 899
Brookdale Ave
Length: 0.28 miles
Directions: E-W, N-S, SW-NE
Address range: 1 to 199
Directions: E-W, N-S, SW-NE
Address range: 1 to 199
Parque Dr
Length: 0.23 miles
Directions: E-W, SW-NE
Address range: 100 to 299
Directions: E-W, SW-NE
Address range: 100 to 299
Sawyer St
Length: 0.20 miles
Directions: N-S, SW-NE
Address range: 500 to 699
Directions: N-S, SW-NE
Address range: 500 to 699
Santos St
Length: 0.19 miles
Directions: N-S, SW-NE
Address range: 1 to 199
Directions: N-S, SW-NE
Address range: 1 to 199
Hahn St
Length: 0.15 miles
Direction: SW-NE
Address range: 200 to 299
Direction: SW-NE
Address range: 200 to 299
Pasadena St
Length: 0.10 miles
Direction: SW-NE
Address range: 1 to 98
Direction: SW-NE
Address range: 1 to 98
Sunrise Way
Length: 0.09 miles
Direction: E-W
Address range: 400 to 499
Direction: E-W
Address range: 400 to 499
Castillo St
Length: 0.09 miles
Direction: SW-NE
Address range: 1 to 77
Direction: SW-NE
Address range: 1 to 77
Pueblo St
Length: 0.07 miles
Direction: SW-NE
Address range: 1 to 81
Direction: SW-NE
Address range: 1 to 81
Calgary St
Length: 0.05 miles
Directions: N-S, SW-NE
Address range: 1 to 98
Directions: N-S, SW-NE
Address range: 1 to 98
Roads and streets:
Calgary St
Length: 0.07 miles
Direction: SW-NE
Address range: 1 to 99
Direction: SW-NE
Address range: 1 to 99
Geneva Ave
Length: 0.06 miles
Direction: E-W
Address range: 2500 to 2599
Direction: E-W
Address range: 2500 to 2599
Pueblo St
Length: 0.06 miles
Direction: SW-NE
Address range: 1 to 99
Direction: SW-NE
Address range: 1 to 99