Cole Valley neighborhood in San Francisco, California (CA), 94117 detailed profile
Settings
X

Business Search - 14 Million verified businesses
Area: 0.135 square miles
Population: 3,376
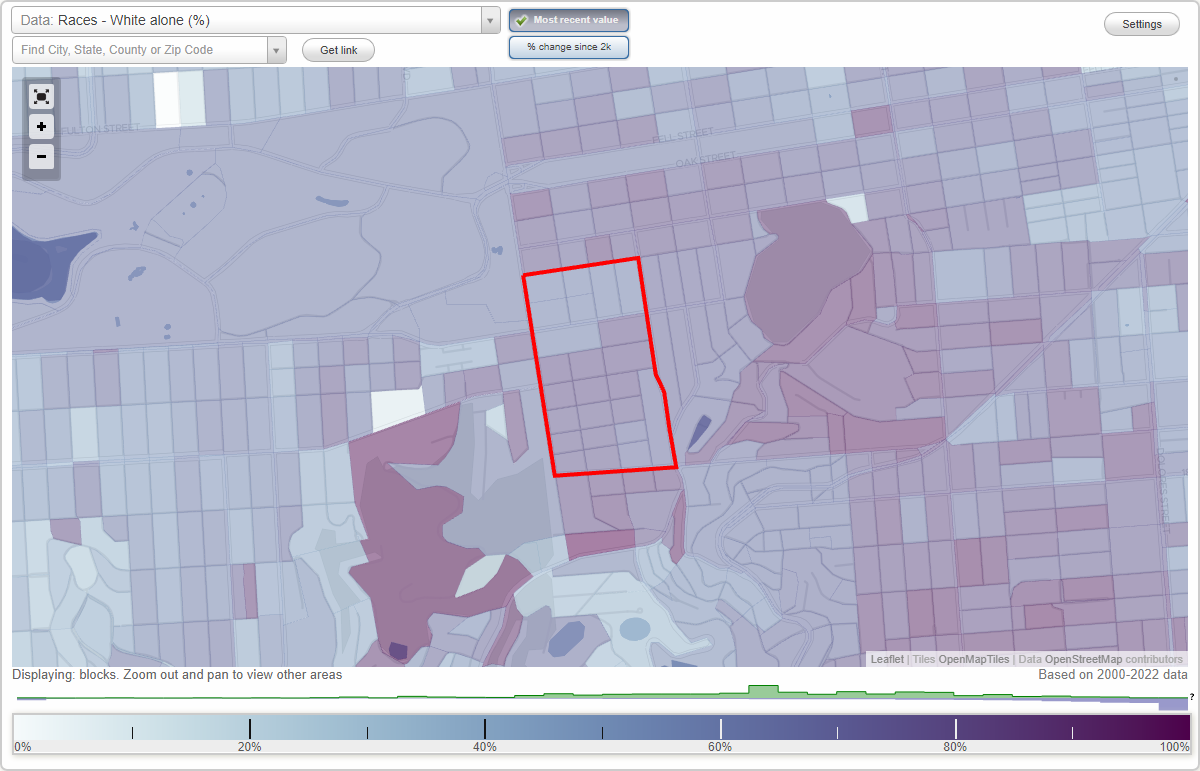
Population density:
| Cole Valley: | 25,087 people per square mile |
| San Francisco: | 17,313 people per square mile |

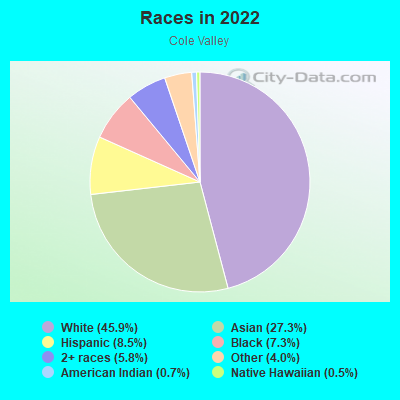
- 1,68645.9%White
- 1,00327.3%Asian
- 3118.5%Hispanic or Latino
- 2677.3%Black
- 2145.8%Two or more races
- 1464.0%Some other race
- 270.7%American Indian
- 180.5%Native Hawaiian and Other
Pacific Islander
Median household income in 2022:
| Cole Valley: | $187,090 |
| San Francisco: | $136,692 |
Distribution of median household income
![Distribution of median household income]()
- 241Less than $10,000
- 13$10,000 to $19,999
- 57$20,000 to $29,999
- 46$30,000 to $39,999
- 127$40,000 to $49,999
- 101$50,000 to $59,999
- 111$60,000 to $74,999
- 82$75,000 to $99,999
- 220$100,000 to $124,999
- 114$125,000 to $149,999
- 215$150,000 to $199,999
- 519$200,000 or more

Distribution of owner-occupied house/condo value
![Distribution of owner-occupied house/condo value]()
- 16$150,000 to $199,999
- 100$200,000 to $249,999
- 33$500,000 to $749,999
- 99$750,000 to $999,999
- 232$1,000,000 or more

Distribution of rent paid by renters
![Distribution of rent paid by renters]()
- 7$300 to $399
- 4$700 to $799
- 7$900 to $999
- 54$1,000 to $1,249
- 125$1,250 to $1,499
- 169$1,500 to $1,999
- 1,173$2,000 or more
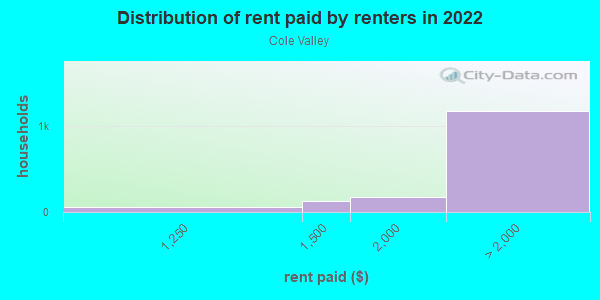
Median rent in 2022:
| Cole Valley: | $2,748 |
| San Francisco: | $2,001 |
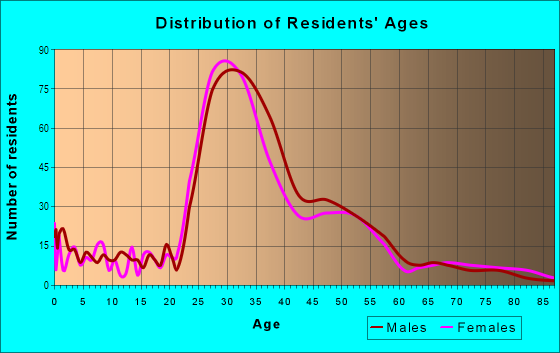
| Males: | 1,480 |
| Females: | 1,895 |
Males:
| This neighborhood: | 43.2 years |
| Whole city: | 40.3 years |
| This neighborhood: | 33.3 years |
| Whole city: | 40.5 years |
Average household size:
| Cole Valley: | 6.8 people |
| San Francisco: | 2.2 people |
Percentage of family households:
| Cole Valley: | 17.0% |
| San Francisco: | 30.3% |
| Here: | 21.3% |
| San Francisco: | 35.3% |
Percentage of married-couple families with children (among all households):
| Cole Valley: | 41.7% |
| San Francisco: | 35.9% |
Percentage of single-mother households (among all households):
| Cole Valley: | 17.1% |
| San Francisco: | 6.0% |
Percentage of never married males 15 years old and over:
Percentage of never married females 15 years old and over:
| Cole Valley: | 29.7% |
| San Francisco: | 24.6% |
Percentage of never married females 15 years old and over:
| Cole Valley: | 36.9% |
| city: | 19.9% |
Percentage of people that speak English not well or not at all:
| Cole Valley: | 0.0% |
| San Francisco: | 10.9% |
Percentage of people born in this state:
Percentage of people born in another U.S. state:
Percentage of native residents but born outside the U.S.:
Percentage of foreign born residents:
| Here: | 41.0% |
| San Francisco: | 40.8% |
Percentage of people born in another U.S. state:
| Cole Valley: | 36.0% |
| San Francisco: | 23.4% |
Percentage of native residents but born outside the U.S.:
| Here: | 2.2% |
| city: | 2.6% |
Percentage of foreign born residents:
| Here: | 20.8% |
| San Francisco: | 33.2% |
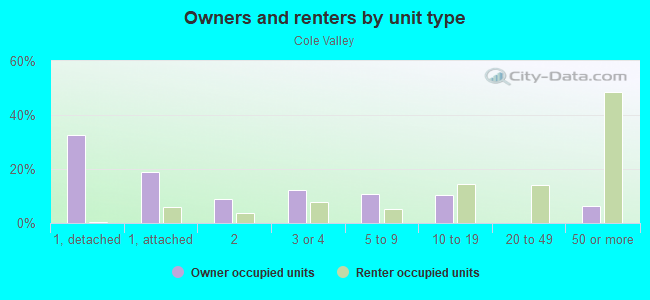
Owner-occupied
Renter-occupied

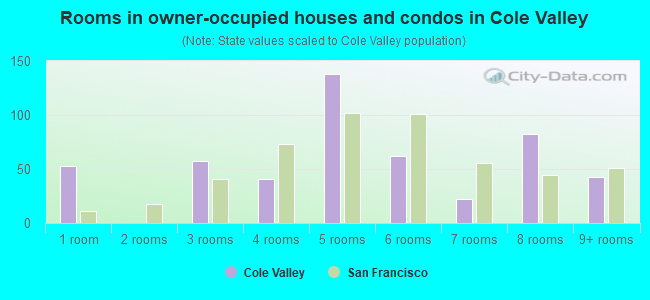
- Rooms in owner-occupied houses and condos in Cole Valley
- 531 room
- 02 rooms
- 573 rooms
- 414 rooms
- 1385 rooms
- 626 rooms
- 227 rooms
- 828 rooms
- 439+ rooms
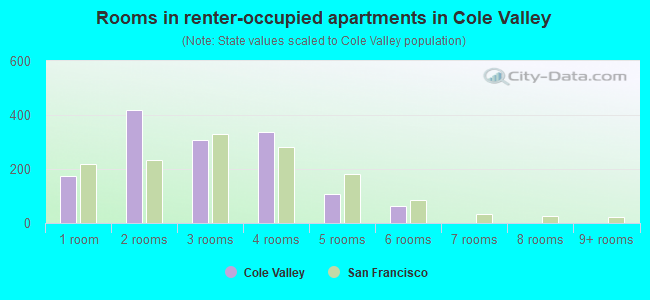
- Rooms in renter-occupied apartments in Cole Valley
- 1731 room
- 4202 rooms
- 3073 rooms
- 3384 rooms
- 1065 rooms
- 636 rooms
- 07 rooms
- 08 rooms
- 09+ rooms
Owner-occupied
Renter-occupied
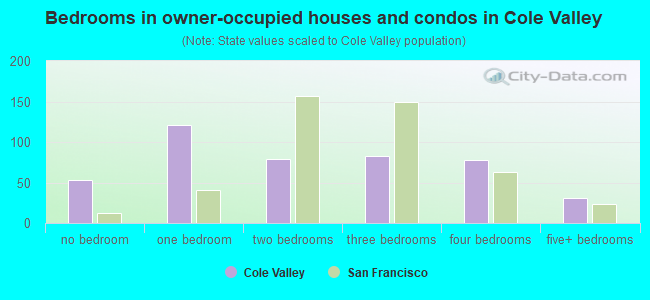
- Bedrooms in owner-occupied houses and condos in Cole Valley
- 53no bedroom
- 1211 bedroom
- 792 bedrooms
- 833 bedrooms
- 784 bedrooms
- 315+ bedrooms
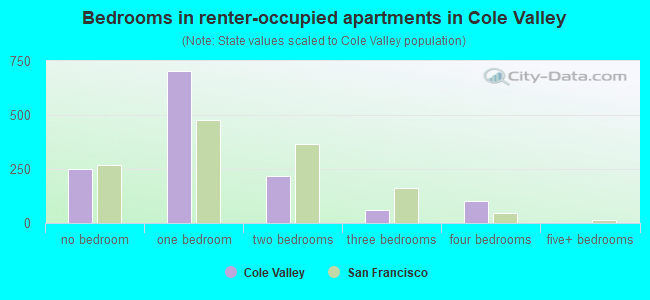
- Bedrooms in renter-occupied apartments in Cole Valley
- 249no bedroom
- 7061 bedroom
- 2182 bedrooms
- 613 bedrooms
- 1004 bedrooms
- 05+ bedrooms
Average number of cars or other vehicles available in houses/condos:
Average number of cars or other vehicles available in apartments:
| This neighborhood: | 1.5 |
| San Francisco: | 1.5 |
Average number of cars or other vehicles available in apartments:
| Here: | 0.8 |
| city: | 0.8 |
Percentage of units with a mortgage:
| Cole Valley: | 48.8% |
| San Francisco: | 62.3% |
Housing prices:
- Average estimated value of detached houses in 2022 (11.0% of all units):
Cole Valley: $1,462,495 San Francisco: $1,942,973
- Average estimated value of townhouses or other attached units in 2022 (9.5% of all units):
This neighborhood: $1,515,688 city: $1,528,422
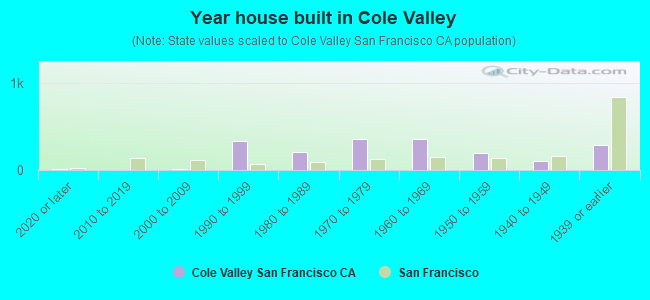
- Year house built in Cole Valley
- 62020 or later
- 52010 to 2019
- 162000 to 2009
- 3261990 to 1999
- 2061980 to 1989
- 3491970 to 1979
- 3501960 to 1969
- 1951950 to 1959
- 981940 to 1949
- 2821939 or earlier
City-data.com crime index for city in 2020 (higher means more crime):
| City: | 387.4 |
| U.S. average: | 219.5 |
Travel time to work (commute)
![Travel time to work (commute)]()
- 13Less than 5 minutes
- 605 to 9 minutes
- 8410 to 14 minutes
- 8215 to 19 minutes
- 21520 to 24 minutes
- 6525 to 29 minutes
- 16630 to 34 minutes
- 3435 to 39 minutes
- 4540 to 44 minutes
- 11545 to 59 minutes
- 4160 to 89 minutes
- 3390 or more minutes

Means of transportation to work
![Means of transportation to work]()
- 15.5%328Drove a car alone
- 6.4%134Carpooled
- 6.1%128Bus
- 10.4%220Subway or elevated rail
- 1.9%40Long-distance train or commuter rail
- 3.1%65Light rail, streetcar or trolley
- 2.0%42Taxi
- 0.3%6Motorcycle
- 4.0%84Bicycle
- 27.3%575Walked
- 1.5%32Other means
- 24.3%512Worked at home

Time leaving home to go to work
![Time leaving home to go to work]()
- 1812:00 a.m. to 4:59 a.m.
- 35:00 a.m. to 5:29 a.m.
- 95:30 a.m. to 5:59 a.m.
- 616:00 a.m. to 6:29 a.m.
- 1186:30 a.m. to 6:59 a.m.
- 717:00 a.m. to 7:29 a.m.
- 1097:30 a.m. to 7:59 a.m.
- 1698:00 a.m. to 8:29 a.m.
- 888:30 a.m. to 8:59 a.m.
- 1359:00 a.m. to 9:59 a.m.
- 4210:00 a.m. to 10:59 a.m.
- 6711:00 a.m. to 11:59 a.m.
- 5212:00 p.m. to 3:59 p.m.
- 274:00 p.m. to 11:59 p.m.

Occupations of males:
- Percentage of males in management occupations (except farmers):
Here: 13.1% city: 17.2%
- Percentage of males in business and financial operations occupations:
Here: 5.0% city: 8.9%
- Percentage of males in computer and mathematical occupations:
Here: 11.2% city: 14.6%
- Percentage of males in architecture and engineering occupations:
Here: 6.3% city: 4.0%
- Percentage of males in life, physical, and social science occupations:
Here: 18.5% city: 2.4%
- Percentage of males in legal occupations:
Here: 5.8% city: 2.5%
- Percentage of males in education, training, and library occupations:
Here: 8.4% city: 3.4%
- Percentage of males in arts, design, entertainment, sports, and media occupations:
Here: 6.5% city: 4.9%
- Percentage of males in healthcare practitioners and technical occupations:
Here: 11.2% city: 3.2%
- Percentage of males in service occupations:
Here: 2.3% city: 11.8%
- Percentage of males in sales and office occupations:
Here: 6.6% city: 13.5%
- Percentage of males in material moving occupations:
Here: 2.3% city: 1.8%
Occupations of females:
- Percentage of females in management occupations (except farmers):
Here: 10.0% city: 15.8%
- Percentage of females in business and financial operations occupations:
Here: 13.4% city: 11.5%
- Percentage of females in computer and mathematical occupations:
Here: 1.1% city: 5.1%
- Percentage of females in architecture and engineering occupations:
Here: 2.9% city: 1.6%
- Percentage of females in life, physical, and social science occupations:
Here: 6.3% city: 2.9%
- Percentage of females in legal occupations:
Here: 5.3% city: 3.0%
- Percentage of females in education, training, and library occupations:
Here: 2.7% city: 7.1%
- Percentage of females in arts, design, entertainment, sports, and media occupations:
Here: 2.9% city: 5.1%
- Percentage of females in healthcare practitioners and technical occupations:
Here: 34.5% city: 8.4%
- Percentage of females in service occupations:
Here: 11.0% city: 15.4%
- Percentage of females in sales and office occupations:
Here: 8.5% city: 19.3%
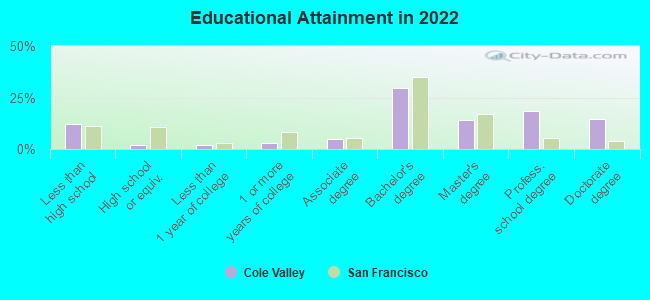
Education in this neighborhood (subdivision or community):
- Percentage of people 3 years and older in K-12 schools:
Cole Valley: 3.8% San Francisco: 9.7%
- Percentage of people 3 years and older in undergraduate colleges:
Cole Valley: 14.9% San Francisco: 4.8%
- Percentage of people 3 years and older in grad. or professional schools:
Cole Valley: 22.2% San Francisco: 2.6%
- Percentage of students K-12 enrolled in private schools:
Cole Valley: 67.2% San Francisco: 36.5%
Percentage of population below poverty level:
| Cole Valley: | 10.3% |
| San Francisco: | 10.4% |
Median year owner moved in (as recorded in 2022):
Median year renter moved in (as recorded in 2022):
| Cole Valley: | 1993 |
| San Francisco: | 2007 |
Median year renter moved in (as recorded in 2022):
| Cole Valley: | 2010 |
| San Francisco: | 2019 |
Percentage of married-couple families with both working:
| Cole Valley: | 112.3% |
| San Francisco: | 75.9% |
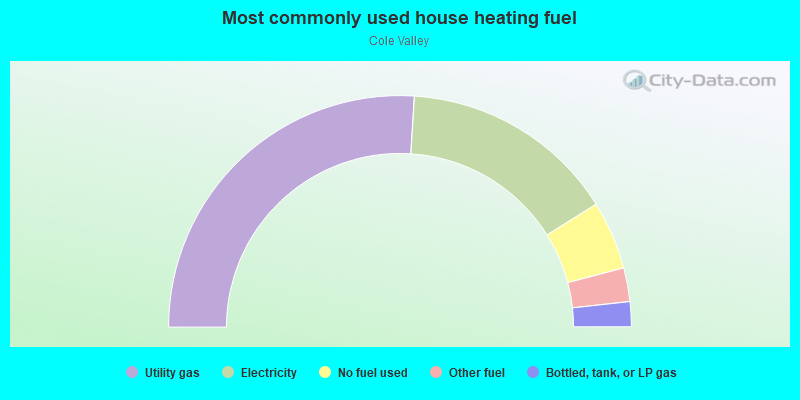
- 52.0%Utility gas
- 30.2%Electricity
- 9.6%No fuel used
- 4.7%Other fuel
- 3.5%Bottled, tank, or LP gas
Roads and streets:
Cole St
Length: 0.42 miles
Direction: N-S
Address range: 749 to 1399
Direction: N-S
Address range: 749 to 1399
Clayton St
Length: 0.37 miles
Directions: N-S, SE-NW
Address range: 800 to 1199
Directions: N-S, SE-NW
Address range: 800 to 1199
Shrader St
Length: 0.35 miles
Direction: N-S
Address range: 800 to 1499
Direction: N-S
Address range: 800 to 1499
17th St
Length: 0.26 miles
Direction: E-W
Address range: 4600 to 4899
Direction: E-W
Address range: 4600 to 4899
Carl St
Length: 0.25 miles
Direction: E-W
Address range: 1 to 149
Direction: E-W
Address range: 1 to 149
Parnassus Ave
Length: 0.25 miles
Direction: E-W
Address range: 1 to 149
Direction: E-W
Address range: 1 to 149
Belvedere St
Length: 0.23 miles
Direction: N-S
Address range: 400 to 599
Direction: N-S
Address range: 400 to 599
Frederick St
Length: 0.23 miles
Direction: E-W
Address range: 300 to 449
Direction: E-W
Address range: 300 to 449
Grattan St
Length: 0.19 miles
Direction: E-W
Address range: 1 to 199
Direction: E-W
Address range: 1 to 199
Alma St
Length: 0.19 miles
Direction: E-W
Address range: 1 to 199
Direction: E-W
Address range: 1 to 199
Rivoli St
Length: 0.19 miles
Direction: E-W
Address range: 1 to 199
Direction: E-W
Address range: 1 to 199
Beulah St
Length: 0.08 miles
Direction: E-W
Address range: 1 to 99
Direction: E-W
Address range: 1 to 99