Inner Richmond neighborhood in San Francisco, California (CA), 94118 detailed profile
Settings
X

Business Search - 14 Million verified businesses
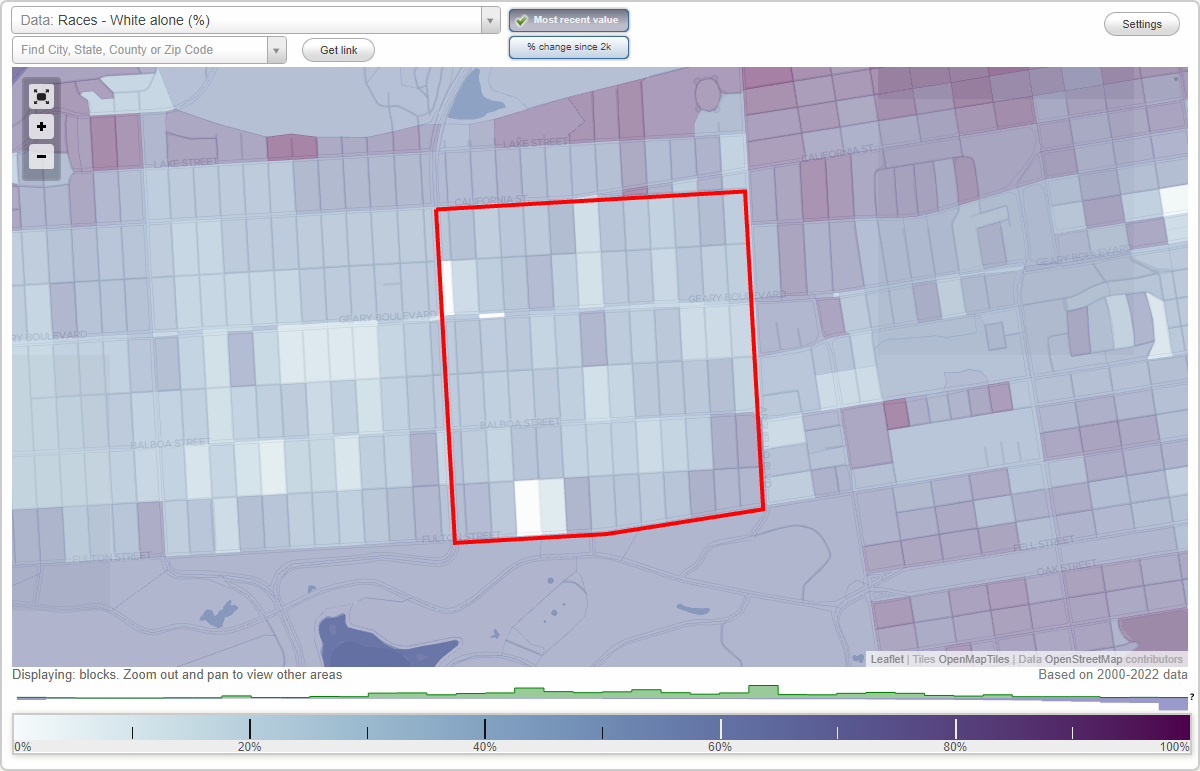
Area: 0.561 square miles
Population: 17,646
Population density:
| Inner Richmond: | 31,451 people per square mile |
| San Francisco: | 17,313 people per square mile |

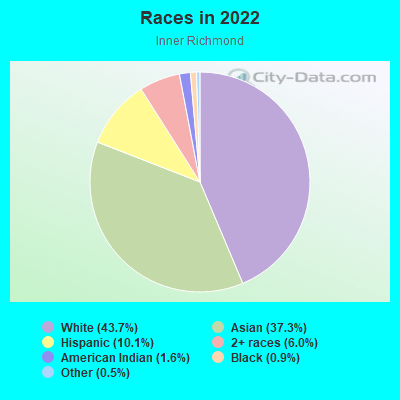
- 7,89743.7%White
- 6,73837.3%Asian
- 1,82810.1%Hispanic or Latino
- 1,0916.0%Two or more races
- 2851.6%American Indian
- 1630.9%Black
- 840.5%Some other race
Median household income in 2022:
| Inner Richmond: | $160,950 |
| San Francisco: | $136,692 |
Distribution of median household income
![Distribution of median household income]()
- 525Less than $10,000
- 752$10,000 to $19,999
- 549$20,000 to $29,999
- 445$30,000 to $39,999
- 400$40,000 to $49,999
- 212$50,000 to $59,999
- 458$60,000 to $74,999
- 876$75,000 to $99,999
- 620$100,000 to $124,999
- 426$125,000 to $149,999
- 863$150,000 to $199,999
- 3,132$200,000 or more

Distribution of owner-occupied house/condo value
![Distribution of owner-occupied house/condo value]()
- 310$50,000 to $99,999
- 703$200,000 to $249,999
- 296$400,000 to $499,999
- 318$500,000 to $749,999
- 220$750,000 to $999,999
- 2,154$1,000,000 or more

Distribution of rent paid by renters
![Distribution of rent paid by renters]()
- 707$200 to $299
- 212$400 to $499
- 174$500 to $599
- 99$600 to $699
- 267$800 to $899
- 118$900 to $999
- 535$1,000 to $1,249
- 525$1,250 to $1,499
- 1,080$1,500 to $1,999
- 3,454$2,000 or more

Median rent in 2022:
| Inner Richmond: | $2,407 |
| San Francisco: | $2,001 |
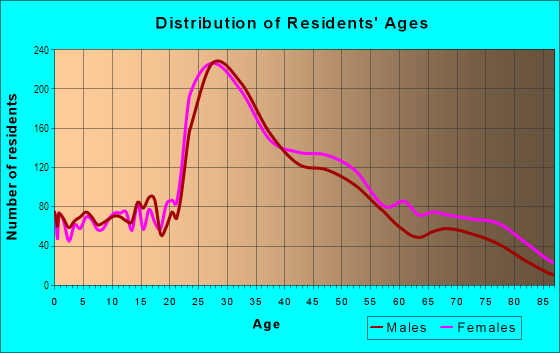
| Males: | 8,543 |
| Females: | 9,102 |
Males:
| This neighborhood: | 39.1 years |
| Whole city: | 40.3 years |
| This neighborhood: | 42.2 years |
| Whole city: | 40.5 years |
Average household size:
| Inner Richmond: | 4.3 people |
| San Francisco: | 2.2 people |
Percentage of family households:
| Inner Richmond: | 36.9% |
| San Francisco: | 30.3% |
| Here: | 38.5% |
| San Francisco: | 35.3% |
Percentage of married-couple families with children (among all households):
| Inner Richmond: | 34.6% |
| San Francisco: | 35.9% |
Percentage of single-mother households (among all households):
| Inner Richmond: | 8.8% |
| San Francisco: | 6.0% |
Percentage of never married males 15 years old and over:
Percentage of never married females 15 years old and over:
| Inner Richmond: | 22.7% |
| San Francisco: | 24.6% |
Percentage of never married females 15 years old and over:
| Inner Richmond: | 24.3% |
| city: | 19.9% |
Percentage of people that speak English not well or not at all:
| Inner Richmond: | 10.4% |
| San Francisco: | 10.9% |
Percentage of people born in this state:
Percentage of people born in another U.S. state:
Percentage of native residents but born outside the U.S.:
Percentage of foreign born residents:
| Here: | 43.7% |
| San Francisco: | 40.8% |
Percentage of people born in another U.S. state:
| Inner Richmond: | 27.4% |
| San Francisco: | 23.4% |
Percentage of native residents but born outside the U.S.:
| Here: | 1.8% |
| city: | 2.6% |
Percentage of foreign born residents:
| Here: | 27.0% |
| San Francisco: | 33.2% |
Owner-occupied
Renter-occupied

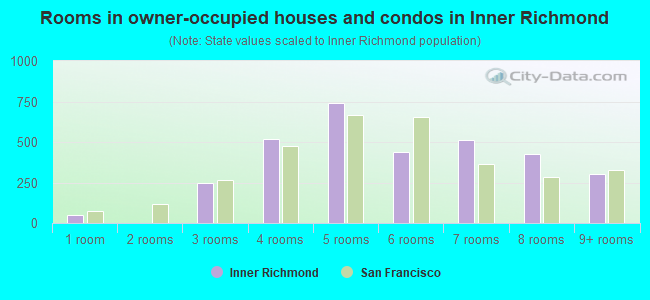
- Rooms in owner-occupied houses and condos in Inner Richmond
- 491 room
- 02 rooms
- 2473 rooms
- 5194 rooms
- 7395 rooms
- 4376 rooms
- 5107 rooms
- 4288 rooms
- 3019+ rooms
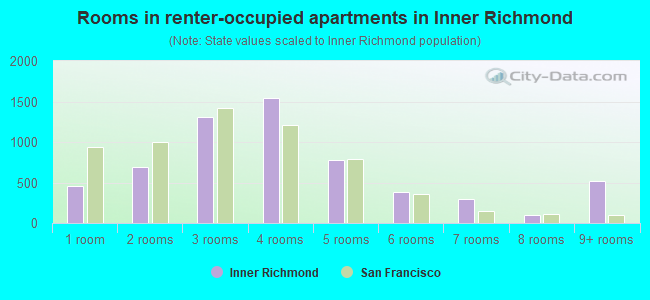
- Rooms in renter-occupied apartments in Inner Richmond
- 4551 room
- 6932 rooms
- 1,3103 rooms
- 1,5414 rooms
- 7795 rooms
- 3776 rooms
- 2987 rooms
- 958 rooms
- 5219+ rooms
Owner-occupied
Renter-occupied
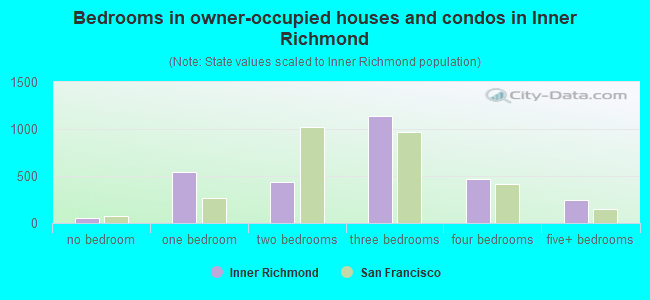
- Bedrooms in owner-occupied houses and condos in Inner Richmond
- 49no bedroom
- 5461 bedroom
- 4342 bedrooms
- 1,1383 bedrooms
- 4724 bedrooms
- 2475+ bedrooms
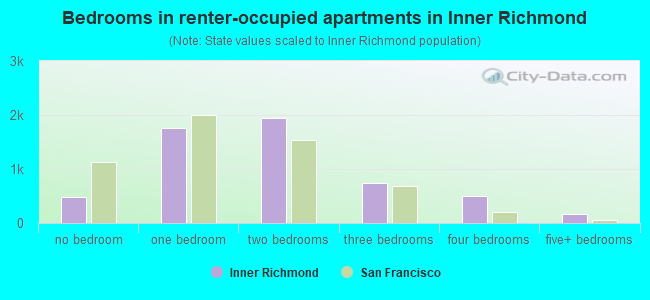
- Bedrooms in renter-occupied apartments in Inner Richmond
- 481no bedroom
- 1,7611 bedroom
- 1,9442 bedrooms
- 7503 bedrooms
- 5074 bedrooms
- 1715+ bedrooms
Average number of cars or other vehicles available in houses/condos:
Average number of cars or other vehicles available in apartments:
| This neighborhood: | 1.2 |
| San Francisco: | 1.5 |
Average number of cars or other vehicles available in apartments:
| Here: | 0.9 |
| city: | 0.8 |
Percentage of units with a mortgage:
| Inner Richmond: | 62.1% |
| San Francisco: | 62.3% |
Housing prices:
- Average estimated value of detached houses in 2022 (10.1% of all units):
Inner Richmond: $2,954,501 San Francisco: $1,942,973
- Average estimated value of townhouses or other attached units in 2022 (7.7% of all units):
This neighborhood: $2,469,338 city: $1,528,422
- Average estimated value of housing units in 2-unit structures in 2022 (19.5% of all units):
This neighborhood: $1,696,152 San Francisco: $1,536,932
- Average estimated '22 value of housing units in 3-to-4-unit structures (27.8% of all units):
Inner Richmond: $1,004,371 city: $1,622,965
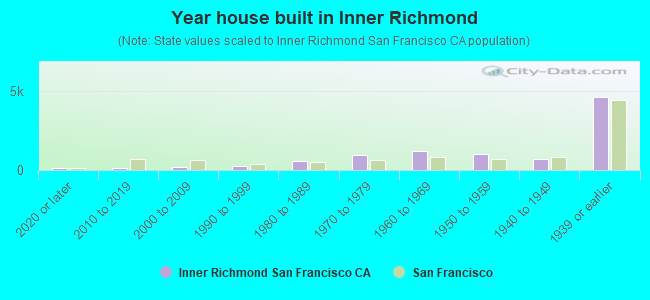
- Year house built in Inner Richmond
- 1382020 or later
- 1302010 to 2019
- 2122000 to 2009
- 2471990 to 1999
- 5521980 to 1989
- 9741970 to 1979
- 1,2161960 to 1969
- 1,0061950 to 1959
- 6861940 to 1949
- 4,6081939 or earlier
City-data.com crime index for city in 2020 (higher means more crime):
| City: | 387.4 |
| U.S. average: | 219.5 |
Travel time to work (commute)
![Travel time to work (commute)]()
- 92Less than 5 minutes
- 3305 to 9 minutes
- 64110 to 14 minutes
- 74815 to 19 minutes
- 83520 to 24 minutes
- 46725 to 29 minutes
- 1,19930 to 34 minutes
- 36335 to 39 minutes
- 48340 to 44 minutes
- 1,10845 to 59 minutes
- 1,15860 to 89 minutes
- 18590 or more minutes

Means of transportation to work
![Means of transportation to work]()
- 31.5%3,470Drove a car alone
- 8.8%967Carpooled
- 23.9%2,630Bus
- 1.4%159Subway or elevated rail
- 2.7%293Long-distance train or commuter rail
- 0.8%86Taxi
- 1.1%122Motorcycle
- 6.2%681Bicycle
- 5.1%557Walked
- 1.8%197Other means
- 25.3%2,794Worked at home

Time leaving home to go to work
![Time leaving home to go to work]()
- 11212:00 a.m. to 4:59 a.m.
- 475:00 a.m. to 5:29 a.m.
- 3595:30 a.m. to 5:59 a.m.
- 2526:00 a.m. to 6:29 a.m.
- 4016:30 a.m. to 6:59 a.m.
- 1,0027:00 a.m. to 7:29 a.m.
- 1,0677:30 a.m. to 7:59 a.m.
- 1,3758:00 a.m. to 8:29 a.m.
- 9818:30 a.m. to 8:59 a.m.
- 6959:00 a.m. to 9:59 a.m.
- 25910:00 a.m. to 10:59 a.m.
- 9311:00 a.m. to 11:59 a.m.
- 70212:00 p.m. to 3:59 p.m.
- 1714:00 p.m. to 11:59 p.m.

Occupations of males:
- Percentage of males in management occupations (except farmers):
Here: 21.4% city: 17.2%
- Percentage of males in business and financial operations occupations:
Here: 5.5% city: 8.9%
- Percentage of males in computer and mathematical occupations:
Here: 24.0% city: 14.6%
- Percentage of males in architecture and engineering occupations:
Here: 8.3% city: 4.0%
- Percentage of males in legal occupations:
Here: 1.8% city: 2.5%
- Percentage of males in education, training, and library occupations:
Here: 1.9% city: 3.4%
- Percentage of males in arts, design, entertainment, sports, and media occupations:
Here: 7.7% city: 4.9%
- Percentage of males in healthcare practitioners and technical occupations:
Here: 2.2% city: 3.2%
- Percentage of males in service occupations:
Here: 7.4% city: 11.8%
- Percentage of males in sales and office occupations:
Here: 7.3% city: 13.5%
- Percentage of males in construction, extraction, and maintenance occupations:
Here: 3.5% city: 3.1%
- Percentage of males in production occupations:
Here: 3.8% city: 2.5%
- Percentage of males in transportation occupations:
Here: 3.1% city: 3.4%
Occupations of females:
- Percentage of females in management occupations (except farmers):
Here: 16.1% city: 15.8%
- Percentage of females in business and financial operations occupations:
Here: 8.4% city: 11.5%
- Percentage of females in computer and mathematical occupations:
Here: 5.1% city: 5.1%
- Percentage of females in architecture and engineering occupations:
Here: 1.7% city: 1.6%
- Percentage of females in life, physical, and social science occupations:
Here: 1.9% city: 2.9%
- Percentage of females in community and social services occupations:
Here: 2.3% city: 1.6%
- Percentage of females in legal occupations:
Here: 3.9% city: 3.0%
- Percentage of females in education, training, and library occupations:
Here: 9.2% city: 7.1%
- Percentage of females in arts, design, entertainment, sports, and media occupations:
Here: 3.4% city: 5.1%
- Percentage of females in healthcare practitioners and technical occupations:
Here: 9.6% city: 8.4%
- Percentage of females in service occupations:
Here: 17.5% city: 15.4%
- Percentage of females in sales and office occupations:
Here: 20.1% city: 19.3%
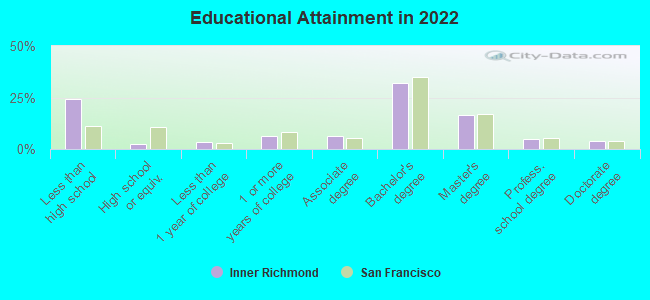
Education in this neighborhood (subdivision or community):
- Percentage of people 3 years and older in K-12 schools:
Inner Richmond: 15.9% San Francisco: 9.7%
- Percentage of people 3 years and older in undergraduate colleges:
Inner Richmond: 5.6% San Francisco: 4.8%
- Percentage of people 3 years and older in grad. or professional schools:
Inner Richmond: 4.9% San Francisco: 2.6%
- Percentage of students K-12 enrolled in private schools:
Inner Richmond: 60.7% San Francisco: 36.5%
Percentage of population below poverty level:
| Inner Richmond: | 6.0% |
| San Francisco: | 10.4% |
Median year owner moved in (as recorded in 2022):
Median year renter moved in (as recorded in 2022):
| Inner Richmond: | 2002 |
| San Francisco: | 2007 |
Median year renter moved in (as recorded in 2022):
| Inner Richmond: | 2013 |
| San Francisco: | 2019 |
Percentage of married-couple families with both working:
| Inner Richmond: | 119.6% |
| San Francisco: | 75.9% |
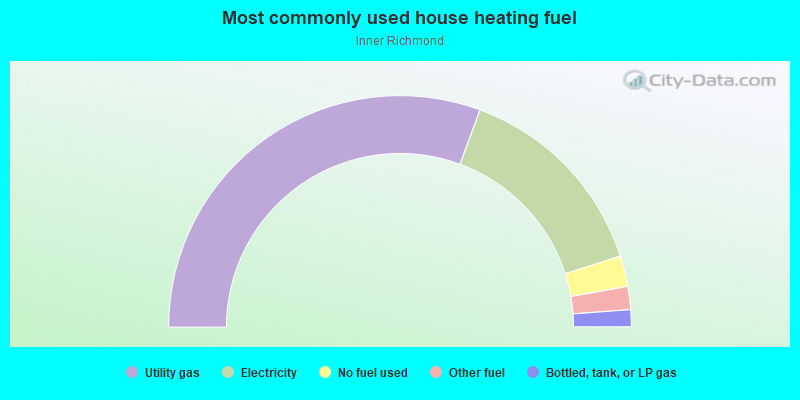
- 61.2%Utility gas
- 28.8%Electricity
- 4.3%No fuel used
- 3.2%Other fuel
- 2.4%Bottled, tank, or LP gas
Roads and streets:
Geary Blvd
Length: 1.68 miles
Directions: E-W, SE-NW, SW-NE
Address range: 3801 to 4899
Directions: E-W, SE-NW, SW-NE
Address range: 3801 to 4899
Fulton St
Length: 0.81 miles
Direction: E-W
Address range: 2600 to 3967
Direction: E-W
Address range: 2600 to 3967
Cabrillo St
Length: 0.81 miles
Direction: E-W
Address range: 100 to 1199
Direction: E-W
Address range: 100 to 1199
Balboa St
Length: 0.81 miles
Direction: E-W
Address range: 100 to 1199
Direction: E-W
Address range: 100 to 1199
Anza St
Length: 0.81 miles
Direction: E-W
Address range: 1100 to 2199
Direction: E-W
Address range: 1100 to 2199
Clement St
Length: 0.81 miles
Direction: E-W
Address range: 100 to 1199
Direction: E-W
Address range: 100 to 1199
8th Ave
Length: 0.65 miles
Direction: N-S
Address range: 300 to 799
Direction: N-S
Address range: 300 to 799
9th Ave
Length: 0.65 miles
Direction: N-S
Address range: 300 to 799
Direction: N-S
Address range: 300 to 799
10th Ave
Length: 0.65 miles
Direction: N-S
Address range: 300 to 799
Direction: N-S
Address range: 300 to 799
11th Ave
Length: 0.65 miles
Direction: N-S
Address range: 300 to 799
Direction: N-S
Address range: 300 to 799
12th Ave
Length: 0.65 miles
Direction: N-S
Address range: 300 to 799
Direction: N-S
Address range: 300 to 799
Funston Ave
Length: 0.65 miles
Direction: N-S
Address range: 300 to 799
Direction: N-S
Address range: 300 to 799
7th Ave
Length: 0.65 miles
Direction: N-S
Address range: 300 to 799
Direction: N-S
Address range: 300 to 799
6th Ave
Length: 0.64 miles
Direction: N-S
Address range: 300 to 799
Direction: N-S
Address range: 300 to 799
5th Ave
Length: 0.64 miles
Direction: N-S
Address range: 300 to 799
Direction: N-S
Address range: 300 to 799
4th Ave
Length: 0.63 miles
Direction: N-S
Address range: 300 to 799
Direction: N-S
Address range: 300 to 799
3rd Ave
Length: 0.63 miles
Direction: N-S
Address range: 300 to 799
Direction: N-S
Address range: 300 to 799
2nd Ave
Length: 0.62 miles
Direction: N-S
Address range: 300 to 799
Direction: N-S
Address range: 300 to 799