Clarendon Heights neighborhood in San Francisco, California (CA), 94114, 94117, 94131 detailed profile
Settings
X

Business Search - 14 Million verified businesses
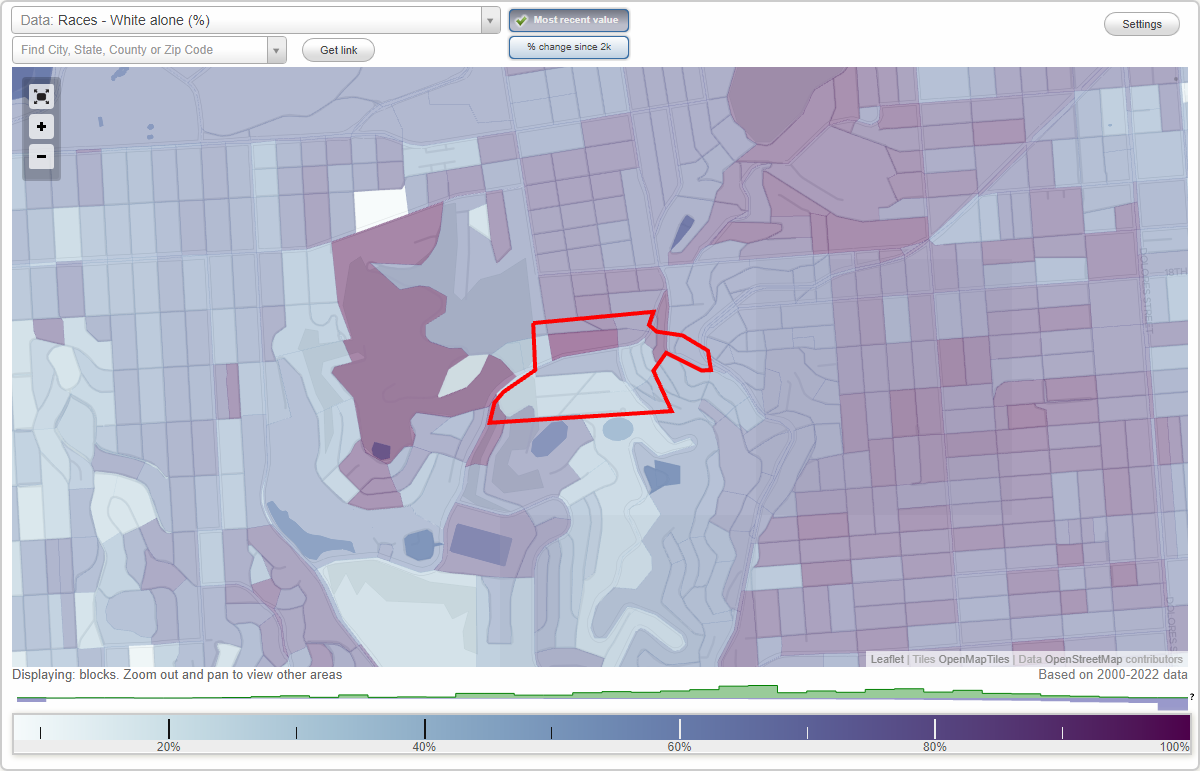
Area: 0.082 square miles
Population: 1,213
Population density:
| Clarendon Heights: | 14,707 people per square mile |
| San Francisco: | 17,313 people per square mile |

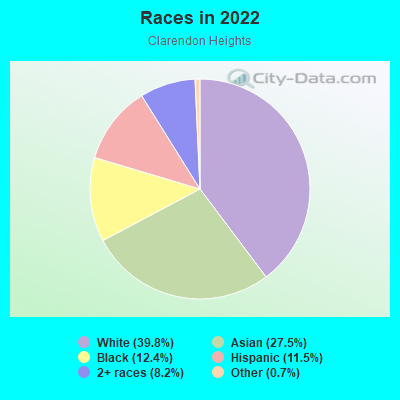
- 52639.8%White
- 36327.5%Asian
- 16412.4%Black
- 15211.5%Hispanic or Latino
- 1088.2%Two or more races
- 90.7%Some other race
Median household income in 2022:
| Clarendon Heights: | $194,610 |
| San Francisco: | $136,692 |
Distribution of median household income
![Distribution of median household income]()
- 212Less than $10,000
- 12$10,000 to $19,999
- 13$20,000 to $29,999
- 4$30,000 to $39,999
- 31$40,000 to $49,999
- 35$50,000 to $59,999
- 38$60,000 to $74,999
- 15$75,000 to $99,999
- 65$100,000 to $124,999
- 32$125,000 to $149,999
- 41$150,000 to $199,999
- 203$200,000 or more

Distribution of owner-occupied house/condo value
![Distribution of owner-occupied house/condo value]()
- 9Less than $50,000
- 16$100,000 to $149,999
- 10$150,000 to $199,999
- 10$300,000 to $399,999
- 4$400,000 to $499,999
- 21$750,000 to $999,999
- 111$1,000,000 or more

Distribution of rent paid by renters
![Distribution of rent paid by renters]()
- 13$300 to $399
- 3$700 to $799
- 4$900 to $999
- 55$1,500 to $1,999
- 639$2,000 or more

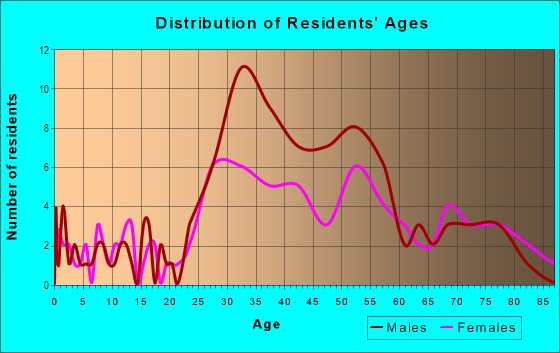
| Males: | 562 |
| Females: | 651 |
Males:
| This neighborhood: | 40.6 years |
| Whole city: | 40.3 years |
| This neighborhood: | 38.2 years |
| Whole city: | 40.5 years |
Average household size:
| Clarendon Heights: | 2.1 people |
| San Francisco: | 2.2 people |
Percentage of family households:
| Clarendon Heights: | 17.3% |
| San Francisco: | 30.3% |
| Here: | 21.5% |
| San Francisco: | 35.3% |
Percentage of married-couple families with children (among all households):
| Clarendon Heights: | 23.5% |
| San Francisco: | 35.9% |
Percentage of single-mother households (among all households):
| Clarendon Heights: | 18.1% |
| San Francisco: | 6.0% |
Percentage of never married males 15 years old and over:
Percentage of never married females 15 years old and over:
| Clarendon Heights: | 32.5% |
| San Francisco: | 24.6% |
Percentage of never married females 15 years old and over:
| Clarendon Heights: | 29.2% |
| city: | 19.9% |
Percentage of people that speak English not well or not at all:
| Clarendon Heights: | 2.9% |
| San Francisco: | 10.9% |
Percentage of people born in this state:
Percentage of people born in another U.S. state:
Percentage of native residents but born outside the U.S.:
Percentage of foreign born residents:
| Here: | 40.6% |
| San Francisco: | 40.8% |
Percentage of people born in another U.S. state:
| Clarendon Heights: | 32.8% |
| San Francisco: | 23.4% |
Percentage of native residents but born outside the U.S.:
| Here: | 1.2% |
| city: | 2.6% |
Percentage of foreign born residents:
| Here: | 25.4% |
| San Francisco: | 33.2% |
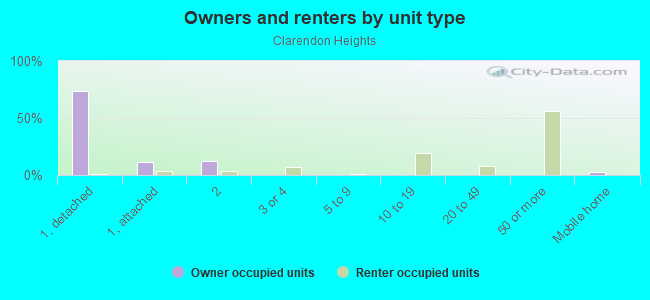
Owner-occupied
Renter-occupied

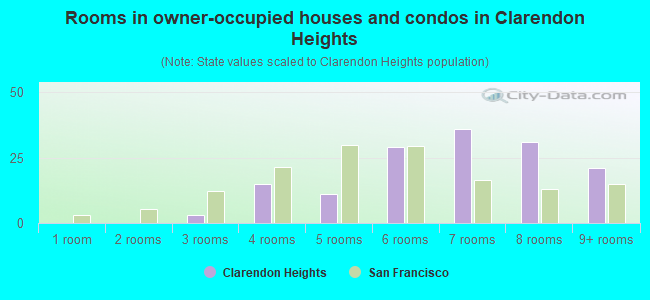
- Rooms in owner-occupied houses and condos in Clarendon Heights
- 01 room
- 02 rooms
- 33 rooms
- 154 rooms
- 115 rooms
- 296 rooms
- 367 rooms
- 318 rooms
- 219+ rooms
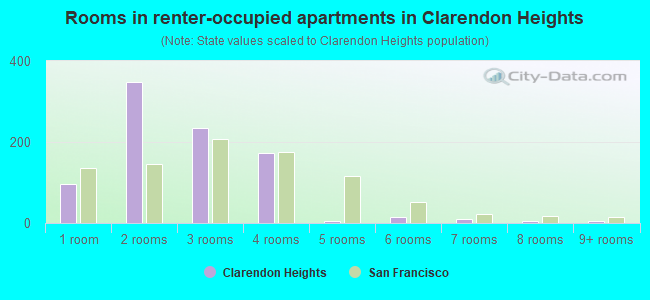
- Rooms in renter-occupied apartments in Clarendon Heights
- 971 room
- 3472 rooms
- 2353 rooms
- 1724 rooms
- 45 rooms
- 156 rooms
- 97 rooms
- 48 rooms
- 59+ rooms
Owner-occupied
Renter-occupied
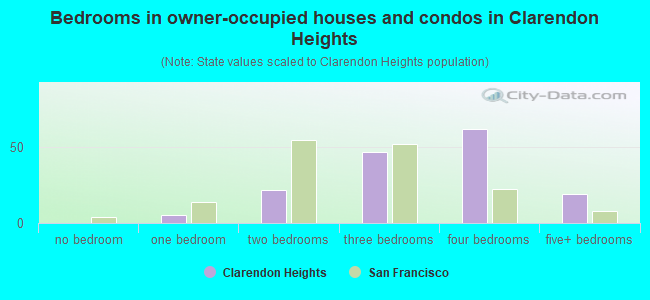
- Bedrooms in owner-occupied houses and condos in Clarendon Heights
- 0no bedroom
- 51 bedroom
- 222 bedrooms
- 473 bedrooms
- 624 bedrooms
- 195+ bedrooms
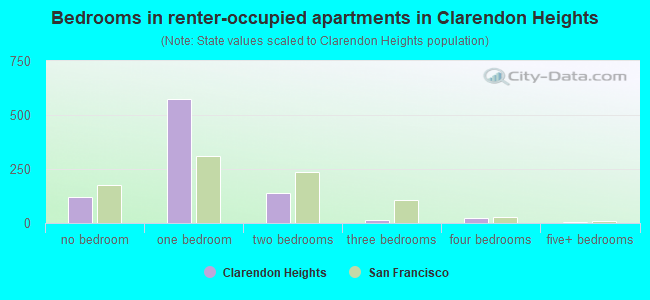
- Bedrooms in renter-occupied apartments in Clarendon Heights
- 121no bedroom
- 5741 bedroom
- 1382 bedrooms
- 123 bedrooms
- 214 bedrooms
- 35+ bedrooms
Average number of cars or other vehicles available in houses/condos:
Average number of cars or other vehicles available in apartments:
| This neighborhood: | 1.6 |
| San Francisco: | 1.5 |
Average number of cars or other vehicles available in apartments:
| Here: | 1.7 |
| city: | 0.8 |
Percentage of units with a mortgage:
| Clarendon Heights: | 54.2% |
| San Francisco: | 62.3% |
Housing prices:
- Average estimated value of detached houses in 2022 (23.3% of all units):
Clarendon Heights: $1,462,495 San Francisco: $1,942,973
- Average estimated value of townhouses or other attached units in 2022 (4.7% of all units):
This neighborhood: $1,515,688 city: $1,528,422
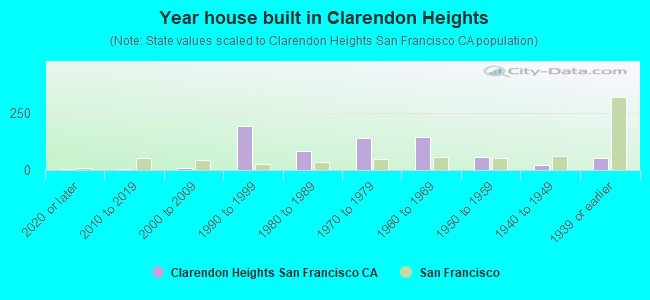
- Year house built in Clarendon Heights
- 42020 or later
- 32010 to 2019
- 112000 to 2009
- 1921990 to 1999
- 821980 to 1989
- 1391970 to 1979
- 1451960 to 1969
- 571950 to 1959
- 211940 to 1949
- 521939 or earlier
City-data.com crime index for city in 2020 (higher means more crime):
| City: | 387.4 |
| U.S. average: | 219.5 |
Travel time to work (commute)
![Travel time to work (commute)]()
- 3Less than 5 minutes
- 145 to 9 minutes
- 2710 to 14 minutes
- 2315 to 19 minutes
- 5420 to 24 minutes
- 2625 to 29 minutes
- 4930 to 34 minutes
- 1035 to 39 minutes
- 3040 to 44 minutes
- 3845 to 59 minutes
- 2860 to 89 minutes
- 1490 or more minutes

Means of transportation to work
![Means of transportation to work]()
- 22.0%152Drove a car alone
- 8.7%60Carpooled
- 9.5%66Bus
- 14.9%103Subway or elevated rail
- 2.3%16Long-distance train or commuter rail
- 2.5%17Light rail, streetcar or trolley
- 4.8%33Taxi
- 0.6%4Motorcycle
- 4.8%33Bicycle
- 47.3%327Walked
- 2.5%17Other means
- 26.3%182Worked at home

Time leaving home to go to work
![Time leaving home to go to work]()
- 612:00 a.m. to 4:59 a.m.
- 15:00 a.m. to 5:29 a.m.
- 35:30 a.m. to 5:59 a.m.
- 126:00 a.m. to 6:29 a.m.
- 256:30 a.m. to 6:59 a.m.
- 487:00 a.m. to 7:29 a.m.
- 357:30 a.m. to 7:59 a.m.
- 628:00 a.m. to 8:29 a.m.
- 298:30 a.m. to 8:59 a.m.
- 499:00 a.m. to 9:59 a.m.
- 1610:00 a.m. to 10:59 a.m.
- 1312:00 p.m. to 3:59 p.m.
- 94:00 p.m. to 11:59 p.m.

Occupations of males:
- Percentage of males in management occupations (except farmers):
Here: 14.4% city: 17.2%
- Percentage of males in business and financial operations occupations:
Here: 3.4% city: 8.9%
- Percentage of males in computer and mathematical occupations:
Here: 8.3% city: 14.6%
- Percentage of males in architecture and engineering occupations:
Here: 3.9% city: 4.0%
- Percentage of males in life, physical, and social science occupations:
Here: 18.1% city: 2.4%
- Percentage of males in community and social services occupations:
Here: 5.0% city: 1.0%
- Percentage of males in legal occupations:
Here: 7.7% city: 2.5%
- Percentage of males in education, training, and library occupations:
Here: 7.9% city: 3.4%
- Percentage of males in arts, design, entertainment, sports, and media occupations:
Here: 7.2% city: 4.9%
- Percentage of males in healthcare practitioners and technical occupations:
Here: 12.5% city: 3.2%
- Percentage of males in service occupations:
Here: 1.1% city: 11.8%
- Percentage of males in sales and office occupations:
Here: 6.1% city: 13.5%
- Percentage of males in material moving occupations:
Here: 1.1% city: 1.8%
Occupations of females:
- Percentage of females in management occupations (except farmers):
Here: 13.8% city: 15.8%
- Percentage of females in business and financial operations occupations:
Here: 4.7% city: 11.5%
- Percentage of females in computer and mathematical occupations:
Here: 1.9% city: 5.1%
- Percentage of females in architecture and engineering occupations:
Here: 5.0% city: 1.6%
- Percentage of females in life, physical, and social science occupations:
Here: 9.5% city: 2.9%
- Percentage of females in community and social services occupations:
Here: 2.2% city: 1.6%
- Percentage of females in education, training, and library occupations:
Here: 3.5% city: 7.1%
- Percentage of females in arts, design, entertainment, sports, and media occupations:
Here: 4.0% city: 5.1%
- Percentage of females in healthcare practitioners and technical occupations:
Here: 35.0% city: 8.4%
- Percentage of females in service occupations:
Here: 7.9% city: 15.4%
- Percentage of females in sales and office occupations:
Here: 9.7% city: 19.3%
- Percentage of females in production occupations:
Here: 1.1% city: 1.5%
- Percentage of females in material moving occupations:
Here: 1.0% city: 0.8%
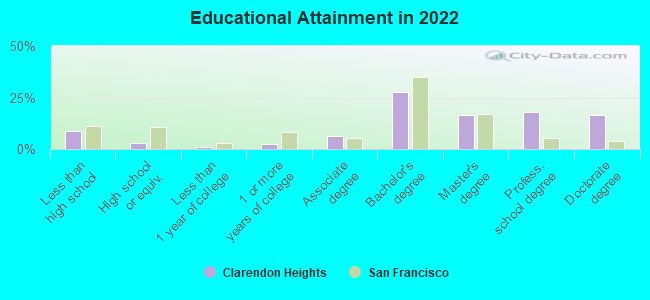
Education in this neighborhood (subdivision or community):
- Percentage of people 3 years and older in K-12 schools:
Clarendon Heights: 8.0% San Francisco: 9.7%
- Percentage of people 3 years and older in undergraduate colleges:
Clarendon Heights: 20.9% San Francisco: 4.8%
- Percentage of people 3 years and older in grad. or professional schools:
Clarendon Heights: 23.1% San Francisco: 2.6%
- Percentage of students K-12 enrolled in private schools:
Clarendon Heights: 53.1% San Francisco: 36.5%
Percentage of population below poverty level:
| Clarendon Heights: | 10.6% |
| San Francisco: | 10.4% |
Median year owner moved in (as recorded in 2022):
| Clarendon Heights: | 2003 |
| San Francisco: | 2007 |
Percentage of married-couple families with both working:
| Clarendon Heights: | 55.7% |
| San Francisco: | 75.9% |
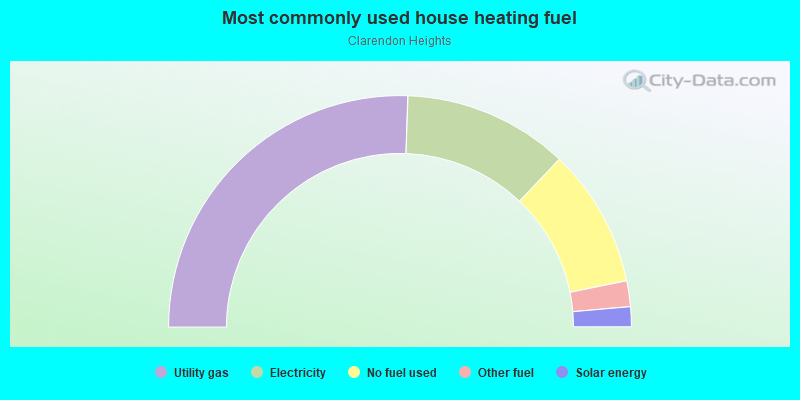
- 51.1%Utility gas
- 23.1%Electricity
- 19.4%No fuel used
- 3.6%Other fuel
- 2.8%Solar energy
Roads and streets:
Twin Peaks Blvd
Length: 0.38 miles
Directions: E-W, N-S, SE-NW, SW-NE
Address range: 100 to 399
Directions: E-W, N-S, SE-NW, SW-NE
Address range: 100 to 399
Palo Alto Ave
Length: 0.38 miles
Directions: E-W, SW-NE
Address range: 1 to 299
Directions: E-W, SW-NE
Address range: 1 to 299
St Germain Ave
Length: 0.28 miles
Direction: E-W
Address range: 1 to 199
Direction: E-W
Address range: 1 to 199
Mountain Spring Ave
Length: 0.28 miles
Directions: E-W, SE-NW
Address range: 1 to 199
Directions: E-W, SE-NW
Address range: 1 to 199
Belgrave Ave
Length: 0.26 miles
Direction: E-W
Address range: 1 to 299
Direction: E-W
Address range: 1 to 299
Clarendon Ave
Length: 0.20 miles
Direction: E-W
Address range: 1 to 98
Direction: E-W
Address range: 1 to 98
Glenbrook Ave
Length: 0.15 miles
Direction: SW-NE
Address range: 1 to 199
Direction: SW-NE
Address range: 1 to 199
Pemberton Pl
Length: 0.14 miles
Direction: SW-NE
Address range: 1 to 199
Direction: SW-NE
Address range: 1 to 199
Raccoon Dr
Length: 0.12 miles
Direction: SE-NW
Address range: 100 to 173
Direction: SE-NW
Address range: 100 to 173
la Avanzada St
Length: 0.11 miles
Directions: E-W, N-S, SE-NW, SW-NE
Address range: 63 to 99
Directions: E-W, N-S, SE-NW, SW-NE
Address range: 63 to 99
Clayton St
Length: 0.11 miles
Directions: E-W, SE-NW
Address range: 1401 to 1499
Directions: E-W, SE-NW
Address range: 1401 to 1499
Crown Ter
Length: 0.10 miles
Directions: N-S, SE-NW
Address range: 1 to 99
Directions: N-S, SE-NW
Address range: 1 to 99
Graystone Ter
Length: 0.10 miles
Directions: N-S, SE-NW, SW-NE
Address range: 1 to 99
Directions: N-S, SE-NW, SW-NE
Address range: 1 to 99
Stanyan St
Length: 0.10 miles
Direction: N-S
Address range: 1400 to 1499
Direction: N-S
Address range: 1400 to 1499
Crown Ct
Length: 0.05 miles
Directions: N-S, SE-NW
Address range: 100 to 199
Directions: N-S, SE-NW
Address range: 100 to 199
Villa Ter
Length: 0.04 miles
Directions: N-S, SE-NW, SW-NE
Address range: 67 to 99
Directions: N-S, SE-NW, SW-NE
Address range: 67 to 99
Bigler Ave
Length: 0.04 miles
Direction: N-S
Address range: 100 to 199
Direction: N-S
Address range: 100 to 199