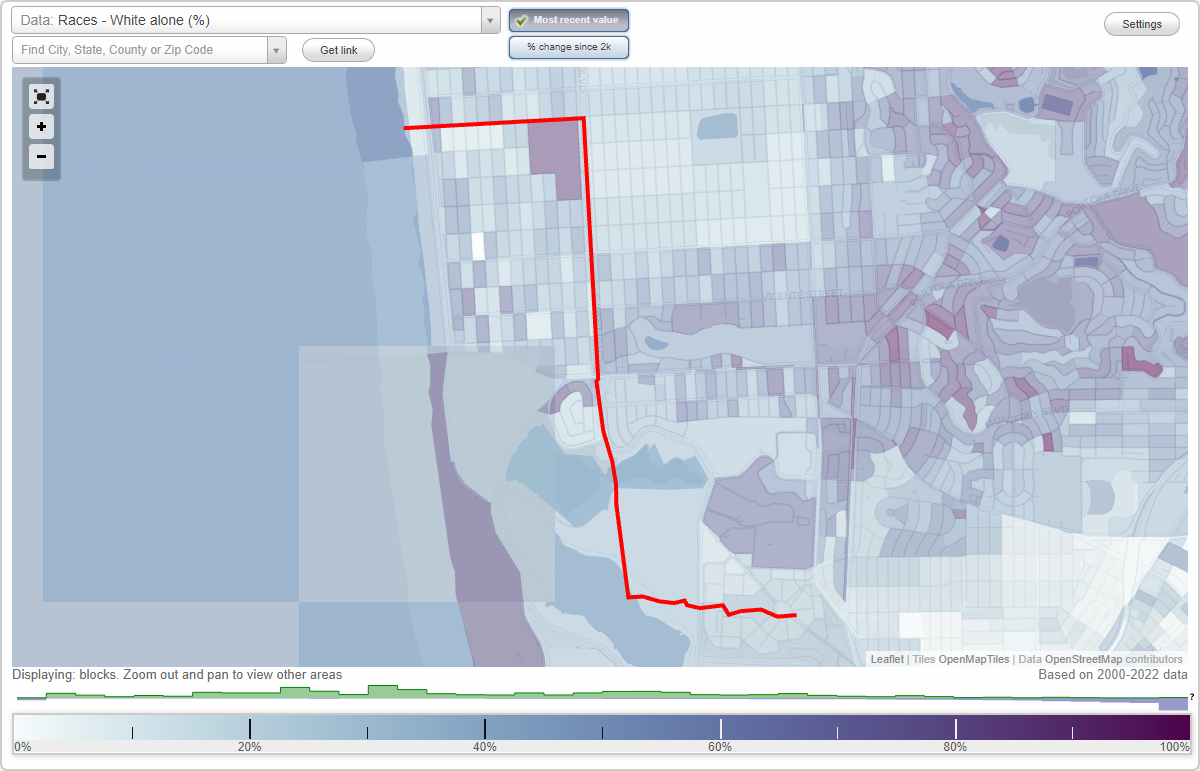
Outer Parkside neighborhood in San Francisco, California (CA), 94116 detailed profile
Settings
X

Business Search - 14 Million verified businesses
Area: 0.919 square miles
Population: 12,995
Population density:
| Outer Parkside: | 14,141 people per square mile |
| San Francisco: | 17,313 people per square mile |

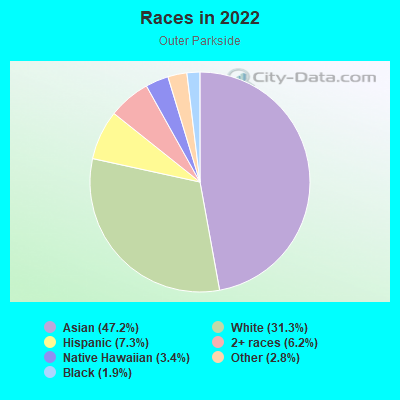
- 6,78747.2%Asian
- 4,49931.3%White
- 1,0477.3%Hispanic or Latino
- 8976.2%Two or more races
- 4863.4%Native Hawaiian and Other
Pacific Islander - 3972.8%Some other race
- 2791.9%Black
- 20.01%American Indian
Distribution of median household income
![Distribution of median household income]()
- 277Less than $10,000
- 1,346$10,000 to $19,999
- 317$20,000 to $29,999
- 416$30,000 to $39,999
- 622$40,000 to $49,999
- 343$50,000 to $59,999
- 312$60,000 to $74,999
- 412$75,000 to $99,999
- 394$100,000 to $124,999
- 481$125,000 to $149,999
- 788$150,000 to $199,999
- 1,564$200,000 or more

Distribution of owner-occupied house/condo value
![Distribution of owner-occupied house/condo value]()
- 511Less than $50,000
- 4$50,000 to $99,999
- 794$100,000 to $149,999
- 42$150,000 to $199,999
- 3$250,000 to $299,999
- 284$300,000 to $399,999
- 188$400,000 to $499,999
- 308$500,000 to $749,999
- 421$750,000 to $999,999
- 3,102$1,000,000 or more

Distribution of rent paid by renters
![Distribution of rent paid by renters]()
- 300$200 to $299
- 2$300 to $399
- 2$500 to $599
- 5$600 to $699
- 210$900 to $999
- 571$1,000 to $1,249
- 153$1,250 to $1,499
- 696$1,500 to $1,999
- 1,545$2,000 or more

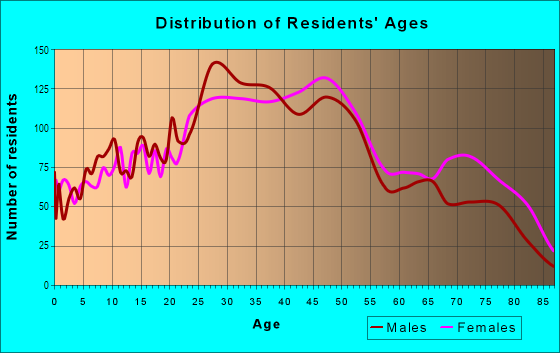
| Males: | 6,655 |
| Females: | 6,339 |
Males:
| This neighborhood: | 41.0 years |
| Whole city: | 40.3 years |
| This neighborhood: | 43.3 years |
| Whole city: | 40.5 years |
Average household size:
| Outer Parkside: | 2.6 people |
| San Francisco: | 2.2 people |
Percentage of family households:
| Outer Parkside: | 39.6% |
| San Francisco: | 30.3% |
| Here: | 51.9% |
| San Francisco: | 35.3% |
Percentage of married-couple families with children (among all households):
| Outer Parkside: | 32.5% |
| San Francisco: | 35.9% |
Percentage of single-mother households (among all households):
| Outer Parkside: | 7.3% |
| San Francisco: | 6.0% |
Percentage of never married males 15 years old and over:
Percentage of never married females 15 years old and over:
| Outer Parkside: | 20.3% |
| San Francisco: | 24.6% |
Percentage of never married females 15 years old and over:
| Outer Parkside: | 14.8% |
| city: | 19.9% |
Percentage of people that speak English not well or not at all:
| Outer Parkside: | 13.1% |
| San Francisco: | 10.9% |
Percentage of people born in this state:
Percentage of people born in another U.S. state:
Percentage of native residents but born outside the U.S.:
Percentage of foreign born residents:
| Here: | 44.0% |
| San Francisco: | 40.8% |
Percentage of people born in another U.S. state:
| Outer Parkside: | 13.4% |
| San Francisco: | 23.4% |
Percentage of native residents but born outside the U.S.:
| Here: | 0.8% |
| city: | 2.6% |
Percentage of foreign born residents:
| Here: | 41.7% |
| San Francisco: | 33.2% |
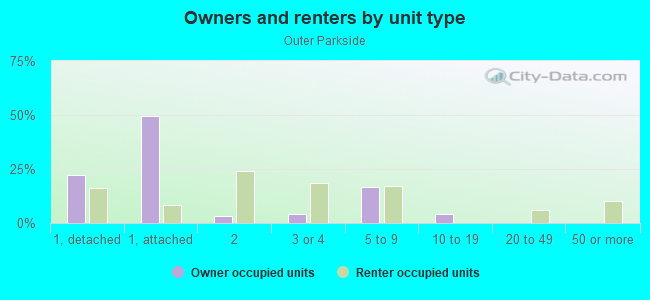
Owner-occupied
Renter-occupied

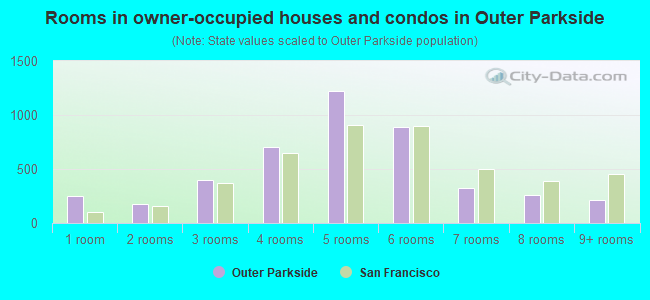
- Rooms in owner-occupied houses and condos in Outer Parkside
- 2471 room
- 1742 rooms
- 4023 rooms
- 7074 rooms
- 1,2215 rooms
- 8866 rooms
- 3287 rooms
- 2598 rooms
- 2099+ rooms
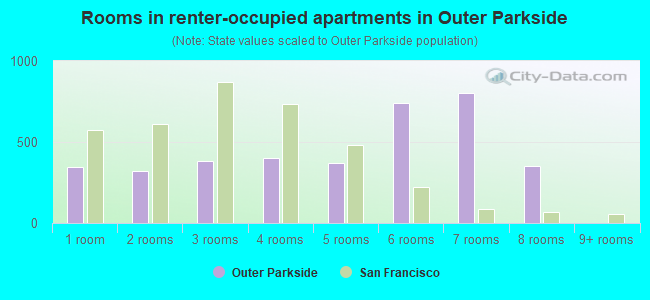
- Rooms in renter-occupied apartments in Outer Parkside
- 3461 room
- 3232 rooms
- 3843 rooms
- 4014 rooms
- 3685 rooms
- 7396 rooms
- 8007 rooms
- 3508 rooms
- 09+ rooms
Owner-occupied
Renter-occupied
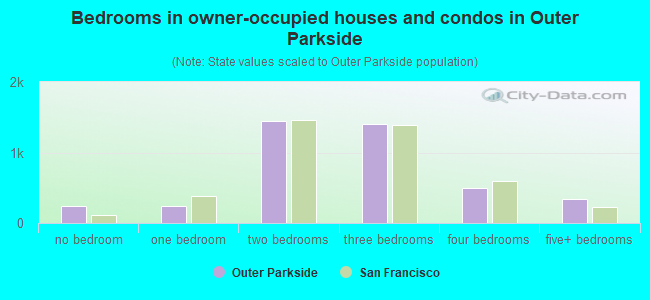
- Bedrooms in owner-occupied houses and condos in Outer Parkside
- 247no bedroom
- 2351 bedroom
- 1,4402 bedrooms
- 1,3993 bedrooms
- 4924 bedrooms
- 3385+ bedrooms
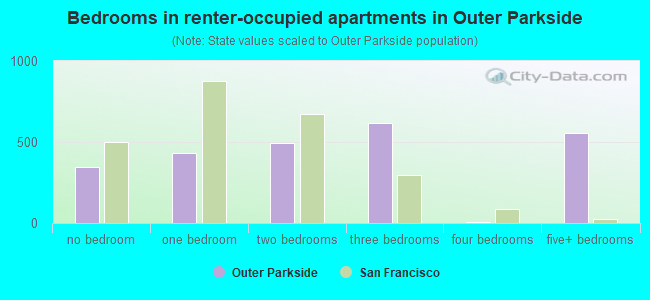
- Bedrooms in renter-occupied apartments in Outer Parkside
- 346no bedroom
- 4351 bedroom
- 4912 bedrooms
- 6153 bedrooms
- 64 bedrooms
- 5575+ bedrooms
Average number of cars or other vehicles available in houses/condos:
Average number of cars or other vehicles available in apartments:
| This neighborhood: | |
| San Francisco: |
Average number of cars or other vehicles available in apartments:
| Here: | 1.8 |
| city: | 0.8 |
Percentage of units with a mortgage:
| Outer Parkside: | 59.9% |
| San Francisco: | 62.3% |
Housing prices:
- Average estimated value of detached houses in 2022 (30.7% of all units):
Outer Parkside: $1,179,723 San Francisco: $1,942,973
- Average estimated value of townhouses or other attached units in 2022 (52.2% of all units):
This neighborhood: $1,232,186 city: $1,528,422
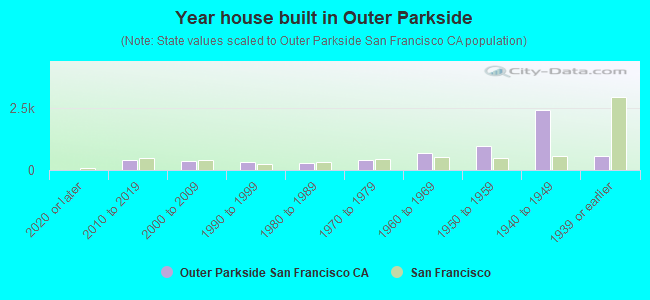
- Year house built in Outer Parkside
- 02020 or later
- 3952010 to 2019
- 3752000 to 2009
- 3181990 to 1999
- 2911980 to 1989
- 4021970 to 1979
- 6891960 to 1969
- 9841950 to 1959
- 2,4261940 to 1949
- 5711939 or earlier
City-data.com crime index for city in 2020 (higher means more crime):
| City: | 387.4 |
| U.S. average: | 219.5 |
Travel time to work (commute)
![Travel time to work (commute)]()
- 46Less than 5 minutes
- 895 to 9 minutes
- 17710 to 14 minutes
- 23815 to 19 minutes
- 41220 to 24 minutes
- 51425 to 29 minutes
- 84830 to 34 minutes
- 15935 to 39 minutes
- 46040 to 44 minutes
- 1,08945 to 59 minutes
- 67460 to 89 minutes
- 27990 or more minutes

Means of transportation to work
![Means of transportation to work]()
- 43.4%2,915Drove a car alone
- 10.0%671Carpooled
- 11.6%779Bus
- 4.7%317Subway or elevated rail
- 0.0%2Long-distance train or commuter rail
- 12.6%846Light rail, streetcar or trolley
- 0.1%6Taxi
- 0.0%2Motorcycle
- 7.7%518Bicycle
- 3.3%222Walked
- 5.2%352Other means
- 20.3%1,364Worked at home

Time leaving home to go to work
![Time leaving home to go to work]()
- 5512:00 a.m. to 4:59 a.m.
- 2095:00 a.m. to 5:29 a.m.
- 685:30 a.m. to 5:59 a.m.
- 2876:00 a.m. to 6:29 a.m.
- 3176:30 a.m. to 6:59 a.m.
- 9337:00 a.m. to 7:29 a.m.
- 6557:30 a.m. to 7:59 a.m.
- 6048:00 a.m. to 8:29 a.m.
- 6498:30 a.m. to 8:59 a.m.
- 5889:00 a.m. to 9:59 a.m.
- 6910:00 a.m. to 10:59 a.m.
- 6811:00 a.m. to 11:59 a.m.
- 31812:00 p.m. to 3:59 p.m.
- 334:00 p.m. to 11:59 p.m.

Occupations of males:
- Percentage of males in management occupations (except farmers):
Here: 14.2% city: 17.2%
- Percentage of males in business and financial operations occupations:
Here: 2.5% city: 8.9%
- Percentage of males in computer and mathematical occupations:
Here: 11.1% city: 14.6%
- Percentage of males in architecture and engineering occupations:
Here: 6.7% city: 4.0%
- Percentage of males in life, physical, and social science occupations:
Here: 3.0% city: 2.4%
- Percentage of males in education, training, and library occupations:
Here: 4.1% city: 3.4%
- Percentage of males in arts, design, entertainment, sports, and media occupations:
Here: 7.0% city: 4.9%
- Percentage of males in healthcare practitioners and technical occupations:
Here: 2.8% city: 3.2%
- Percentage of males in service occupations:
Here: 12.5% city: 11.8%
- Percentage of males in sales and office occupations:
Here: 18.6% city: 13.5%
- Percentage of males in construction, extraction, and maintenance occupations:
Here: 1.5% city: 3.1%
- Percentage of males in production occupations:
Here: 2.3% city: 2.5%
- Percentage of males in transportation occupations:
Here: 7.5% city: 3.4%
- Percentage of males in material moving occupations:
Here: 2.5% city: 1.8%
Occupations of females:
- Percentage of females in management occupations (except farmers):
Here: 8.3% city: 15.8%
- Percentage of females in business and financial operations occupations:
Here: 8.2% city: 11.5%
- Percentage of females in computer and mathematical occupations:
Here: 4.2% city: 5.1%
- Percentage of females in architecture and engineering occupations:
Here: 2.6% city: 1.6%
- Percentage of females in life, physical, and social science occupations:
Here: 1.9% city: 2.9%
- Percentage of females in community and social services occupations:
Here: 1.4% city: 1.6%
- Percentage of females in education, training, and library occupations:
Here: 12.4% city: 7.1%
- Percentage of females in healthcare practitioners and technical occupations:
Here: 11.3% city: 8.4%
- Percentage of females in service occupations:
Here: 23.6% city: 15.4%
- Percentage of females in sales and office occupations:
Here: 19.4% city: 19.3%
- Percentage of females in production occupations:
Here: 4.0% city: 1.5%
- Percentage of females in material moving occupations:
Here: 2.0% city: 0.8%
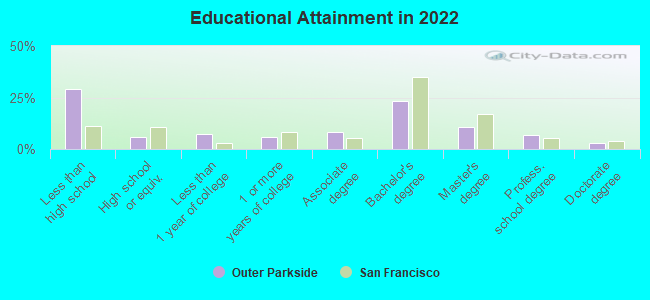
Education in this neighborhood (subdivision or community):
- Percentage of people 3 years and older in K-12 schools:
Outer Parkside: 17.6% San Francisco: 9.7%
- Percentage of people 3 years and older in undergraduate colleges:
Outer Parkside: 6.3% San Francisco: 4.8%
- Percentage of people 3 years and older in grad. or professional schools:
Outer Parkside: 8.0% San Francisco: 2.6%
- Percentage of students K-12 enrolled in private schools:
Outer Parkside: 68.0% San Francisco: 36.5%
Percentage of population below poverty level:
| Outer Parkside: | 6.5% |
| San Francisco: | 10.4% |
Percentage of married-couple families with both working:
| Outer Parkside: | 123.0% |
| San Francisco: | 75.9% |
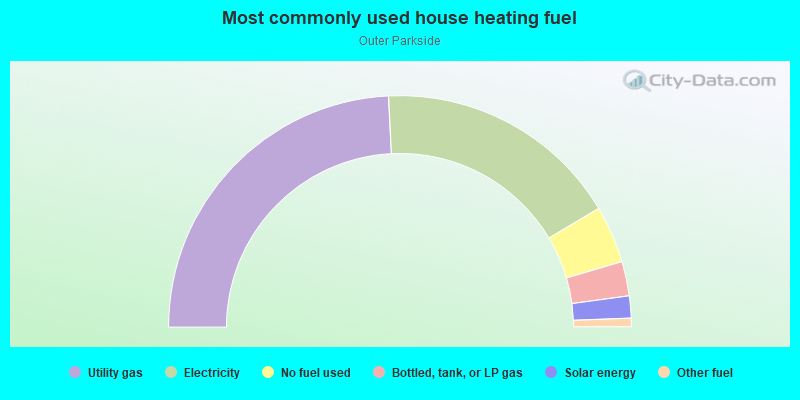
- 48.4%Utility gas
- 34.4%Electricity
- 8.0%No fuel used
- 4.8%Bottled, tank, or LP gas
- 3.1%Solar energy
- 1.2%Other fuel
Roads and streets:
Sunset Blvd
Length: 2.16 miles
Directions: N-S, SE-NW, SW-NE
Address range: 2001 to 2799
Directions: N-S, SE-NW, SW-NE
Address range: 2001 to 2799
Great Hwy
Length: 1.88 miles
Directions: N-S, SE-NW, SW-NE
Address range: 2000 to 2899
Directions: N-S, SE-NW, SW-NE
Address range: 2000 to 2899
Sloat Blvd
Length: 1.43 miles
Directions: E-W, N-S, SE-NW, SW-NE
Address range: 1851 to 2323
Directions: E-W, N-S, SE-NW, SW-NE
Address range: 1851 to 2323
37th Ave
Length: 1.09 miles
Direction: N-S
Address range: 2000 to 2899
Direction: N-S
Address range: 2000 to 2899
42nd Ave
Length: 1.01 miles
Directions: N-S, SW-NE
Address range: 2000 to 2799
Directions: N-S, SW-NE
Address range: 2000 to 2799
43rd Ave
Length: 0.98 miles
Directions: N-S, SW-NE
Address range: 2000 to 2799
Directions: N-S, SW-NE
Address range: 2000 to 2799
39th Ave
Length: 0.96 miles
Directions: N-S, SW-NE
Address range: 2100 to 2899
Directions: N-S, SW-NE
Address range: 2100 to 2899
45th Ave
Length: 0.95 miles
Direction: N-S
Address range: 2000 to 2799
Direction: N-S
Address range: 2000 to 2799
44th Ave
Length: 0.95 miles
Direction: N-S
Address range: 2000 to 2799
Direction: N-S
Address range: 2000 to 2799
47th Ave
Length: 0.95 miles
Direction: N-S
Address range: 2000 to 2799
Direction: N-S
Address range: 2000 to 2799
46th Ave
Length: 0.95 miles
Direction: N-S
Address range: 2000 to 2799
Direction: N-S
Address range: 2000 to 2799
Upper Great Hwy
Length: 0.94 miles
Directions: N-S, SE-NW
Directions: N-S, SE-NW
41st Ave
Length: 0.91 miles
Directions: N-S, SW-NE
Address range: 1966 to 2799
Directions: N-S, SW-NE
Address range: 1966 to 2799
40th Ave
Length: 0.90 miles
Direction: N-S
Address range: 2100 to 2799
Direction: N-S
Address range: 2100 to 2799
Rivera St
Length: 0.88 miles
Direction: E-W
Address range: 2650 to 3899
Direction: E-W
Address range: 2650 to 3899
Santiago St
Length: 0.87 miles
Direction: E-W
Address range: 2550 to 3799
Direction: E-W
Address range: 2550 to 3799
Taraval St
Length: 0.86 miles
Direction: E-W
Address range: 2650 to 3899
Direction: E-W
Address range: 2650 to 3899
Ulloa St
Length: 0.85 miles
Direction: E-W
Address range: 3550 to 4699
Direction: E-W
Address range: 3550 to 4699
Vicente St
Length: 0.85 miles
Direction: E-W
Address range: 2550 to 3699
Direction: E-W
Address range: 2550 to 3699
Wawona St
Length: 0.84 miles
Direction: E-W
Address range: 2550 to 3699
Direction: E-W
Address range: 2550 to 3699
38th Ave
Length: 0.77 miles
Direction: N-S
Address range: 2200 to 2799
Direction: N-S
Address range: 2200 to 2799
Quintara St
Length: 0.74 miles
Direction: E-W
Address range: 2750 to 3999
Direction: E-W
Address range: 2750 to 3999
48th Ave
Length: 0.65 miles
Directions: N-S, SE-NW, SW-NE
Address range: 2000 to 2499
Directions: N-S, SE-NW, SW-NE
Address range: 2000 to 2499
Pacheco St
Length: 0.60 miles
Direction: E-W
Address range: 3250 to 4499
Direction: E-W
Address range: 3250 to 4499
Sloat Ave (Sloat Blvd)
Length: 0.48 miles
Directions: E-W, SE-NW, SW-NE
Directions: E-W, SE-NW, SW-NE
Yorba St
Length: 0.35 miles
Directions: E-W, SW-NE
Address range: 2550 to 2999
Directions: E-W, SW-NE
Address range: 2550 to 2999
Cutler Ave
Length: 0.07 miles
Direction: E-W
Address range: 1 to 56
Direction: E-W
Address range: 1 to 56
Yorba Ln
Length: 0.02 miles
Direction: SW-NE
Address range: 1 to 99
Direction: SW-NE
Address range: 1 to 99