Lower Pacific Heights neighborhood in San Francisco, California (CA), 94109, 94115 detailed profile
Settings
X

Business Search - 14 Million verified businesses
Area: 0.351 square miles
Population: 8,765
Population density:
| Lower Pacific Heights: | 24,975 people per square mile |
| San Francisco: | 17,313 people per square mile |

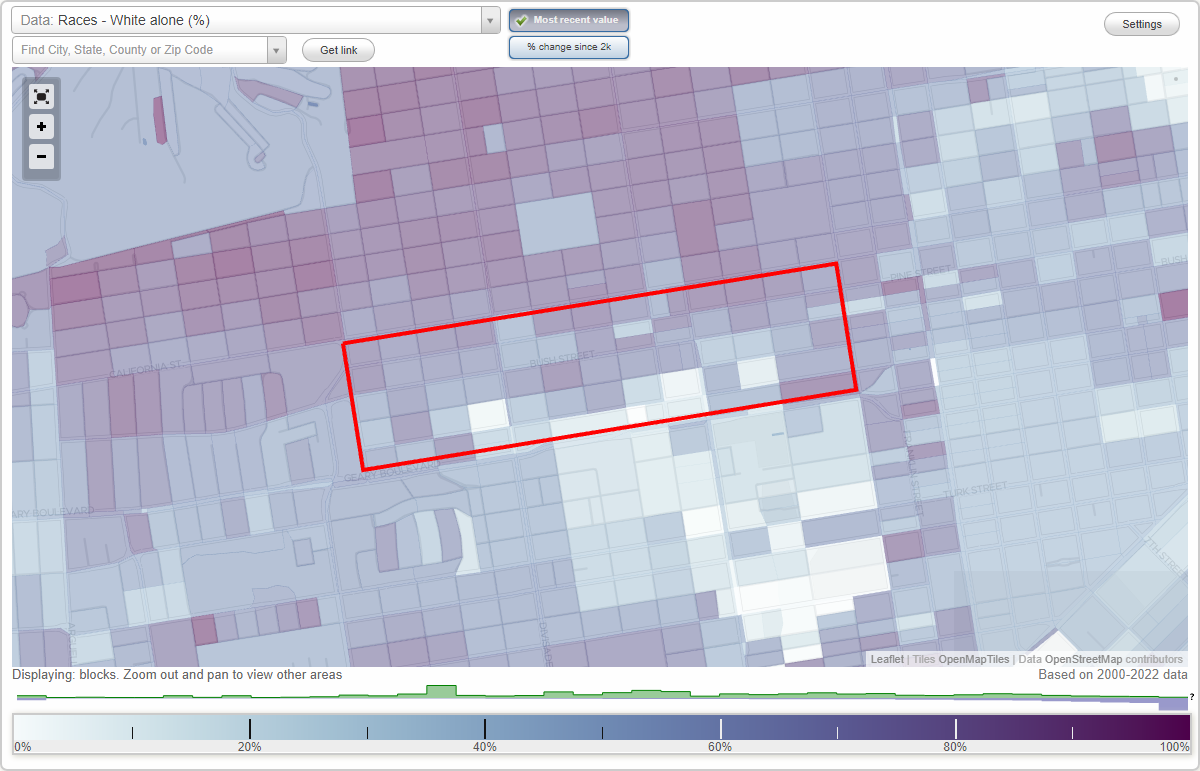
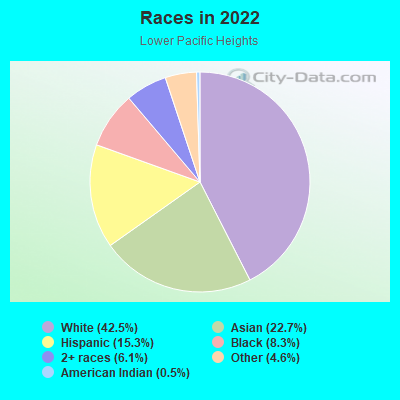
- 3,98442.5%White
- 2,12522.7%Asian
- 1,43615.3%Hispanic or Latino
- 7818.3%Black
- 5736.1%Two or more races
- 4314.6%Some other race
- 500.5%American Indian
Distribution of median household income
![Distribution of median household income]()
- 410Less than $10,000
- 1,016$10,000 to $19,999
- 844$20,000 to $29,999
- 503$30,000 to $39,999
- 295$40,000 to $49,999
- 77$50,000 to $59,999
- 170$60,000 to $74,999
- 316$75,000 to $99,999
- 298$100,000 to $124,999
- 302$125,000 to $149,999
- 732$150,000 to $199,999
- 1,428$200,000 or more

Distribution of owner-occupied house/condo value
![Distribution of owner-occupied house/condo value]()
- 249$300,000 to $399,999
- 63$500,000 to $749,999
- 110$750,000 to $999,999
- 984$1,000,000 or more

Distribution of rent paid by renters
![Distribution of rent paid by renters]()
- 509$100 to $199
- 1,374$200 to $299
- 678$300 to $399
- 309$400 to $499
- 481$500 to $599
- 201$1,000 to $1,249
- 134$1,250 to $1,499
- 705$1,500 to $1,999
- 2,122$2,000 or more

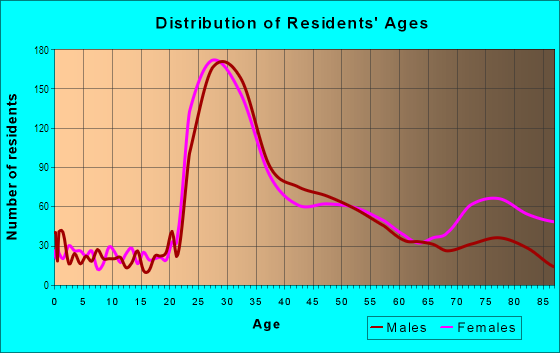
| Males: | 4,513 |
| Females: | 4,251 |
Males:
| This neighborhood: | 42.5 years |
| Whole city: | 40.3 years |
| This neighborhood: | 50.5 years |
| Whole city: | 40.5 years |
Average household size:
| Lower Pacific Heights: | 6.3 people |
| San Francisco: | 2.2 people |
Percentage of family households:
| Lower Pacific Heights: | 14.7% |
| San Francisco: | 30.3% |
| Here: | 17.7% |
| San Francisco: | 35.3% |
Percentage of married-couple families with children (among all households):
| Lower Pacific Heights: | 36.5% |
| San Francisco: | 35.9% |
Percentage of single-mother households (among all households):
| Lower Pacific Heights: | 40.5% |
| San Francisco: | 6.0% |
Percentage of never married males 15 years old and over:
Percentage of never married females 15 years old and over:
| Lower Pacific Heights: | 29.2% |
| San Francisco: | 24.6% |
Percentage of never married females 15 years old and over:
| Lower Pacific Heights: | 22.2% |
| city: | 19.9% |
Percentage of people that speak English not well or not at all:
| Lower Pacific Heights: | 10.6% |
| San Francisco: | 10.9% |
Percentage of people born in this state:
Percentage of people born in another U.S. state:
Percentage of native residents but born outside the U.S.:
Percentage of foreign born residents:
| Here: | 31.7% |
| San Francisco: | 40.8% |
Percentage of people born in another U.S. state:
| Lower Pacific Heights: | 34.4% |
| San Francisco: | 23.4% |
Percentage of native residents but born outside the U.S.:
| Here: | 4.4% |
| city: | 2.6% |
Percentage of foreign born residents:
| Here: | 29.5% |
| San Francisco: | 33.2% |
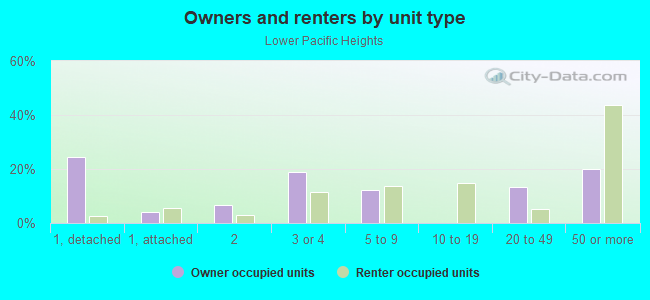
Owner-occupied
Renter-occupied

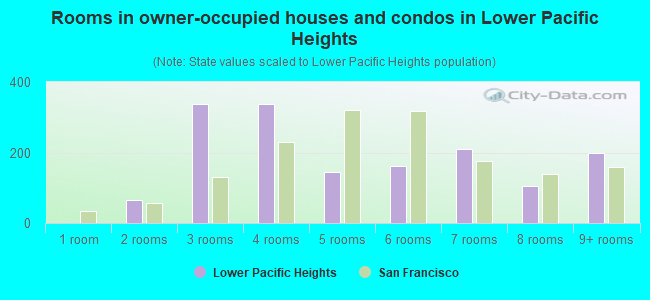
- Rooms in owner-occupied houses and condos in Lower Pacific Heights
- 01 room
- 642 rooms
- 3393 rooms
- 3394 rooms
- 1445 rooms
- 1636 rooms
- 2117 rooms
- 1048 rooms
- 1989+ rooms
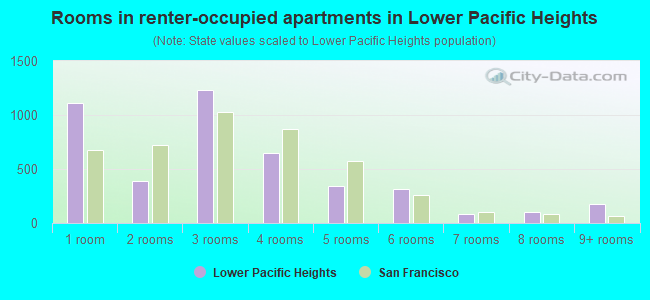
- Rooms in renter-occupied apartments in Lower Pacific Heights
- 1,1111 room
- 3932 rooms
- 1,2313 rooms
- 6474 rooms
- 3395 rooms
- 3136 rooms
- 877 rooms
- 1018 rooms
- 1759+ rooms
Owner-occupied
Renter-occupied
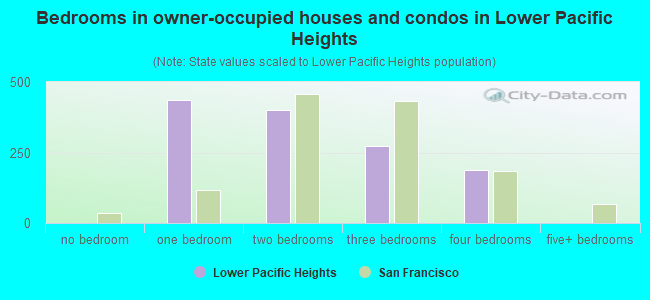
- Bedrooms in owner-occupied houses and condos in Lower Pacific Heights
- 0no bedroom
- 4351 bedroom
- 4002 bedrooms
- 2743 bedrooms
- 1894 bedrooms
- 05+ bedrooms
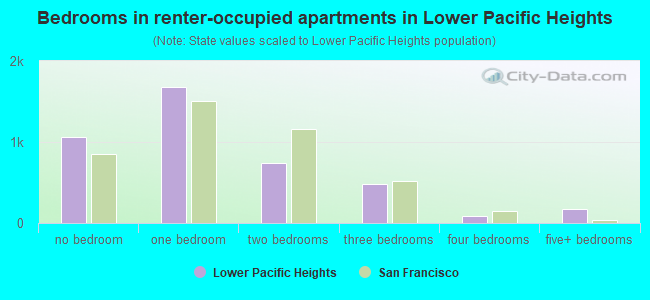
- Bedrooms in renter-occupied apartments in Lower Pacific Heights
- 1,060no bedroom
- 1,6831 bedroom
- 7442 bedrooms
- 4773 bedrooms
- 874 bedrooms
- 1755+ bedrooms
Average number of cars or other vehicles available in houses/condos:
Average number of cars or other vehicles available in apartments:
| This neighborhood: | 1.4 |
| San Francisco: | 1.5 |
Average number of cars or other vehicles available in apartments:
| Here: | 0.7 |
| city: | 0.8 |
Percentage of units with a mortgage:
| Lower Pacific Heights: | 70.1% |
| San Francisco: | 62.3% |
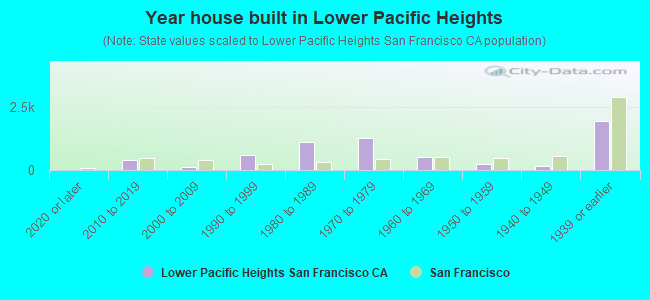
- Year house built in Lower Pacific Heights
- 02020 or later
- 3792010 to 2019
- 1372000 to 2009
- 5881990 to 1999
- 1,0951980 to 1989
- 1,2681970 to 1979
- 5241960 to 1969
- 2301950 to 1959
- 1561940 to 1949
- 1,9331939 or earlier
City-data.com crime index for city in 2020 (higher means more crime):
| City: | 387.4 |
| U.S. average: | 219.5 |
Travel time to work (commute)
![Travel time to work (commute)]()
- 320Less than 5 minutes
- 2355 to 9 minutes
- 16410 to 14 minutes
- 17615 to 19 minutes
- 42120 to 24 minutes
- 42225 to 29 minutes
- 75630 to 34 minutes
- 5935 to 39 minutes
- 21540 to 44 minutes
- 45645 to 59 minutes
- 33260 to 89 minutes
- 19390 or more minutes

Means of transportation to work
![Means of transportation to work]()
- 20.4%964Drove a car alone
- 4.3%204Carpooled
- 19.9%940Bus
- 13.8%650Subway or elevated rail
- 6.2%295Long-distance train or commuter rail
- 1.1%50Light rail, streetcar or trolley
- 3.5%164Taxi
- 2.8%130Bicycle
- 10.1%477Walked
- 9.2%436Other means
- 33.6%1,587Worked at home

Time leaving home to go to work
![Time leaving home to go to work]()
- 2906:00 a.m. to 6:29 a.m.
- 1846:30 a.m. to 6:59 a.m.
- 5207:00 a.m. to 7:29 a.m.
- 4807:30 a.m. to 7:59 a.m.
- 1,0188:00 a.m. to 8:29 a.m.
- 5068:30 a.m. to 8:59 a.m.
- 2629:00 a.m. to 9:59 a.m.
- 14010:00 a.m. to 10:59 a.m.
- 14112:00 p.m. to 3:59 p.m.
- 1074:00 p.m. to 11:59 p.m.

Occupations of males:
- Percentage of males in management occupations (except farmers):
Here: 20.3% city: 17.2%
- Percentage of males in business and financial operations occupations:
Here: 17.1% city: 8.9%
- Percentage of males in computer and mathematical occupations:
Here: 12.8% city: 14.6%
- Percentage of males in architecture and engineering occupations:
Here: 3.1% city: 4.0%
- Percentage of males in life, physical, and social science occupations:
Here: 1.2% city: 2.4%
- Percentage of males in community and social services occupations:
Here: 1.6% city: 1.0%
- Percentage of males in education, training, and library occupations:
Here: 1.3% city: 3.4%
- Percentage of males in arts, design, entertainment, sports, and media occupations:
Here: 14.7% city: 4.9%
- Percentage of males in healthcare practitioners and technical occupations:
Here: 1.9% city: 3.2%
- Percentage of males in service occupations:
Here: 3.5% city: 11.8%
- Percentage of males in sales and office occupations:
Here: 14.6% city: 13.5%
- Percentage of males in construction, extraction, and maintenance occupations:
Here: 2.8% city: 3.1%
- Percentage of males in production occupations:
Here: 1.3% city: 2.5%
- Percentage of males in transportation occupations:
Here: 3.0% city: 3.4%
Occupations of females:
- Percentage of females in management occupations (except farmers):
Here: 27.8% city: 15.8%
- Percentage of females in business and financial operations occupations:
Here: 20.9% city: 11.5%
- Percentage of females in computer and mathematical occupations:
Here: 5.4% city: 5.1%
- Percentage of females in architecture and engineering occupations:
Here: 1.4% city: 1.6%
- Percentage of females in life, physical, and social science occupations:
Here: 2.8% city: 2.9%
- Percentage of females in legal occupations:
Here: 1.8% city: 3.0%
- Percentage of females in education, training, and library occupations:
Here: 2.9% city: 7.1%
- Percentage of females in arts, design, entertainment, sports, and media occupations:
Here: 4.7% city: 5.1%
- Percentage of females in healthcare practitioners and technical occupations:
Here: 14.0% city: 8.4%
- Percentage of females in service occupations:
Here: 1.9% city: 15.4%
- Percentage of females in sales and office occupations:
Here: 16.3% city: 19.3%
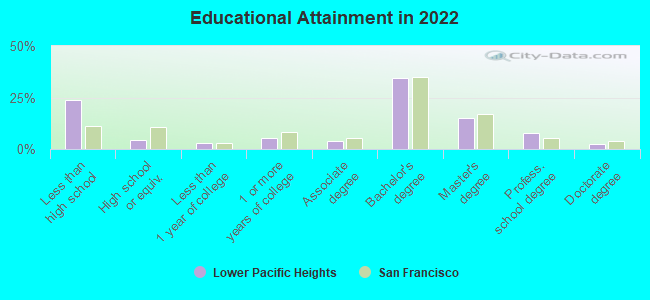
Education in this neighborhood (subdivision or community):
- Percentage of people 3 years and older in K-12 schools:
Lower Pacific Heights: 7.3% San Francisco: 9.7%
- Percentage of people 3 years and older in undergraduate colleges:
Lower Pacific Heights: 4.5% San Francisco: 4.8%
- Percentage of people 3 years and older in grad. or professional schools:
Lower Pacific Heights: 5.2% San Francisco: 2.6%
- Percentage of students K-12 enrolled in private schools:
Lower Pacific Heights: 100.0% San Francisco: 36.5%
Percentage of population below poverty level:
| Lower Pacific Heights: | 14.5% |
| San Francisco: | 10.4% |
Percentage of married-couple families with both working:
| Lower Pacific Heights: | 100.0% |
| San Francisco: | 75.9% |
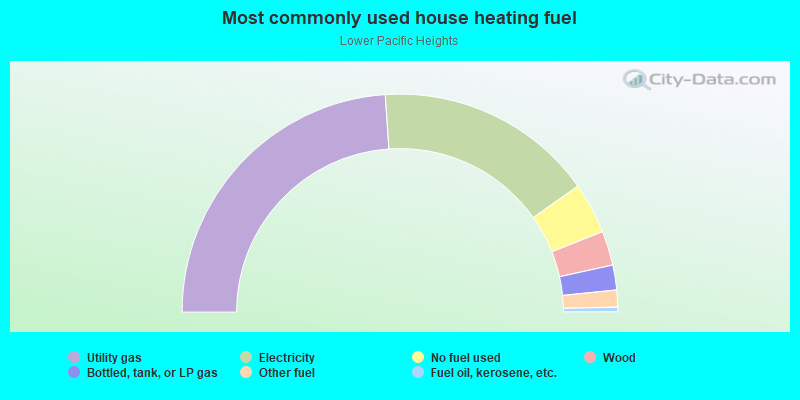
- 47.8%Utility gas
- 32.5%Electricity
- 7.6%No fuel used
- 5.1%Wood
- 3.7%Bottled, tank, or LP gas
- 2.5%Other fuel
- 0.7%Fuel oil, kerosene, etc.
Roads and streets:
Post St
Length: 1.37 miles
Direction: E-W
Address range: 1500 to 2699
Direction: E-W
Address range: 1500 to 2699
Bush St
Length: 1.36 miles
Direction: E-W
Address range: 1800 to 2999
Direction: E-W
Address range: 1800 to 2999
Pine St
Length: 1.36 miles
Direction: E-W
Address range: 1900 to 3099
Direction: E-W
Address range: 1900 to 3099
Sutter St
Length: 1.26 miles
Direction: E-W
Address range: 1600 to 2699
Direction: E-W
Address range: 1600 to 2699
Divisadero St
Length: 0.44 miles
Directions: N-S, SE-NW
Address range: 1551 to 1899
Directions: N-S, SE-NW
Address range: 1551 to 1899
Webster St
Length: 0.35 miles
Directions: N-S, SE-NW, SW-NE
Address range: 1601 to 1899
Directions: N-S, SE-NW, SW-NE
Address range: 1601 to 1899
Lyon St
Length: 0.24 miles
Direction: N-S
Address range: 1330 to 1699
Direction: N-S
Address range: 1330 to 1699
Broderick St
Length: 0.23 miles
Direction: N-S
Address range: 1435 to 1799
Direction: N-S
Address range: 1435 to 1799
Wilmot St
Length: 0.23 miles
Direction: E-W
Address range: 1 to 199
Direction: E-W
Address range: 1 to 199
Octavia St
Length: 0.20 miles
Directions: N-S, SE-NW
Address range: 1500 to 1799
Directions: N-S, SE-NW
Address range: 1500 to 1799
Buchanan St
Length: 0.20 miles
Direction: N-S
Address range: 1700 to 1999
Direction: N-S
Address range: 1700 to 1999
Fillmore St
Length: 0.20 miles
Direction: N-S
Address range: 1700 to 1999
Direction: N-S
Address range: 1700 to 1999
Pierce St
Length: 0.20 miles
Direction: N-S
Address range: 1600 to 1899
Direction: N-S
Address range: 1600 to 1899
Steiner St
Length: 0.20 miles
Direction: N-S
Address range: 1700 to 1999
Direction: N-S
Address range: 1700 to 1999
Baker St
Length: 0.20 miles
Direction: N-S
Address range: 1400 to 1699
Direction: N-S
Address range: 1400 to 1699
Scott St
Length: 0.20 miles
Direction: N-S
Address range: 1600 to 1899
Direction: N-S
Address range: 1600 to 1899
Laguna St
Length: 0.20 miles
Direction: N-S
Address range: 1600 to 1899
Direction: N-S
Address range: 1600 to 1899
Hemlock St
Length: 0.16 miles
Direction: E-W
Address range: 500 to 699
Direction: E-W
Address range: 500 to 699
Garden St
Length: 0.11 miles
Direction: E-W
Address range: 1 to 99
Direction: E-W
Address range: 1 to 99
Presidio Ave
Length: 0.11 miles
Direction: N-S
Address range: 600 to 969
Direction: N-S
Address range: 600 to 969
Cottage Row
Length: 0.07 miles
Direction: N-S
Address range: 1 to 99
Direction: N-S
Address range: 1 to 99
Leona Ter
Length: 0.06 miles
Direction: E-W
Address range: 1 to 99
Direction: E-W
Address range: 1 to 99
Avery St
Length: 0.04 miles
Direction: N-S
Address range: 1 to 99
Direction: N-S
Address range: 1 to 99
Erkson Ct
Length: 0.04 miles
Direction: N-S
Address range: 1 to 99
Direction: N-S
Address range: 1 to 99