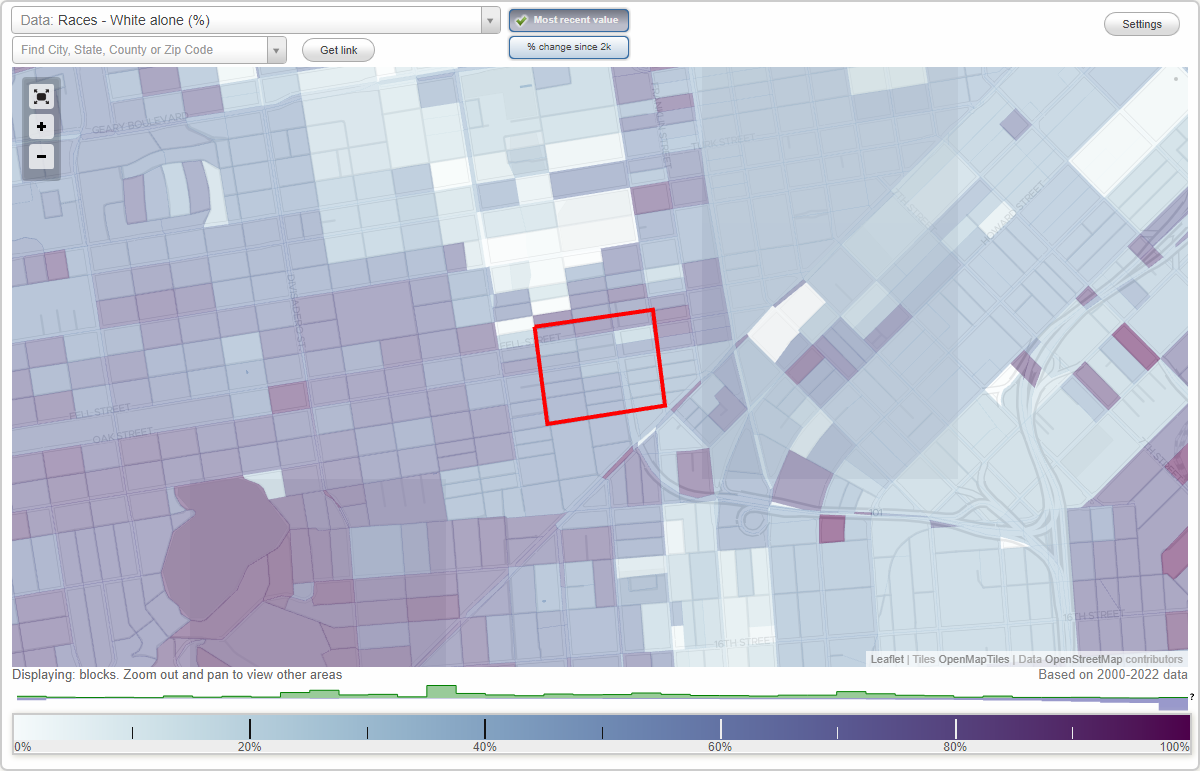
Mint Hill neighborhood in San Francisco, California (CA), 94102 detailed profile
Settings
X

Business Search - 14 Million verified businesses
Area: 0.064 square miles
Population: 2,565
Population density:
| Mint Hill: | 40,173 people per square mile |
| San Francisco: | 17,313 people per square mile |

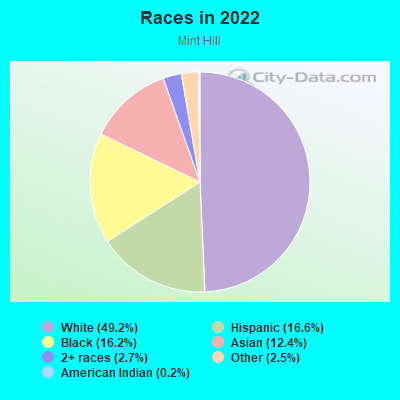
- 1,36749.2%White
- 46216.6%Hispanic or Latino
- 45116.2%Black
- 34512.4%Asian
- 742.7%Two or more races
- 702.5%Some other race
- 50.2%American Indian
- 20.07%Native Hawaiian and Other
Pacific Islander
Median household income in 2022:
| Mint Hill: | $174,752 |
| San Francisco: | $136,692 |
Distribution of median household income
![Distribution of median household income]()
- 53Less than $10,000
- 107$10,000 to $19,999
- 59$20,000 to $29,999
- 132$30,000 to $39,999
- 74$40,000 to $49,999
- 45$50,000 to $59,999
- 176$60,000 to $74,999
- 72$75,000 to $99,999
- 120$100,000 to $124,999
- 289$125,000 to $149,999
- 166$150,000 to $199,999
- 529$200,000 or more

Distribution of owner-occupied house/condo value
![Distribution of owner-occupied house/condo value]()
- 9$300,000 to $399,999
- 10$500,000 to $749,999
- 108$750,000 to $999,999
- 305$1,000,000 or more

Distribution of rent paid by renters
![Distribution of rent paid by renters]()
- 40$100 to $199
- 49$200 to $299
- 8$400 to $499
- 74$600 to $699
- 35$700 to $799
- 74$800 to $899
- 93$900 to $999
- 43$1,000 to $1,249
- 126$1,250 to $1,499
- 53$1,500 to $1,999
- 747$2,000 or more

Median rent in 2022:
| Mint Hill: | $2,654 |
| San Francisco: | $2,001 |
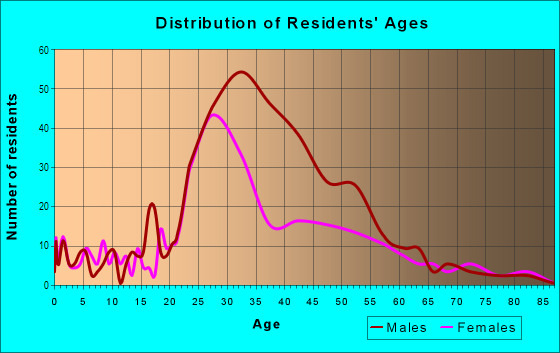
| Males: | 1,384 |
| Females: | 1,181 |
Males:
| This neighborhood: | 38.3 years |
| Whole city: | 40.3 years |
| This neighborhood: | 34.8 years |
| Whole city: | 40.5 years |
Average household size:
| Mint Hill: | 7.7 people |
| San Francisco: | 2.2 people |
Percentage of family households:
| Mint Hill: | 28.9% |
| San Francisco: | 30.3% |
| Here: | 22.9% |
| San Francisco: | 35.3% |
Percentage of married-couple families with children (among all households):
| Mint Hill: | 47.7% |
| San Francisco: | 35.9% |
Percentage of single-mother households (among all households):
| Mint Hill: | 11.5% |
| San Francisco: | 6.0% |
Percentage of never married males 15 years old and over:
Percentage of never married females 15 years old and over:
| Mint Hill: | 28.2% |
| San Francisco: | 24.6% |
Percentage of never married females 15 years old and over:
| Mint Hill: | 27.8% |
| city: | 19.9% |
Percentage of people that speak English not well or not at all:
| Mint Hill: | 4.0% |
| San Francisco: | 10.9% |
Percentage of people born in this state:
Percentage of people born in another U.S. state:
Percentage of native residents but born outside the U.S.:
Percentage of foreign born residents:
| Here: | 28.5% |
| San Francisco: | 40.8% |
Percentage of people born in another U.S. state:
| Mint Hill: | 41.6% |
| San Francisco: | 23.4% |
Percentage of native residents but born outside the U.S.:
| Here: | 1.4% |
| city: | 2.6% |
Percentage of foreign born residents:
| Here: | 28.5% |
| San Francisco: | 33.2% |
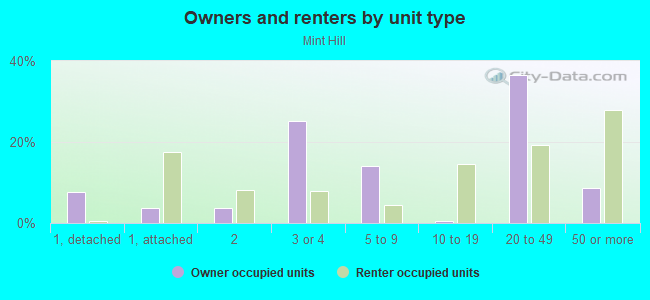
Owner-occupied
Renter-occupied

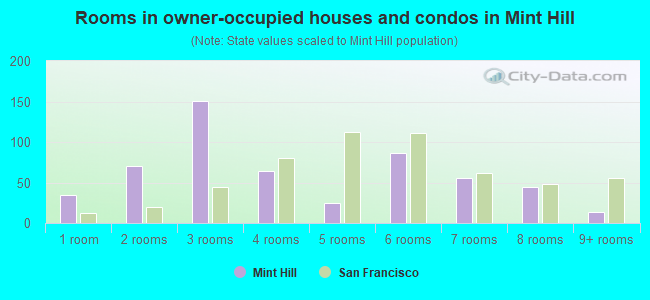
- Rooms in owner-occupied houses and condos in Mint Hill
- 351 room
- 702 rooms
- 1503 rooms
- 644 rooms
- 255 rooms
- 876 rooms
- 567 rooms
- 458 rooms
- 149+ rooms
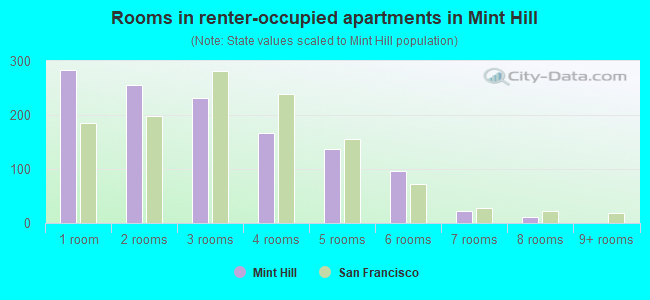
- Rooms in renter-occupied apartments in Mint Hill
- 2831 room
- 2552 rooms
- 2313 rooms
- 1664 rooms
- 1375 rooms
- 966 rooms
- 227 rooms
- 128 rooms
- 09+ rooms
Owner-occupied
Renter-occupied
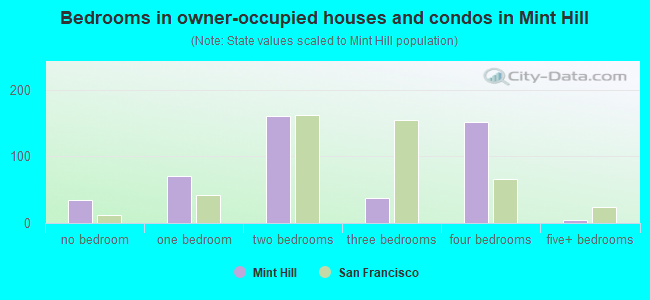
- Bedrooms in owner-occupied houses and condos in Mint Hill
- 35no bedroom
- 701 bedroom
- 1612 bedrooms
- 383 bedrooms
- 1524 bedrooms
- 45+ bedrooms
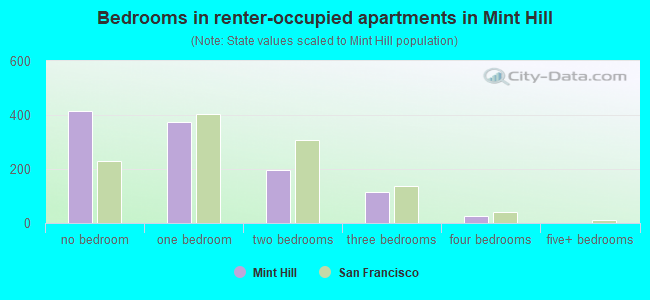
- Bedrooms in renter-occupied apartments in Mint Hill
- 415no bedroom
- 3751 bedroom
- 1952 bedrooms
- 1163 bedrooms
- 264 bedrooms
- 05+ bedrooms
Average number of cars or other vehicles available in houses/condos:
Average number of cars or other vehicles available in apartments:
| This neighborhood: | 1.5 |
| San Francisco: | 1.5 |
Average number of cars or other vehicles available in apartments:
| Here: | 0.4 |
| city: | 0.8 |
Percentage of units with a mortgage:
| Mint Hill: | 37.3% |
| San Francisco: | 62.3% |
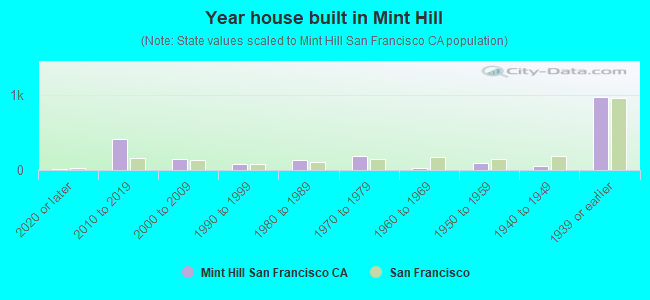
- Year house built in Mint Hill
- 132020 or later
- 4062010 to 2019
- 1432000 to 2009
- 861990 to 1999
- 1331980 to 1989
- 1891970 to 1979
- 271960 to 1969
- 901950 to 1959
- 581940 to 1949
- 9631939 or earlier
City-data.com crime index for city in 2020 (higher means more crime):
| City: | 387.4 |
| U.S. average: | 219.5 |
Travel time to work (commute)
![Travel time to work (commute)]()
- 36Less than 5 minutes
- 295 to 9 minutes
- 7410 to 14 minutes
- 20815 to 19 minutes
- 18720 to 24 minutes
- 10625 to 29 minutes
- 26230 to 34 minutes
- 3635 to 39 minutes
- 3240 to 44 minutes
- 6445 to 59 minutes
- 11960 to 89 minutes
- 5890 or more minutes

Means of transportation to work
![Means of transportation to work]()
- 20.4%368Drove a car alone
- 6.6%118Carpooled
- 8.9%160Bus
- 16.0%288Subway or elevated rail
- 7.8%140Long-distance train or commuter rail
- 2.2%39Light rail, streetcar or trolley
- 1.9%35Taxi
- 3.2%58Motorcycle
- 13.7%246Bicycle
- 9.9%178Walked
- 0.8%14Other means
- 22.3%402Worked at home

Time leaving home to go to work
![Time leaving home to go to work]()
- 1812:00 a.m. to 4:59 a.m.
- 636:00 a.m. to 6:29 a.m.
- 416:30 a.m. to 6:59 a.m.
- 647:00 a.m. to 7:29 a.m.
- 1747:30 a.m. to 7:59 a.m.
- 2358:00 a.m. to 8:29 a.m.
- 1488:30 a.m. to 8:59 a.m.
- 2839:00 a.m. to 9:59 a.m.
- 7310:00 a.m. to 10:59 a.m.
- 3812:00 p.m. to 3:59 p.m.
- 414:00 p.m. to 11:59 p.m.

Occupations of males:
- Percentage of males in management occupations (except farmers):
Here: 18.3% city: 17.2%
- Percentage of males in business and financial operations occupations:
Here: 18.9% city: 8.9%
- Percentage of males in computer and mathematical occupations:
Here: 14.7% city: 14.6%
- Percentage of males in architecture and engineering occupations:
Here: 2.9% city: 4.0%
- Percentage of males in life, physical, and social science occupations:
Here: 4.7% city: 2.4%
- Percentage of males in legal occupations:
Here: 3.0% city: 2.5%
- Percentage of males in education, training, and library occupations:
Here: 9.6% city: 3.4%
- Percentage of males in arts, design, entertainment, sports, and media occupations:
Here: 9.2% city: 4.9%
- Percentage of males in healthcare practitioners and technical occupations:
Here: 2.2% city: 3.2%
- Percentage of males in service occupations:
Here: 5.1% city: 11.8%
- Percentage of males in sales and office occupations:
Here: 4.7% city: 13.5%
- Percentage of males in transportation occupations:
Here: 2.1% city: 3.4%
Occupations of females:
- Percentage of females in management occupations (except farmers):
Here: 5.6% city: 15.8%
- Percentage of females in business and financial operations occupations:
Here: 10.9% city: 11.5%
- Percentage of females in computer and mathematical occupations:
Here: 7.6% city: 5.1%
- Percentage of females in life, physical, and social science occupations:
Here: 6.7% city: 2.9%
- Percentage of females in community and social services occupations:
Here: 1.5% city: 1.6%
- Percentage of females in legal occupations:
Here: 1.7% city: 3.0%
- Percentage of females in education, training, and library occupations:
Here: 5.4% city: 7.1%
- Percentage of females in arts, design, entertainment, sports, and media occupations:
Here: 12.8% city: 5.1%
- Percentage of females in healthcare practitioners and technical occupations:
Here: 3.7% city: 8.4%
- Percentage of females in service occupations:
Here: 7.7% city: 15.4%
- Percentage of females in sales and office occupations:
Here: 33.3% city: 19.3%
- Percentage of females in production occupations:
Here: 3.2% city: 1.5%
Percentage of people 16-64 in Armed Forces:
| Mint Hill: | 1.4% |
| San Francisco: | 0.1% |
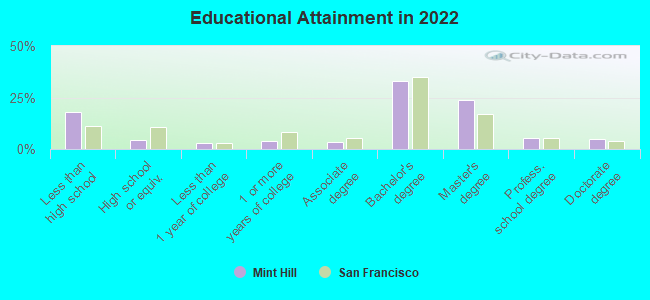
Education in this neighborhood (subdivision or community):
- Percentage of people 3 years and older in K-12 schools:
Mint Hill: 5.4% San Francisco: 9.7%
- Percentage of people 3 years and older in undergraduate colleges:
Mint Hill: 8.3% San Francisco: 4.8%
- Percentage of people 3 years and older in grad. or professional schools:
Mint Hill: 17.5% San Francisco: 2.6%
- Percentage of students K-12 enrolled in private schools:
Mint Hill: 18.5% San Francisco: 36.5%
Percentage of population below poverty level:
| Mint Hill: | 11.1% |
| San Francisco: | 10.4% |
Median year renter moved in (as recorded in 2022):
| Mint Hill: | 2018 |
| San Francisco: | 2019 |
Percentage of married-couple families with both working:
| Mint Hill: | 164.6% |
| San Francisco: | 75.9% |
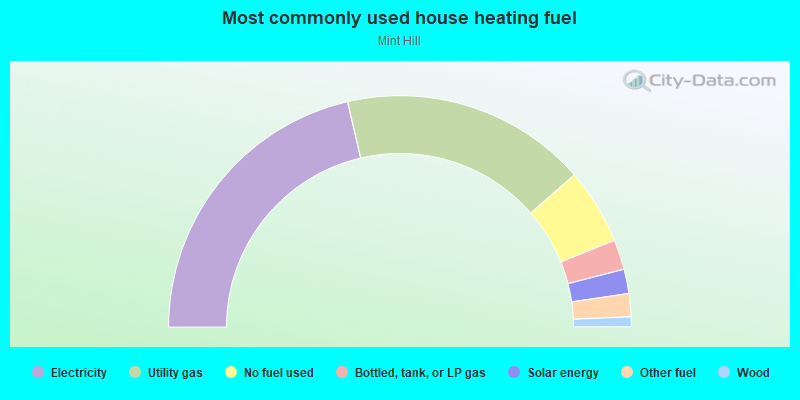
- 42.7%Electricity
- 34.4%Utility gas
- 10.6%No fuel used
- 4.2%Bottled, tank, or LP gas
- 3.4%Solar energy
- 3.2%Other fuel
- 1.4%Wood
Roads and streets:
Hickory St
Length: 0.23 miles
Direction: E-W
Address range: 201 to 399
Direction: E-W
Address range: 201 to 399
Rose St
Length: 0.23 miles
Direction: E-W
Address range: 100 to 299
Direction: E-W
Address range: 100 to 299
Page St
Length: 0.23 miles
Direction: E-W
Address range: 100 to 299
Direction: E-W
Address range: 100 to 299
Lily St
Length: 0.23 miles
Direction: E-W
Address range: 100 to 299
Direction: E-W
Address range: 100 to 299
Oak St
Length: 0.23 miles
Direction: E-W
Address range: 200 to 399
Direction: E-W
Address range: 200 to 399
Fell St
Length: 0.23 miles
Direction: E-W
Address range: 300 to 499
Direction: E-W
Address range: 300 to 499
Octavia St
Length: 0.20 miles
Direction: N-S
Address range: 124 to 448
Direction: N-S
Address range: 124 to 448
Laguna St
Length: 0.20 miles
Direction: N-S
Address range: 249 to 528
Direction: N-S
Address range: 249 to 528
Gough St
Length: 0.16 miles
Direction: N-S
Address range: 38 to 299
Direction: N-S
Address range: 38 to 299
Linden St
Length: 0.11 miles
Direction: E-W
Address range: 400 to 499
Direction: E-W
Address range: 400 to 499