Transmission neighborhood in San Francisco, California (CA), 94110 detailed profile
Settings
X

Business Search - 14 Million verified businesses
Area: 0.090 square miles
Population: 2,939
Population density:
| Transmission: | 32,784 people per square mile |
| San Francisco: | 17,313 people per square mile |

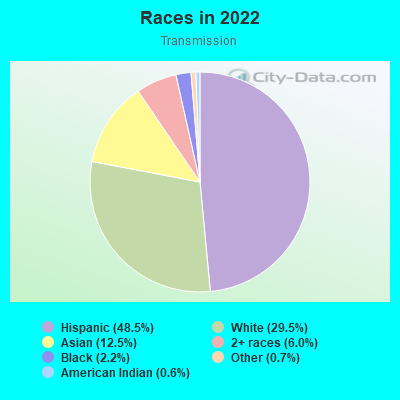
- 1,44948.5%Hispanic or Latino
- 88329.5%White
- 37512.5%Asian
- 1796.0%Two or more races
- 662.2%Black
- 200.7%Some other race
- 180.6%American Indian
Median household income in 2022:
| Transmission: | $208,257 |
| San Francisco: | $136,692 |
Distribution of median household income
![Distribution of median household income]()
- 58Less than $10,000
- 105$10,000 to $19,999
- 57$20,000 to $29,999
- 134$30,000 to $39,999
- 111$40,000 to $49,999
- 65$50,000 to $59,999
- 69$60,000 to $74,999
- 128$75,000 to $99,999
- 91$100,000 to $124,999
- 125$125,000 to $149,999
- 155$150,000 to $199,999
- 349$200,000 or more

Distribution of owner-occupied house/condo value
![Distribution of owner-occupied house/condo value]()
- 13Less than $50,000
- 5$100,000 to $149,999
- 4$200,000 to $249,999
- 20$300,000 to $399,999
- 38$400,000 to $499,999
- 18$500,000 to $749,999
- 68$750,000 to $999,999
- 386$1,000,000 or more

Distribution of rent paid by renters
![Distribution of rent paid by renters]()
- 83$100 to $199
- 26$200 to $299
- 29$500 to $599
- 51$600 to $699
- 62$700 to $799
- 29$800 to $899
- 75$900 to $999
- 87$1,000 to $1,249
- 41$1,250 to $1,499
- 50$1,500 to $1,999
- 395$2,000 or more

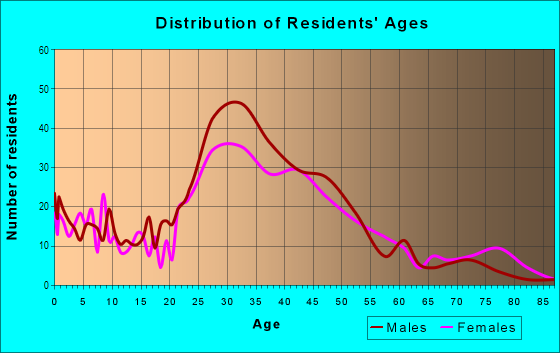
| Males: | 1,524 |
| Females: | 1,415 |
Males:
| This neighborhood: | 47.4 years |
| Whole city: | 40.3 years |
| This neighborhood: | 47.9 years |
| Whole city: | 40.5 years |
Average household size:
| Transmission: | 3.2 people |
| San Francisco: | 2.2 people |
Percentage of family households:
| Transmission: | 38.5% |
| San Francisco: | 30.3% |
| Here: | 40.4% |
| San Francisco: | 35.3% |
Percentage of married-couple families with children (among all households):
| Transmission: | 31.7% |
| San Francisco: | 35.9% |
Percentage of single-mother households (among all households):
| Transmission: | 2.1% |
| San Francisco: | 6.0% |
Percentage of never married males 15 years old and over:
Percentage of never married females 15 years old and over:
| Transmission: | 25.9% |
| San Francisco: | 24.6% |
Percentage of never married females 15 years old and over:
| Transmission: | 22.2% |
| city: | 19.9% |
Percentage of people that speak English not well or not at all:
| Transmission: | 7.2% |
| San Francisco: | 10.9% |
Percentage of people born in this state:
Percentage of people born in another U.S. state:
Percentage of native residents but born outside the U.S.:
Percentage of foreign born residents:
| Here: | 45.6% |
| San Francisco: | 40.8% |
Percentage of people born in another U.S. state:
| Transmission: | 27.8% |
| San Francisco: | 23.4% |
Percentage of native residents but born outside the U.S.:
| Here: | 2.5% |
| city: | 2.6% |
Percentage of foreign born residents:
| Here: | 24.1% |
| San Francisco: | 33.2% |
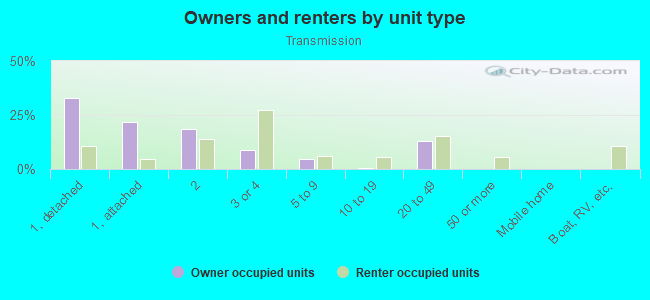
Owner-occupied
Renter-occupied

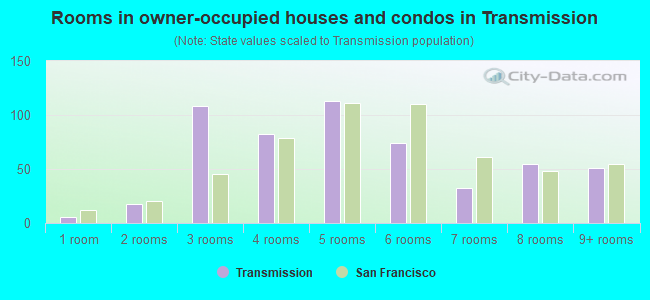
- Rooms in owner-occupied houses and condos in Transmission
- 61 room
- 182 rooms
- 1083 rooms
- 824 rooms
- 1135 rooms
- 746 rooms
- 327 rooms
- 558 rooms
- 519+ rooms
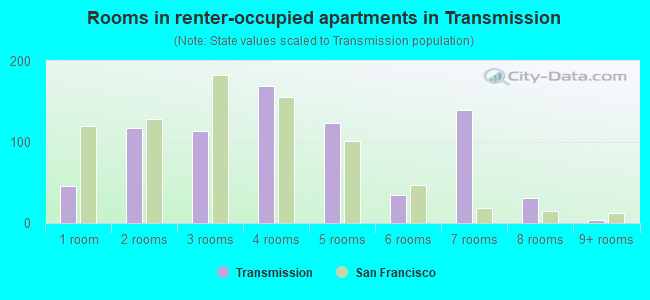
- Rooms in renter-occupied apartments in Transmission
- 461 room
- 1172 rooms
- 1143 rooms
- 1694 rooms
- 1245 rooms
- 346 rooms
- 1407 rooms
- 318 rooms
- 49+ rooms
Owner-occupied
Renter-occupied
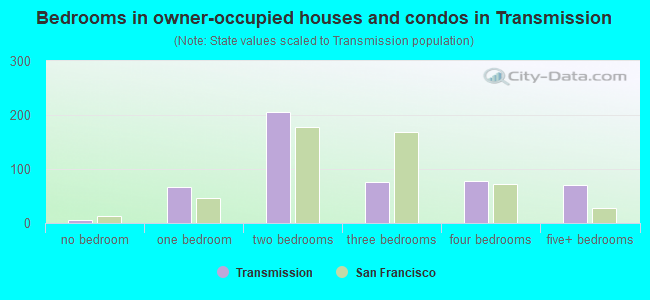
- Bedrooms in owner-occupied houses and condos in Transmission
- 6no bedroom
- 671 bedroom
- 2052 bedrooms
- 763 bedrooms
- 784 bedrooms
- 715+ bedrooms
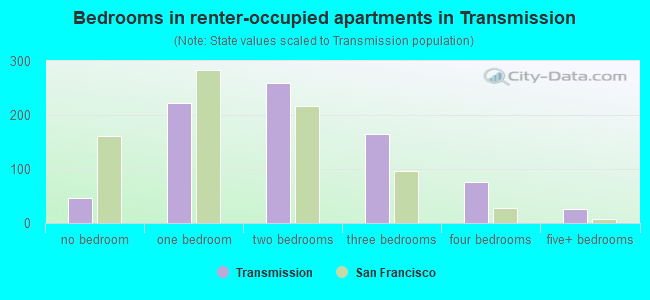
- Bedrooms in renter-occupied apartments in Transmission
- 46no bedroom
- 2221 bedroom
- 2592 bedrooms
- 1643 bedrooms
- 764 bedrooms
- 265+ bedrooms
Average number of cars or other vehicles available in houses/condos:
Average number of cars or other vehicles available in apartments:
| This neighborhood: | 1.8 |
| San Francisco: | 1.5 |
Average number of cars or other vehicles available in apartments:
| Here: | 0.9 |
| city: | 0.8 |
Percentage of units with a mortgage:
| Transmission: | 81.1% |
| San Francisco: | 62.3% |
Housing prices:
- Average estimated value of detached houses in 2022 (18.9% of all units):
Transmission: $2,170,135 San Francisco: $1,942,973
- Average estimated value of townhouses or other attached units in 2022 (18.3% of all units):
This neighborhood: $2,926,871 city: $1,528,422
- Average estimated value of housing units in 2-unit structures in 2022 (20.0% of all units):
This neighborhood: $1,402,589 San Francisco: $1,536,932
- Average estimated '22 value of housing units in 3-to-4-unit structures (22.7% of all units):
Transmission: $1,845,555 city: $1,622,965
- Average estimated '22 value of housing units in 5-or-more-unit structures (3.4% of all units):
Transmission: $872,748 San Francisco: $1,155,972
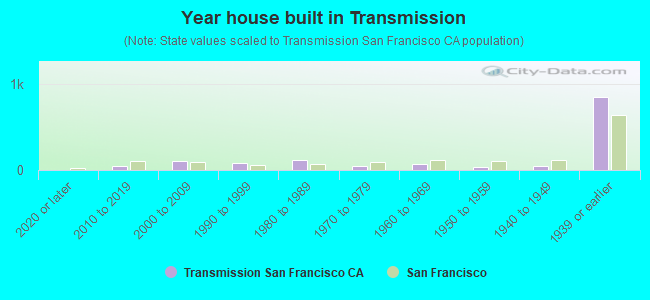
- Year house built in Transmission
- 02020 or later
- 472010 to 2019
- 1062000 to 2009
- 801990 to 1999
- 1221980 to 1989
- 451970 to 1979
- 731960 to 1969
- 401950 to 1959
- 411940 to 1949
- 8451939 or earlier
City-data.com crime index for city in 2020 (higher means more crime):
| City: | 387.4 |
| U.S. average: | 219.5 |
Travel time to work (commute)
![Travel time to work (commute)]()
- 2Less than 5 minutes
- 235 to 9 minutes
- 4510 to 14 minutes
- 12415 to 19 minutes
- 13720 to 24 minutes
- 8625 to 29 minutes
- 20230 to 34 minutes
- 6135 to 39 minutes
- 1940 to 44 minutes
- 13245 to 59 minutes
- 13460 to 89 minutes
- 2890 or more minutes

Means of transportation to work
![Means of transportation to work]()
- 36.8%654Drove a car alone
- 9.7%173Carpooled
- 13.6%241Bus
- 7.9%140Subway or elevated rail
- 1.4%24Long-distance train or commuter rail
- 3.4%60Light rail, streetcar or trolley
- 2.3%41Ferryboat
- 1.1%19Taxi
- 0.6%10Motorcycle
- 4.0%71Bicycle
- 4.1%73Walked
- 4.9%87Other means
- 19.8%352Worked at home

Time leaving home to go to work
![Time leaving home to go to work]()
- 3412:00 a.m. to 4:59 a.m.
- 135:00 a.m. to 5:29 a.m.
- 135:30 a.m. to 5:59 a.m.
- 676:00 a.m. to 6:29 a.m.
- 666:30 a.m. to 6:59 a.m.
- 1557:00 a.m. to 7:29 a.m.
- 907:30 a.m. to 7:59 a.m.
- 1358:00 a.m. to 8:29 a.m.
- 968:30 a.m. to 8:59 a.m.
- 1089:00 a.m. to 9:59 a.m.
- 5210:00 a.m. to 10:59 a.m.
- 1111:00 a.m. to 11:59 a.m.
- 3512:00 p.m. to 3:59 p.m.
- 704:00 p.m. to 11:59 p.m.

Occupations of males:
- Percentage of males in management occupations (except farmers):
Here: 19.7% city: 17.2%
- Percentage of males in business and financial operations occupations:
Here: 9.3% city: 8.9%
- Percentage of males in computer and mathematical occupations:
Here: 12.3% city: 14.6%
- Percentage of males in architecture and engineering occupations:
Here: 6.2% city: 4.0%
- Percentage of males in life, physical, and social science occupations:
Here: 1.3% city: 2.4%
- Percentage of males in legal occupations:
Here: 1.1% city: 2.5%
- Percentage of males in education, training, and library occupations:
Here: 4.7% city: 3.4%
- Percentage of males in arts, design, entertainment, sports, and media occupations:
Here: 6.3% city: 4.9%
- Percentage of males in healthcare practitioners and technical occupations:
Here: 3.4% city: 3.2%
- Percentage of males in service occupations:
Here: 7.3% city: 11.8%
- Percentage of males in sales and office occupations:
Here: 14.4% city: 13.5%
- Percentage of males in construction, extraction, and maintenance occupations:
Here: 9.3% city: 3.1%
- Percentage of males in production occupations:
Here: 2.4% city: 2.5%
- Percentage of males in transportation occupations:
Here: 1.2% city: 3.4%
Occupations of females:
- Percentage of females in management occupations (except farmers):
Here: 8.7% city: 15.8%
- Percentage of females in business and financial operations occupations:
Here: 11.9% city: 11.5%
- Percentage of females in computer and mathematical occupations:
Here: 4.9% city: 5.1%
- Percentage of females in life, physical, and social science occupations:
Here: 3.1% city: 2.9%
- Percentage of females in community and social services occupations:
Here: 6.5% city: 1.6%
- Percentage of females in legal occupations:
Here: 1.3% city: 3.0%
- Percentage of females in education, training, and library occupations:
Here: 11.5% city: 7.1%
- Percentage of females in arts, design, entertainment, sports, and media occupations:
Here: 8.2% city: 5.1%
- Percentage of females in healthcare practitioners and technical occupations:
Here: 6.0% city: 8.4%
- Percentage of females in service occupations:
Here: 11.9% city: 15.4%
- Percentage of females in sales and office occupations:
Here: 20.7% city: 19.3%
- Percentage of females in farming, fishing, and forestry occupations:
Here: 4.4% city: 0.1%
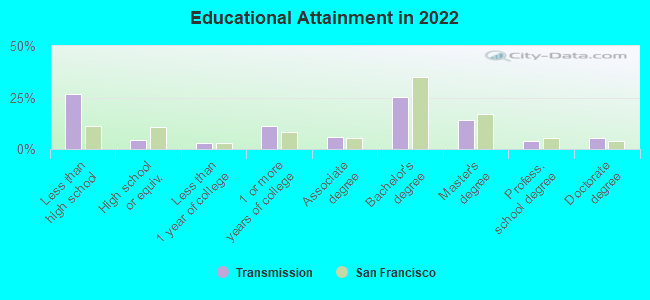
Education in this neighborhood (subdivision or community):
- Percentage of people 3 years and older in K-12 schools:
Transmission: 12.8% San Francisco: 9.7%
- Percentage of people 3 years and older in undergraduate colleges:
Transmission: 6.0% San Francisco: 4.8%
- Percentage of people 3 years and older in grad. or professional schools:
Transmission: 2.0% San Francisco: 2.6%
- Percentage of students K-12 enrolled in private schools:
Transmission: 79.1% San Francisco: 36.5%
Percentage of population below poverty level:
| Transmission: | 7.1% |
| San Francisco: | 10.4% |
Median year owner moved in (as recorded in 2022):
Median year renter moved in (as recorded in 2022):
| Transmission: | 2409 |
| San Francisco: | 2007 |
Median year renter moved in (as recorded in 2022):
| Transmission: | 2413 |
| San Francisco: | 2019 |
Percentage of married-couple families with both working:
| Transmission: | 91.9% |
| San Francisco: | 75.9% |
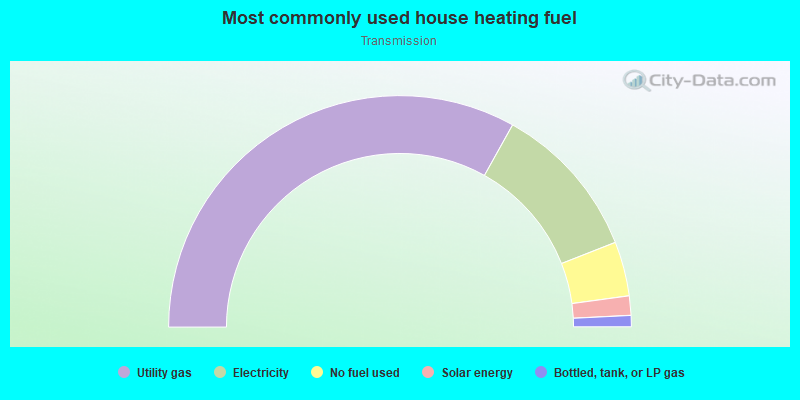
- 66.2%Utility gas
- 21.9%Electricity
- 7.6%No fuel used
- 2.7%Solar energy
- 1.6%Bottled, tank, or LP gas
Roads and streets:
Mission St
Length: 0.47 miles
Direction: SW-NE
Address range: 3134 to 3499
Direction: SW-NE
Address range: 3134 to 3499
Coleridge St
Length: 0.39 miles
Direction: SW-NE
Address range: 1 to 348
Direction: SW-NE
Address range: 1 to 348
Lundys Ln
Length: 0.25 miles
Directions: N-S, SW-NE
Address range: 1 to 199
Directions: N-S, SW-NE
Address range: 1 to 199
Precita Ave
Length: 0.20 miles
Direction: E-W
Address range: 1 to 199
Direction: E-W
Address range: 1 to 199
Coso Ave
Length: 0.17 miles
Directions: E-W, N-S, SE-NW
Address range: 1 to 198
Directions: E-W, N-S, SE-NW
Address range: 1 to 198
Prospect Ave
Length: 0.17 miles
Direction: SW-NE
Address range: 1 to 99
Direction: SW-NE
Address range: 1 to 99
Virginia Ave
Length: 0.15 miles
Direction: E-W
Address range: 1 to 199
Direction: E-W
Address range: 1 to 199
Fair Ave
Length: 0.13 miles
Directions: E-W, SE-NW
Address range: 1 to 149
Directions: E-W, SE-NW
Address range: 1 to 149
Godeus St
Length: 0.08 miles
Direction: E-W
Address range: 1 to 99
Direction: E-W
Address range: 1 to 99
Eugenia Ave
Length: 0.08 miles
Direction: E-W
Address range: 1 to 99
Direction: E-W
Address range: 1 to 99
Powers Ave
Length: 0.08 miles
Direction: E-W
Address range: 1 to 99
Direction: E-W
Address range: 1 to 99
Kingston St
Length: 0.08 miles
Direction: E-W
Address range: 100 to 199
Direction: E-W
Address range: 100 to 199
Esmeralda Ave
Length: 0.07 miles
Direction: E-W
Address range: 1 to 99
Direction: E-W
Address range: 1 to 99
Peters Ave
Length: 0.05 miles
Direction: SW-NE
Address range: 1 to 99
Direction: SW-NE
Address range: 1 to 99
Emmet Ct (Emmett Ct)
Length: 0.03 miles
Direction: SE-NW
Address range: 100 to 199
Direction: SE-NW
Address range: 100 to 199