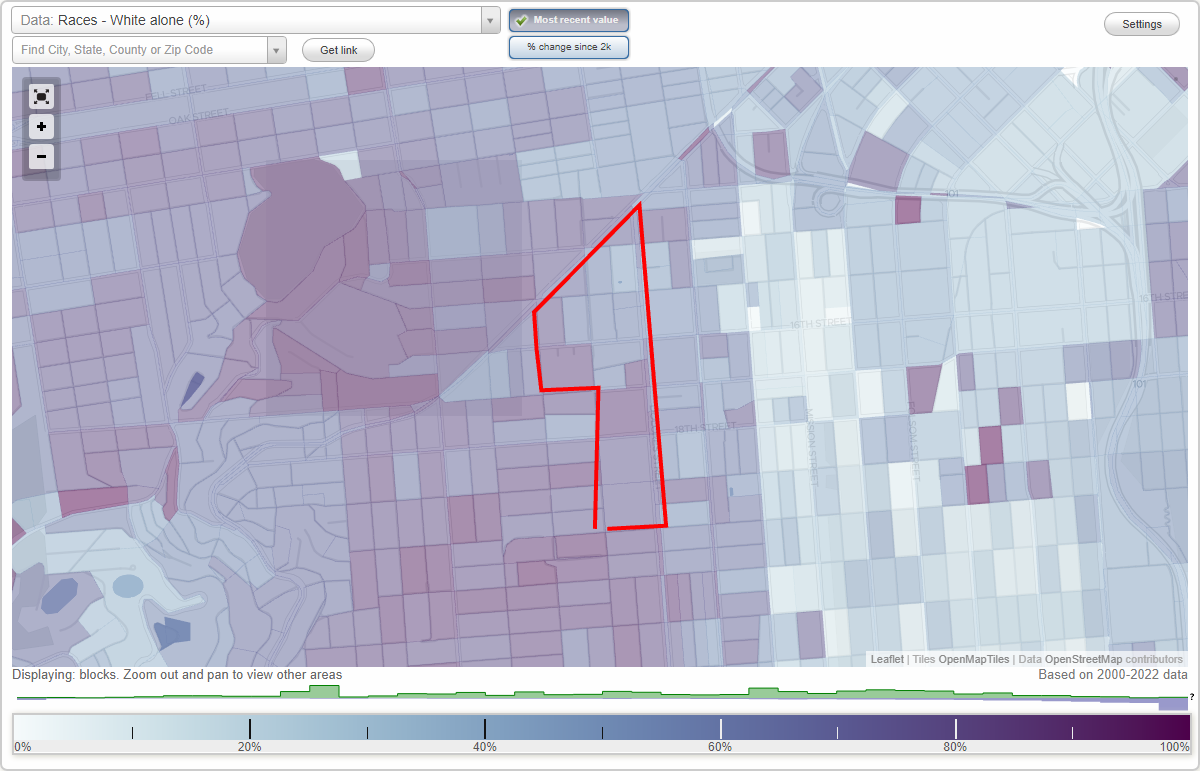
Mastro neighborhood in San Francisco, California (CA), 94110, 94114 detailed profile
Settings
X

Business Search - 14 Million verified businesses
Area: 0.126 square miles
Population: 4,212
Population density:
| Mastro: | 33,486 people per square mile |
| San Francisco: | 17,313 people per square mile |

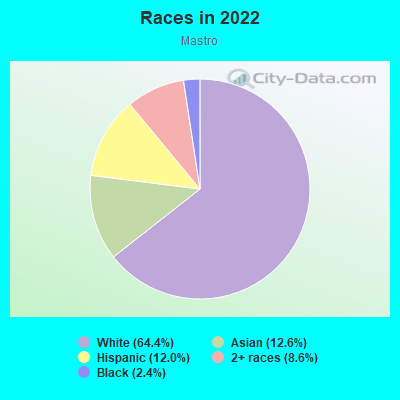
- 2,71264.4%White
- 53112.6%Asian
- 50412.0%Hispanic or Latino
- 3628.6%Two or more races
- 1012.4%Black
Median household income in 2022:
| Mastro: | $146,271 |
| San Francisco: | $136,692 |
Distribution of median household income
![Distribution of median household income]()
- 115Less than $10,000
- 151$10,000 to $19,999
- 104$20,000 to $29,999
- 106$30,000 to $39,999
- 133$40,000 to $49,999
- 50$50,000 to $59,999
- 51$60,000 to $74,999
- 381$75,000 to $99,999
- 172$100,000 to $124,999
- 176$125,000 to $149,999
- 337$150,000 to $199,999
- 1,235$200,000 or more

Distribution of owner-occupied house/condo value
![Distribution of owner-occupied house/condo value]()
- 215$100,000 to $149,999
- 20$300,000 to $399,999
- 115$500,000 to $749,999
- 368$750,000 to $999,999
- 572$1,000,000 or more

Distribution of rent paid by renters
![Distribution of rent paid by renters]()
- 44$300 to $399
- 74$600 to $699
- 38$700 to $799
- 30$800 to $899
- 101$1,000 to $1,249
- 107$1,250 to $1,499
- 258$1,500 to $1,999
- 1,046$2,000 or more

Median rent in 2022:
| Mastro: | $2,546 |
| San Francisco: | $2,001 |
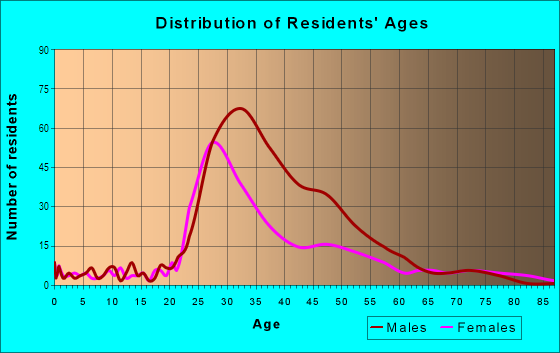
| Males: | 2,591 |
| Females: | 1,621 |
Males:
| This neighborhood: | 41.1 years |
| Whole city: | 40.3 years |
| This neighborhood: | 37.9 years |
| Whole city: | 40.5 years |
Average household size:
| Mastro: | 1.7 people |
| San Francisco: | 2.2 people |
Percentage of family households:
| Mastro: | 18.9% |
| San Francisco: | 30.3% |
| Here: | 16.5% |
| San Francisco: | 35.3% |
Percentage of married-couple families with children (among all households):
| Mastro: | 26.8% |
| San Francisco: | 35.9% |
Percentage of single-mother households (among all households):
| Mastro: | 37.9% |
| San Francisco: | 6.0% |
Percentage of never married males 15 years old and over:
Percentage of never married females 15 years old and over:
| Mastro: | 46.7% |
| San Francisco: | 24.6% |
Percentage of never married females 15 years old and over:
| Mastro: | 16.2% |
| city: | 19.9% |
Percentage of people that speak English not well or not at all:
| Mastro: | 1.1% |
| San Francisco: | 10.9% |
Percentage of people born in this state:
Percentage of people born in another U.S. state:
Percentage of native residents but born outside the U.S.:
Percentage of foreign born residents:
| Here: | 33.2% |
| San Francisco: | 40.8% |
Percentage of people born in another U.S. state:
| Mastro: | 38.1% |
| San Francisco: | 23.4% |
Percentage of native residents but born outside the U.S.:
| Here: | 8.9% |
| city: | 2.6% |
Percentage of foreign born residents:
| Here: | 19.8% |
| San Francisco: | 33.2% |
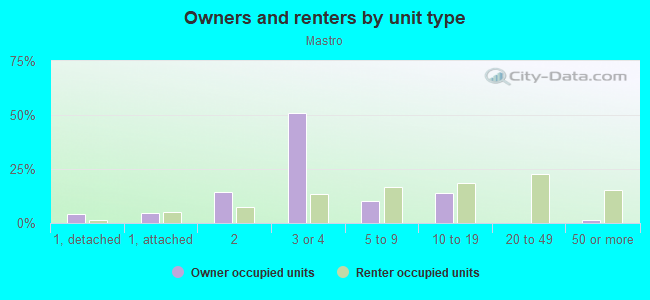
Owner-occupied
Renter-occupied

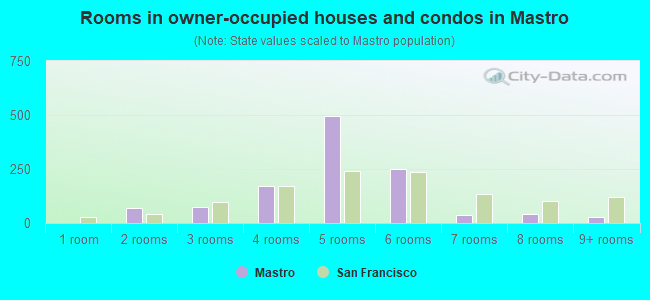
- Rooms in owner-occupied houses and condos in Mastro
- 01 room
- 692 rooms
- 753 rooms
- 1704 rooms
- 4975 rooms
- 2506 rooms
- 387 rooms
- 418 rooms
- 269+ rooms
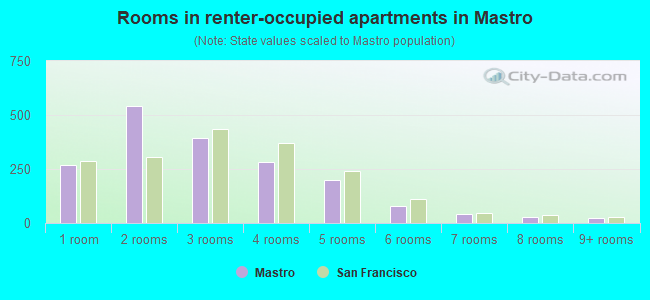
- Rooms in renter-occupied apartments in Mastro
- 2691 room
- 5432 rooms
- 3943 rooms
- 2824 rooms
- 1995 rooms
- 806 rooms
- 427 rooms
- 298 rooms
- 239+ rooms
Owner-occupied
Renter-occupied
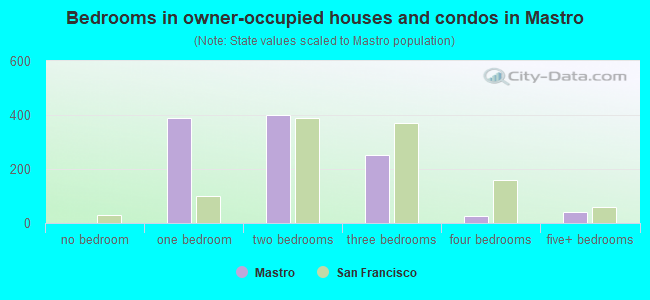
- Bedrooms in owner-occupied houses and condos in Mastro
- 0no bedroom
- 3891 bedroom
- 4012 bedrooms
- 2533 bedrooms
- 254 bedrooms
- 395+ bedrooms
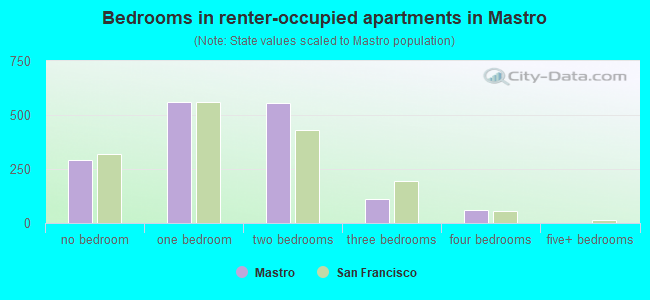
- Bedrooms in renter-occupied apartments in Mastro
- 293no bedroom
- 5581 bedroom
- 5572 bedrooms
- 1113 bedrooms
- 584 bedrooms
- 05+ bedrooms
Average number of cars or other vehicles available in houses/condos:
Average number of cars or other vehicles available in apartments:
| This neighborhood: | 1.1 |
| San Francisco: | 1.5 |
Average number of cars or other vehicles available in apartments:
| Here: | 0.5 |
| city: | 0.8 |
Percentage of units with a mortgage:
| Mastro: | 70.2% |
| San Francisco: | 62.3% |
Housing prices:
- Average estimated value of detached houses in 2022 (2.1% of all units):
Mastro: $1,090,349 San Francisco: $1,942,973
- Average estimated value of townhouses or other attached units in 2022 (3.2% of all units):
This neighborhood: $1,423,254 city: $1,528,422
- Average estimated value of housing units in 2-unit structures in 2022 (11.0% of all units):
This neighborhood: $1,343,564 San Francisco: $1,536,932
- Average estimated '22 value of housing units in 3-to-4-unit structures (28.4% of all units):
Mastro: $1,092,872 city: $1,622,965
- Average estimated '22 value of housing units in 5-or-more-unit structures (13.4% of all units):
Mastro: $1,354,368 San Francisco: $1,155,972
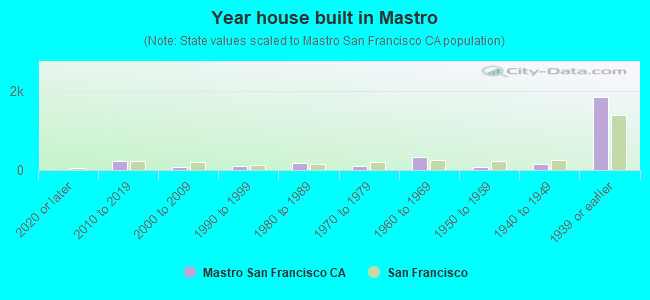
- Year house built in Mastro
- 02020 or later
- 2282010 to 2019
- 762000 to 2009
- 1141990 to 1999
- 1771980 to 1989
- 921970 to 1979
- 3421960 to 1969
- 881950 to 1959
- 1441940 to 1949
- 1,8471939 or earlier
City-data.com crime index for city in 2020 (higher means more crime):
| City: | 387.4 |
| U.S. average: | 219.5 |
Travel time to work (commute)
![Travel time to work (commute)]()
- 15Less than 5 minutes
- 405 to 9 minutes
- 8010 to 14 minutes
- 31215 to 19 minutes
- 36820 to 24 minutes
- 23525 to 29 minutes
- 21930 to 34 minutes
- 3535 to 39 minutes
- 5740 to 44 minutes
- 15645 to 59 minutes
- 18860 to 89 minutes
- 7690 or more minutes

Means of transportation to work
![Means of transportation to work]()
- 15.7%500Drove a car alone
- 1.5%48Carpooled
- 9.5%302Bus
- 16.5%527Subway or elevated rail
- 1.1%36Long-distance train or commuter rail
- 1.3%41Light rail, streetcar or trolley
- 1.0%33Ferryboat
- 1.1%36Taxi
- 1.0%33Motorcycle
- 5.6%177Bicycle
- 7.4%235Walked
- 0.7%23Other means
- 41.1%1,309Worked at home

Time leaving home to go to work
![Time leaving home to go to work]()
- 3412:00 a.m. to 4:59 a.m.
- 215:00 a.m. to 5:29 a.m.
- 85:30 a.m. to 5:59 a.m.
- 956:00 a.m. to 6:29 a.m.
- 506:30 a.m. to 6:59 a.m.
- 2057:00 a.m. to 7:29 a.m.
- 1887:30 a.m. to 7:59 a.m.
- 3488:00 a.m. to 8:29 a.m.
- 2428:30 a.m. to 8:59 a.m.
- 2559:00 a.m. to 9:59 a.m.
- 14510:00 a.m. to 10:59 a.m.
- 6611:00 a.m. to 11:59 a.m.
- 7812:00 p.m. to 3:59 p.m.
- 454:00 p.m. to 11:59 p.m.

Occupations of males:
- Percentage of males in management occupations (except farmers):
Here: 31.3% city: 17.2%
- Percentage of males in business and financial operations occupations:
Here: 7.2% city: 8.9%
- Percentage of males in computer and mathematical occupations:
Here: 14.6% city: 14.6%
- Percentage of males in architecture and engineering occupations:
Here: 3.2% city: 4.0%
- Percentage of males in life, physical, and social science occupations:
Here: 2.4% city: 2.4%
- Percentage of males in community and social services occupations:
Here: 4.0% city: 1.0%
- Percentage of males in legal occupations:
Here: 1.4% city: 2.5%
- Percentage of males in education, training, and library occupations:
Here: 4.0% city: 3.4%
- Percentage of males in arts, design, entertainment, sports, and media occupations:
Here: 5.3% city: 4.9%
- Percentage of males in service occupations:
Here: 9.6% city: 11.8%
- Percentage of males in sales and office occupations:
Here: 10.8% city: 13.5%
- Percentage of males in production occupations:
Here: 3.0% city: 2.5%
Occupations of females:
- Percentage of females in management occupations (except farmers):
Here: 13.6% city: 15.8%
- Percentage of females in business and financial operations occupations:
Here: 27.5% city: 11.5%
- Percentage of females in computer and mathematical occupations:
Here: 3.6% city: 5.1%
- Percentage of females in architecture and engineering occupations:
Here: 1.9% city: 1.6%
- Percentage of females in life, physical, and social science occupations:
Here: 5.2% city: 2.9%
- Percentage of females in legal occupations:
Here: 2.4% city: 3.0%
- Percentage of females in education, training, and library occupations:
Here: 7.7% city: 7.1%
- Percentage of females in arts, design, entertainment, sports, and media occupations:
Here: 10.1% city: 5.1%
- Percentage of females in healthcare practitioners and technical occupations:
Here: 4.9% city: 8.4%
- Percentage of females in service occupations:
Here: 4.0% city: 15.4%
- Percentage of females in sales and office occupations:
Here: 16.6% city: 19.3%
- Percentage of females in production occupations:
Here: 1.8% city: 1.5%
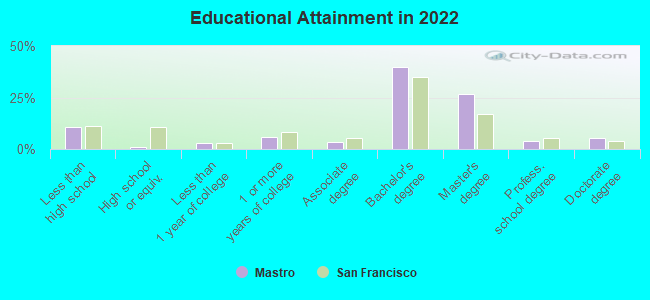
Education in this neighborhood (subdivision or community):
- Percentage of people 3 years and older in K-12 schools:
Mastro: 4.8% San Francisco: 9.7%
- Percentage of people 3 years and older in undergraduate colleges:
Mastro: 1.0% San Francisco: 4.8%
- Percentage of people 3 years and older in grad. or professional schools:
Mastro: 7.0% San Francisco: 2.6%
- Percentage of students K-12 enrolled in private schools:
Mastro: 16.8% San Francisco: 36.5%
Percentage of population below poverty level:
| Mastro: | 5.0% |
| San Francisco: | 10.4% |
Median year owner moved in (as recorded in 2022):
Median year renter moved in (as recorded in 2022):
| Mastro: | 2006 |
| San Francisco: | 2007 |
Median year renter moved in (as recorded in 2022):
| Mastro: | 2014 |
| San Francisco: | 2019 |
Percentage of married-couple families with both working:
| Mastro: | 108.0% |
| San Francisco: | 75.9% |
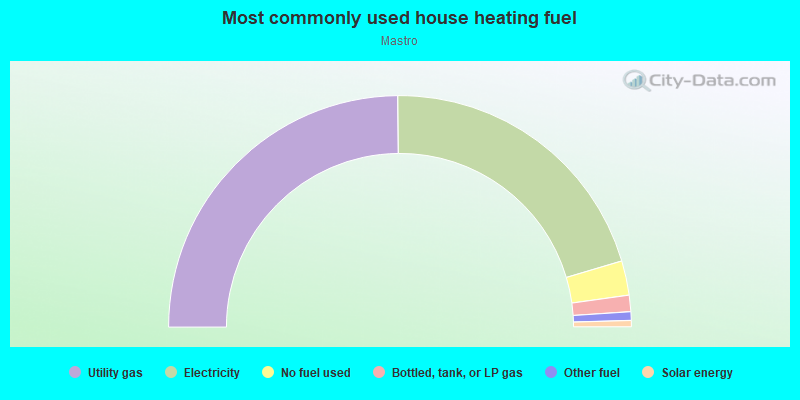
- 49.7%Utility gas
- 41.1%Electricity
- 4.8%No fuel used
- 2.3%Bottled, tank, or LP gas
- 1.2%Other fuel
- 0.9%Solar energy
Roads and streets:
Dolores St
Length: 1.40 miles
Directions: N-S, SE-NW, SW-NE
Address range: 1 to 649
Directions: N-S, SE-NW, SW-NE
Address range: 1 to 649
16th St
Length: 0.31 miles
Direction: E-W
Address range: 3300 to 3499
Direction: E-W
Address range: 3300 to 3499
15th St
Length: 0.23 miles
Direction: E-W
Address range: 1900 to 2049
Direction: E-W
Address range: 1900 to 2049
Landers St
Length: 0.22 miles
Directions: N-S, SE-NW
Address range: 1 to 199
Directions: N-S, SE-NW
Address range: 1 to 199
Church St
Length: 0.18 miles
Direction: N-S
Address range: 300 to 448
Direction: N-S
Address range: 300 to 448
Chula Ln
Length: 0.16 miles
Direction: E-W
Address range: 1 to 99
Direction: E-W
Address range: 1 to 99
Sharon St
Length: 0.11 miles
Direction: N-S
Address range: 1 to 99
Direction: N-S
Address range: 1 to 99
Alert Aly
Length: 0.08 miles
Direction: E-W
Address range: 1 to 99
Direction: E-W
Address range: 1 to 99
14th St
Length: 0.08 miles
Direction: E-W
Address range: 600 to 651
Direction: E-W
Address range: 600 to 651
17th St
Length: 0.06 miles
Direction: E-W
Address range: 3600 to 3639
Direction: E-W
Address range: 3600 to 3639
Abbey St
Length: 0.06 miles
Direction: N-S
Address range: 1 to 99
Direction: N-S
Address range: 1 to 99
Dehon St
Length: 0.02 miles
Direction: N-S
Address range: 1 to 99
Direction: N-S
Address range: 1 to 99
Harlow St
Length: 0.02 miles
Direction: N-S
Address range: 1 to 99
Direction: N-S
Address range: 1 to 99