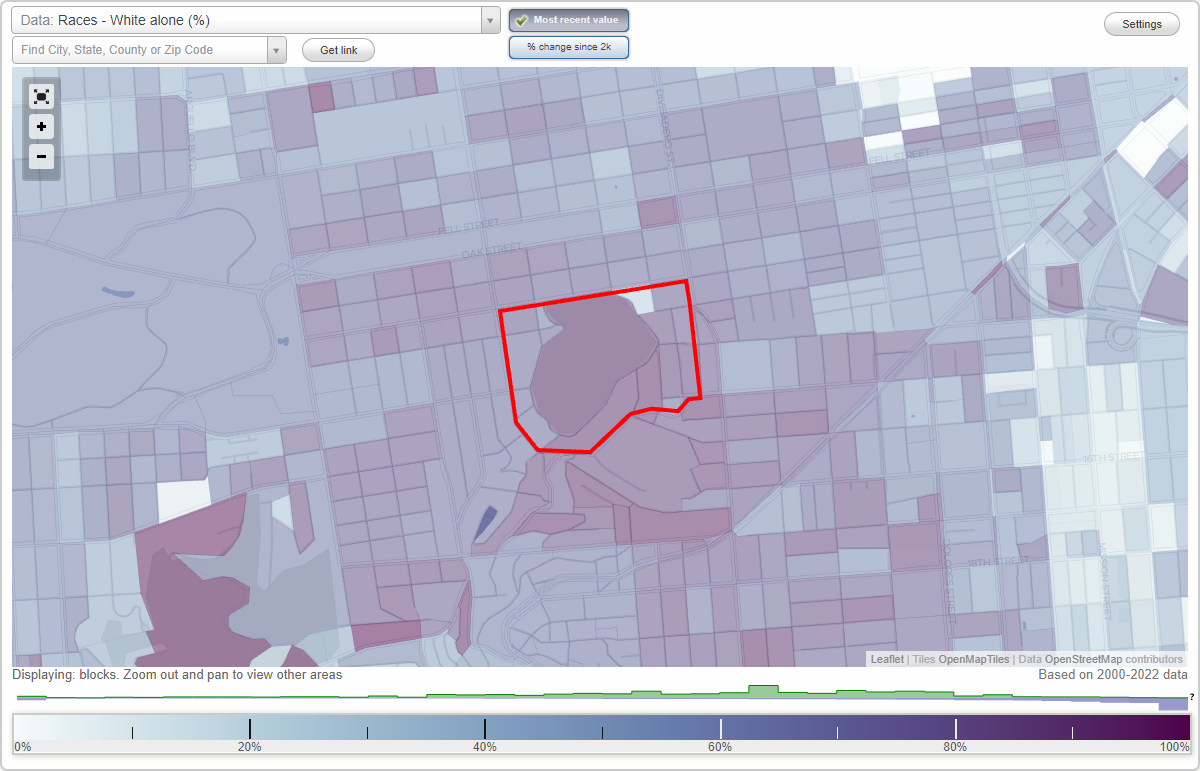
Buena Vista Park neighborhood in San Francisco, California (CA), 94117 detailed profile
Settings
X

Business Search - 14 Million verified businesses
Area: 0.138 square miles
Population: 2,053
Population density:
| Buena Vista Park: | 14,907 people per square mile |
| San Francisco: | 17,313 people per square mile |

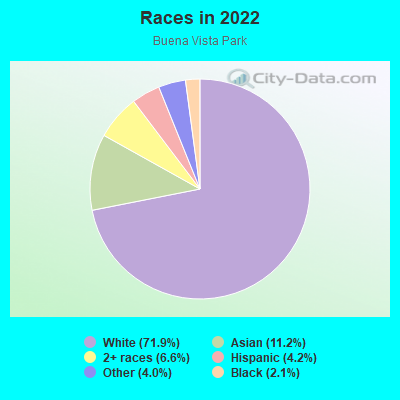
- 1,54171.9%White
- 23911.2%Asian
- 1426.6%Two or more races
- 894.2%Hispanic or Latino
- 854.0%Some other race
- 462.1%Black
Median household income in 2022:
| Buena Vista Park: | $250,001 |
| San Francisco: | $136,692 |
Distribution of median household income
![Distribution of median household income]()
- 36Less than $10,000
- 57$10,000 to $19,999
- 43$20,000 to $29,999
- 49$30,000 to $39,999
- 112$40,000 to $49,999
- 11$50,000 to $59,999
- 28$60,000 to $74,999
- 46$75,000 to $99,999
- 50$100,000 to $124,999
- 46$125,000 to $149,999
- 26$150,000 to $199,999
- 709$200,000 or more

Distribution of owner-occupied house/condo value
![Distribution of owner-occupied house/condo value]()
- 6$100,000 to $149,999
- 20$200,000 to $249,999
- 10$300,000 to $399,999
- 25$400,000 to $499,999
- 24$500,000 to $749,999
- 28$750,000 to $999,999
- 200$1,000,000 or more

Distribution of rent paid by renters
![Distribution of rent paid by renters]()
- 21$600 to $699
- 11$700 to $799
- 100$800 to $899
- 86$900 to $999
- 95$1,000 to $1,249
- 33$1,250 to $1,499
- 266$1,500 to $1,999
- 500$2,000 or more

Median rent in 2022:
| Buena Vista Park: | $2,953 |
| San Francisco: | $2,001 |
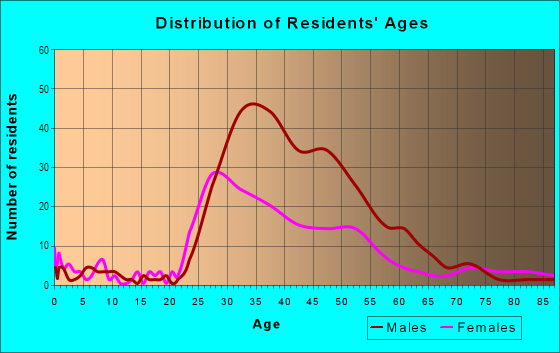
| Males: | 1,298 |
| Females: | 755 |
Males:
| This neighborhood: | 38.1 years |
| Whole city: | 40.3 years |
| This neighborhood: | 40.5 years |
| Whole city: | 40.5 years |
Average household size:
| Buena Vista Park: | 6.1 people |
| San Francisco: | 2.2 people |
Percentage of family households:
| Buena Vista Park: | 25.7% |
| San Francisco: | 30.3% |
| Here: | 32.2% |
| San Francisco: | 35.3% |
Percentage of married-couple families with children (among all households):
| Buena Vista Park: | 53.7% |
| San Francisco: | 35.9% |
Percentage of single-mother households (among all households):
| Buena Vista Park: | 17.0% |
| San Francisco: | 6.0% |
Percentage of never married males 15 years old and over:
Percentage of never married females 15 years old and over:
| Buena Vista Park: | 43.9% |
| San Francisco: | 24.6% |
Percentage of never married females 15 years old and over:
| Buena Vista Park: | 17.4% |
| city: | 19.9% |
Percentage of people that speak English not well or not at all:
| Buena Vista Park: | 0.3% |
| San Francisco: | 10.9% |
Percentage of people born in this state:
Percentage of people born in another U.S. state:
Percentage of native residents but born outside the U.S.:
Percentage of foreign born residents:
| Here: | 34.9% |
| San Francisco: | 40.8% |
Percentage of people born in another U.S. state:
| Buena Vista Park: | 50.3% |
| San Francisco: | 23.4% |
Percentage of native residents but born outside the U.S.:
| Here: | 2.8% |
| city: | 2.6% |
Percentage of foreign born residents:
| Here: | 11.9% |
| San Francisco: | 33.2% |
Owner-occupied
Renter-occupied

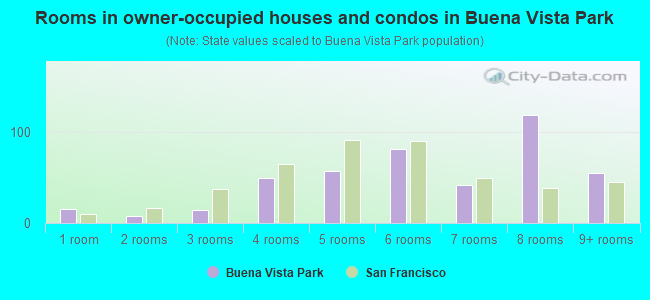
- Rooms in owner-occupied houses and condos in Buena Vista Park
- 151 room
- 82 rooms
- 143 rooms
- 504 rooms
- 575 rooms
- 826 rooms
- 427 rooms
- 1198 rooms
- 559+ rooms
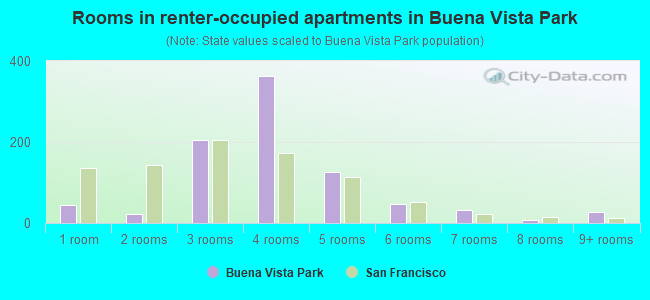
- Rooms in renter-occupied apartments in Buena Vista Park
- 451 room
- 222 rooms
- 2043 rooms
- 3634 rooms
- 1265 rooms
- 466 rooms
- 337 rooms
- 78 rooms
- 269+ rooms
Owner-occupied
Renter-occupied
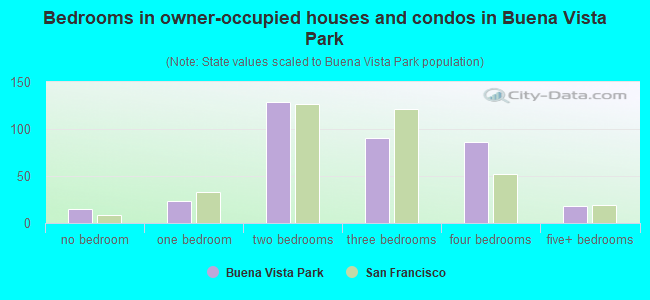
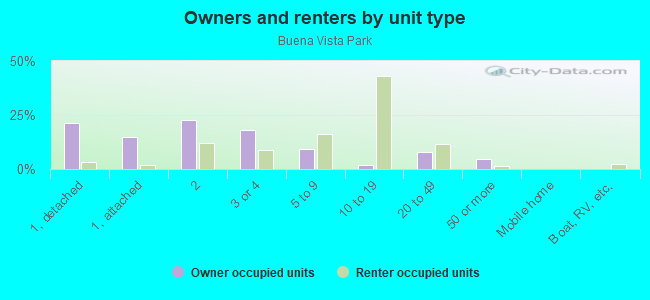
- Bedrooms in owner-occupied houses and condos in Buena Vista Park
- 15no bedroom
- 231 bedroom
- 1292 bedrooms
- 903 bedrooms
- 864 bedrooms
- 185+ bedrooms
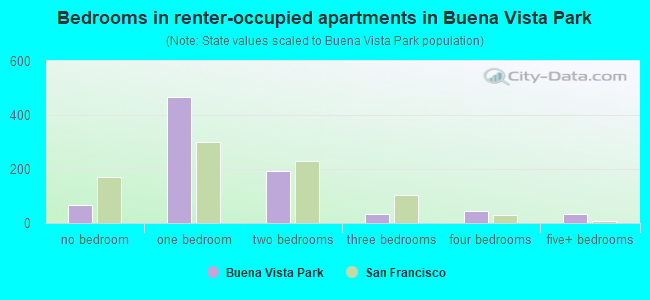
- Bedrooms in renter-occupied apartments in Buena Vista Park
- 68no bedroom
- 4661 bedroom
- 1922 bedrooms
- 343 bedrooms
- 454 bedrooms
- 355+ bedrooms
Average number of cars or other vehicles available in houses/condos:
Average number of cars or other vehicles available in apartments:
| This neighborhood: | 1.5 |
| San Francisco: | 1.5 |
Average number of cars or other vehicles available in apartments:
| Here: | 0.6 |
| city: | 0.8 |
Percentage of units with a mortgage:
| Buena Vista Park: | 49.6% |
| San Francisco: | 62.3% |
Housing prices:
- Average estimated value of detached houses in 2022 (11.2% of all units):
Buena Vista Park: $4,657,374 San Francisco: $1,942,973
- Average estimated value of townhouses or other attached units in 2022 (3.3% of all units):
This neighborhood: $1,498,313 city: $1,528,422
- Average estimated value of housing units in 2-unit structures in 2022 (22.0% of all units):
This neighborhood: $2,547,897 San Francisco: $1,536,932
- Average estimated '22 value of housing units in 3-to-4-unit structures (16.7% of all units):
Buena Vista Park: $1,707,981 city: $1,622,965
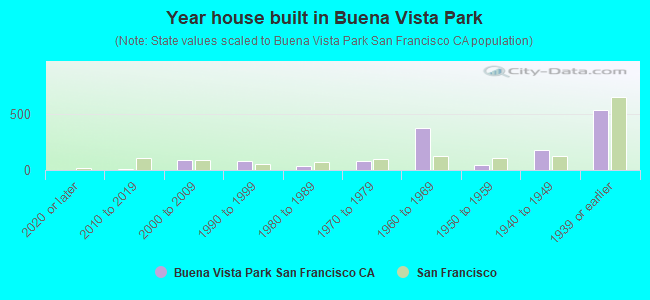
- Year house built in Buena Vista Park
- 02020 or later
- 82010 to 2019
- 892000 to 2009
- 791990 to 1999
- 361980 to 1989
- 851970 to 1979
- 3741960 to 1969
- 491950 to 1959
- 1791940 to 1949
- 5371939 or earlier
City-data.com crime index for city in 2020 (higher means more crime):
| City: | 387.4 |
| U.S. average: | 219.5 |
Travel time to work (commute)
![Travel time to work (commute)]()
- 41Less than 5 minutes
- 385 to 9 minutes
- 13710 to 14 minutes
- 13615 to 19 minutes
- 36620 to 24 minutes
- 13625 to 29 minutes
- 25230 to 34 minutes
- 4235 to 39 minutes
- 9440 to 44 minutes
- 20045 to 59 minutes
- 13860 to 89 minutes
- 5290 or more minutes

Means of transportation to work
![Means of transportation to work]()
- 16.0%260Drove a car alone
- 1.7%28Carpooled
- 34.5%560Bus
- 11.1%181Subway or elevated rail
- 3.7%60Long-distance train or commuter rail
- 2.2%35Light rail, streetcar or trolley
- 3.8%62Taxi
- 0.4%7Motorcycle
- 6.4%104Bicycle
- 2.3%37Walked
- 3.1%51Other means
- 18.7%304Worked at home

Time leaving home to go to work
![Time leaving home to go to work]()
- 212:00 a.m. to 4:59 a.m.
- 195:00 a.m. to 5:29 a.m.
- 295:30 a.m. to 5:59 a.m.
- 406:00 a.m. to 6:29 a.m.
- 1336:30 a.m. to 6:59 a.m.
- 1427:00 a.m. to 7:29 a.m.
- 2477:30 a.m. to 7:59 a.m.
- 2778:00 a.m. to 8:29 a.m.
- 2878:30 a.m. to 8:59 a.m.
- 2369:00 a.m. to 9:59 a.m.
- 7310:00 a.m. to 10:59 a.m.
- 4711:00 a.m. to 11:59 a.m.
- 4912:00 p.m. to 3:59 p.m.
- 614:00 p.m. to 11:59 p.m.

Occupations of males:
- Percentage of males in management occupations (except farmers):
Here: 17.1% city: 17.2%
- Percentage of males in business and financial operations occupations:
Here: 11.7% city: 8.9%
- Percentage of males in computer and mathematical occupations:
Here: 33.5% city: 14.6%
- Percentage of males in architecture and engineering occupations:
Here: 5.3% city: 4.0%
- Percentage of males in life, physical, and social science occupations:
Here: 4.6% city: 2.4%
- Percentage of males in community and social services occupations:
Here: 2.2% city: 1.0%
- Percentage of males in legal occupations:
Here: 6.2% city: 2.5%
- Percentage of males in education, training, and library occupations:
Here: 7.5% city: 3.4%
- Percentage of males in service occupations:
Here: 2.3% city: 11.8%
- Percentage of males in sales and office occupations:
Here: 13.4% city: 13.5%
- Percentage of males in construction, extraction, and maintenance occupations:
Here: 2.9% city: 3.1%
- Percentage of males in production occupations:
Here: 2.9% city: 2.5%
- Percentage of males in transportation occupations:
Here: 2.7% city: 3.4%
- Percentage of males in material moving occupations:
Here: 2.4% city: 1.8%
Occupations of females:
- Percentage of females in management occupations (except farmers):
Here: 14.8% city: 15.8%
- Percentage of females in business and financial operations occupations:
Here: 8.6% city: 11.5%
- Percentage of females in computer and mathematical occupations:
Here: 7.5% city: 5.1%
- Percentage of females in architecture and engineering occupations:
Here: 1.4% city: 1.6%
- Percentage of females in life, physical, and social science occupations:
Here: 5.4% city: 2.9%
- Percentage of females in community and social services occupations:
Here: 1.4% city: 1.6%
- Percentage of females in legal occupations:
Here: 10.0% city: 3.0%
- Percentage of females in education, training, and library occupations:
Here: 30.9% city: 7.1%
- Percentage of females in arts, design, entertainment, sports, and media occupations:
Here: 11.3% city: 5.1%
- Percentage of females in service occupations:
Here: 3.4% city: 15.4%
- Percentage of females in sales and office occupations:
Here: 7.7% city: 19.3%
- Percentage of females in construction, extraction, and maintenance occupations:
Here: 1.4% city: 0.1%
- Percentage of females in transportation occupations:
Here: 1.1% city: 0.8%
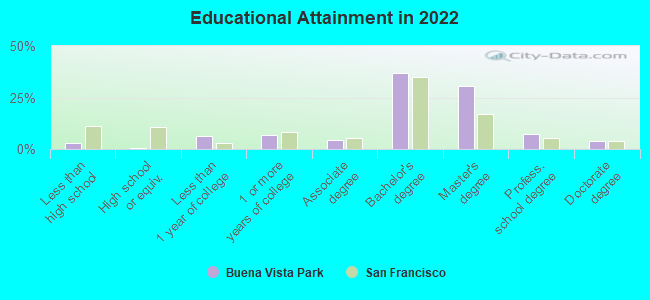
Education in this neighborhood (subdivision or community):
- Percentage of people 3 years and older in K-12 schools:
Buena Vista Park: 14.3% San Francisco: 9.7%
- Percentage of people 3 years and older in undergraduate colleges:
Buena Vista Park: 5.9% San Francisco: 4.8%
- Percentage of people 3 years and older in grad. or professional schools:
Buena Vista Park: 4.2% San Francisco: 2.6%
- Percentage of students K-12 enrolled in private schools:
Buena Vista Park: 62.5% San Francisco: 36.5%
Percentage of population below poverty level:
| Buena Vista Park: | 3.6% |
| San Francisco: | 10.4% |
Median year owner moved in (as recorded in 2022):
Median year renter moved in (as recorded in 2022):
| Buena Vista Park: | 2013 |
| San Francisco: | 2007 |
Median year renter moved in (as recorded in 2022):
| Buena Vista Park: | 2017 |
| San Francisco: | 2019 |
Percentage of married-couple families with both working:
| Buena Vista Park: | 139.6% |
| San Francisco: | 75.9% |
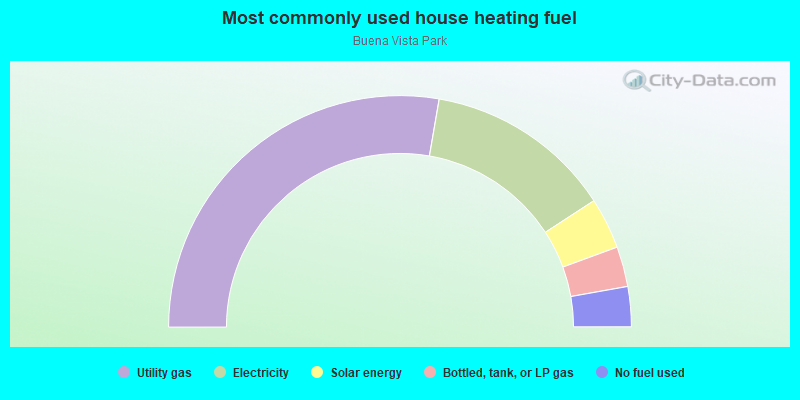
- 55.5%Utility gas
- 26.2%Electricity
- 7.2%Solar energy
- 5.6%Bottled, tank, or LP gas
- 5.6%No fuel used
Roads and streets:
Buena Vista Ave E
Length: 0.48 miles
Directions: E-W, N-S, SE-NW, SW-NE
Address range: 100 to 499
Directions: E-W, N-S, SE-NW, SW-NE
Address range: 100 to 499
Buena Vista Ave W
Length: 0.37 miles
Directions: E-W, N-S, SE-NW, SW-NE
Address range: 500 to 899
Directions: E-W, N-S, SE-NW, SW-NE
Address range: 500 to 899
Alpine Ter
Length: 0.21 miles
Direction: N-S
Address range: 1 to 199
Direction: N-S
Address range: 1 to 199
Waller St
Length: 0.15 miles
Directions: E-W, SW-NE
Address range: 847 to 998
Directions: E-W, SW-NE
Address range: 847 to 998
Buena Vista Ter
Length: 0.13 miles
Direction: N-S
Address range: 1 to 99
Direction: N-S
Address range: 1 to 99
14th St
Length: 0.12 miles
Direction: E-W
Address range: 1029 to 1099
Direction: E-W
Address range: 1029 to 1099
Duboce Ave
Length: 0.05 miles
Direction: E-W
Address range: 900 to 999
Direction: E-W
Address range: 900 to 999
Central Ave
Length: 0.04 miles
Direction: N-S
Address range: 1 to 49
Direction: N-S
Address range: 1 to 49