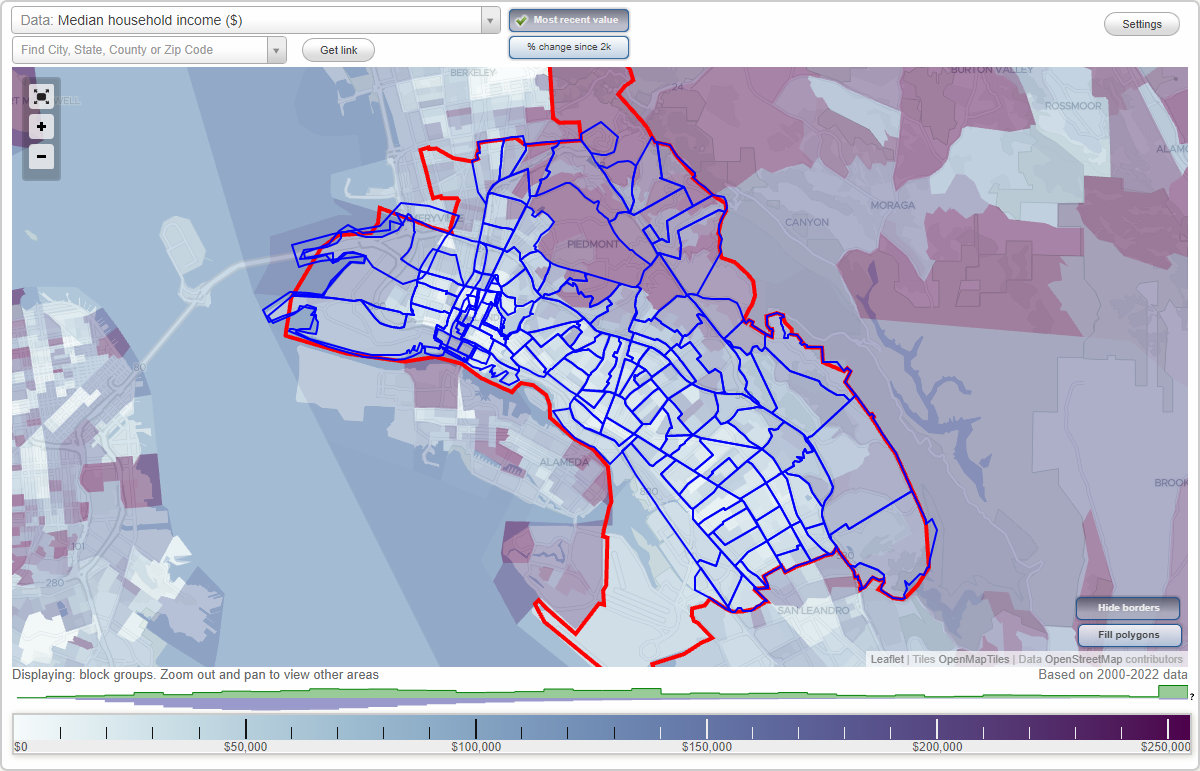
Oakland, California Neighborhood Map - Income, House Prices, Occupations, Boundaries
Settings
X

- City boundary
- Neighborhood boundaries
Business Search - 14 Million verified businesses
Neighborhoods:
Acorn Industrial, Adams Point, Allendale, Arroyo Viejo, Bartlett, Bella Vista, Broadway Auto Row, Brookfield Village, Bushrod, Caballo Hills, Castlemont, Chabot Park, Chinatown, City Center, Civic Center, Cleveland Heights, Clinton, Coliseum, Coliseum Industrial, Columbia Gardens, Cox, Crestmont, Crocker Highland, Dimond, Downtown, Durant Manor, East Peralta, Eastmont, Eastmont Hills, Elmhurst Park, Fairfax, Fairfax Business, Fairview Park, Fitchburg, Foothill Square, Forestland, Fremont, Frick, Fruitvale Station, Glen Highlands, Glenview, Gold Coast, Golf Links, Grand Lake, Hacienda, Harrington, Harrison Street, Havensourt, Hawthorne, Hegenberger, Highland, Highland Park, Highland Terrace, Hiller Highlands, Ironworks District, Iveywood, Ivy Hill, Jack London Square, Jefferson, Lake Merritt District, Lakeshore, Lakewide, Laney, Las Palmas, Laurel, Leona Heights, Lincoln Highlands, Lockwood Tevis, Loft District, MacArthur Maze, Maxwell Park, Mcclymonds, Meadow Brook, Melrose, Merritt, Merriwood, Mills College, Millsmont, Montclair, Montclair Business, Mosswood, North Kennedy Tract, North Stonehurst, Northgate, Oak Center, Oak Tree, Oakmore, Old City, Old Oakland, Patten, Piedmont Avenue, Piedmont Pines, Pill Hill, Prescott, Produce and Waterfront, Ralph Bunche, Rancho San Antonio, Redwood Heights, Rockridge, San Pablo Gateway, Sausal Creek, School, Seminary, Sequoyah, Shafter, Sheffield Village, Shepherd Canyon, Skyline - Hillcrest Estates, Sobrante Park, South Kennedy Tract, South Prescott, South Stonehurst, St. Elizabeth, Temescal, Toler Heights, Trestle Glen, Tuxedo, Upper Dimond, Upper Laurel, Upper Peralta Creek, Upper Rockridge, Uptown, Waterfront Warehouse District, Waverly, Webster, West Oakland, Woodland, WoodminsterAcorn Industrial neighborhood in Oakland statistics: (Find on map)
Area: 2.085 square miles
Population: 18,489
Population density:
Median household income in 2021:
Median rent in in 2021:
Male vs Females
Median age
Average estimated value of detached houses in 2021 (8.1% of all units):
Most popular occupations of males: service occupations (44.5%); management occupations (except farmers) (10.2%); healthcare practitioners and technical occupations (8.7%); material moving occupations (5.8%); transportation occupations (5.2%); sales and office occupations (4.9%); education, training, and library occupations (3.5%)
Most popular occupations of females: service occupations (42.9%); sales and office occupations (33.1%); management occupations (except farmers) (7.2%); education, training, and library occupations (4.9%); material moving occupations (4.1%); business and financial operations occupations (3.4%); healthcare practitioners and technical occupations (1.6%)
Limited-access highways (interstate or state) in this neighborhood: I- 880.
Roads and streets: Middle Harbor; 7th St; Middle Harbor Rd; 7th; 5th St; Embarcadero W (1st St); 3rd St; 10th St; Destroyer Way; 15th; Commodore Way; 4th St; Gang Way; 8th; Boatswain Way; Executive Way; 8th St; 6th St; 9th; Moorship Ave; Hull Way; Inventory Ave; Keel Way; Logistics Ln; Adeline; Adeline St; Village Cir; 11th; Union St; 3rd; 1st St; E H; Maritime St; 10th; Fleet Way; Filbert St; Anchor St (Anchor Way); Ferro St; Embarcadero (Magnolia St); Chestnut St; 2nd St; Market; Market St; Myrtle St (Embarcadero); 12th; Brush St; E E; Interstate 880 N; Kirkham St; Magnolia St; Inventory; 13th; Poplar Ct (Poplar Way); Mandela Pkwy; Linden St (Embarcadero); 11th St; 4th; 6th; 5th; Palm Ct.
Railroad features: Union Pacific RR; Bay Area Rapid Transit RR.
Acorn Industrial neighborhood detailed profile
Area: 2.085 square miles
Population: 18,489
Population density:
| Acorn Industrial: | 8,866 people per square mile |
| Oakland: | 7,739 people per square mile |
Median household income in 2021:
| Acorn Industrial: | $69,664 |
| Oakland: | $82,236 |
Median rent in in 2021:
| Acorn Industrial: | $604 |
| Oakland: | $1,617 |
Male vs Females
| Males: | 7,429 |
| Females: | 11,060 |
Median age
| Males: | 35.6 years |
| Females: | 34.8 years |
Average estimated value of detached houses in 2021 (8.1% of all units):
| Acorn Industrial: | $748,929 |
| Oakland: | $883,784 |
Most popular occupations of males: service occupations (44.5%); management occupations (except farmers) (10.2%); healthcare practitioners and technical occupations (8.7%); material moving occupations (5.8%); transportation occupations (5.2%); sales and office occupations (4.9%); education, training, and library occupations (3.5%)
Most popular occupations of females: service occupations (42.9%); sales and office occupations (33.1%); management occupations (except farmers) (7.2%); education, training, and library occupations (4.9%); material moving occupations (4.1%); business and financial operations occupations (3.4%); healthcare practitioners and technical occupations (1.6%)
Limited-access highways (interstate or state) in this neighborhood: I- 880.
Roads and streets: Middle Harbor; 7th St; Middle Harbor Rd; 7th; 5th St; Embarcadero W (1st St); 3rd St; 10th St; Destroyer Way; 15th; Commodore Way; 4th St; Gang Way; 8th; Boatswain Way; Executive Way; 8th St; 6th St; 9th; Moorship Ave; Hull Way; Inventory Ave; Keel Way; Logistics Ln; Adeline; Adeline St; Village Cir; 11th; Union St; 3rd; 1st St; E H; Maritime St; 10th; Fleet Way; Filbert St; Anchor St (Anchor Way); Ferro St; Embarcadero (Magnolia St); Chestnut St; 2nd St; Market; Market St; Myrtle St (Embarcadero); 12th; Brush St; E E; Interstate 880 N; Kirkham St; Magnolia St; Inventory; 13th; Poplar Ct (Poplar Way); Mandela Pkwy; Linden St (Embarcadero); 11th St; 4th; 6th; 5th; Palm Ct.
Railroad features: Union Pacific RR; Bay Area Rapid Transit RR.
Acorn Industrial neighborhood detailed profile
Adams Point neighborhood in Oakland statistics: (Find on map)
Area: 0.285 square miles
Population: 4,146
Population density:
Median household income in 2021:
Median rent in in 2021:
Male vs Females
Median age
Most popular occupations of males: service occupations (19.7%); material moving occupations (19.7%); management occupations (except farmers) (12.2%); healthcare practitioners and technical occupations (9.6%); computer and mathematical occupations (9.4%); life, physical, and social science occupations (7.7%); transportation occupations (6.6%)
Most popular occupations of females: service occupations (17.1%); management occupations (except farmers) (16.0%); education, training, and library occupations (14.6%); legal occupations (12.8%); sales and office occupations (12.1%); computer and mathematical occupations (8.3%); community and social services occupations (6.1%)
Limited-access highways (interstate or state) in this neighborhood: I- 580.
Roads and streets: Vernon St; Grand Ave; Van Buren Ave; Macarthur Blvd; Adams St; Euclid Ave; Perkins St; Bellevue Ave; Jayne Ave; Staten Ave; Lee St; Montecito Ave; Palm Ave; Warwick Ave; Lagunitas Ave; Belmont St; Burk St; Lenox Ave; Ellita Ave; Bay Pl; Perry Pl; Bay.
Adams Point neighborhood detailed profile
Area: 0.285 square miles
Population: 4,146
Population density:
| Adams Point: | 14,550 people per square mile |
| Oakland: | 7,739 people per square mile |
Median household income in 2021:
| Adams Point: | $107,398 |
| Oakland: | $82,236 |
Median rent in in 2021:
| Adams Point: | $1,728 |
| Oakland: | $1,617 |
Male vs Females
| Males: | 1,551 |
| Females: | 2,595 |
Median age
| Males: | 40.7 years |
| Females: | 36.3 years |
Most popular occupations of males: service occupations (19.7%); material moving occupations (19.7%); management occupations (except farmers) (12.2%); healthcare practitioners and technical occupations (9.6%); computer and mathematical occupations (9.4%); life, physical, and social science occupations (7.7%); transportation occupations (6.6%)
Most popular occupations of females: service occupations (17.1%); management occupations (except farmers) (16.0%); education, training, and library occupations (14.6%); legal occupations (12.8%); sales and office occupations (12.1%); computer and mathematical occupations (8.3%); community and social services occupations (6.1%)
Limited-access highways (interstate or state) in this neighborhood: I- 580.
Roads and streets: Vernon St; Grand Ave; Van Buren Ave; Macarthur Blvd; Adams St; Euclid Ave; Perkins St; Bellevue Ave; Jayne Ave; Staten Ave; Lee St; Montecito Ave; Palm Ave; Warwick Ave; Lagunitas Ave; Belmont St; Burk St; Lenox Ave; Ellita Ave; Bay Pl; Perry Pl; Bay.
Adams Point neighborhood detailed profile
Allendale neighborhood in Oakland statistics: (Find on map)
Area: 0.251 square miles
Population: 4,913
Population density:
Median household income in 2021:
Median rent in in 2021:
Male vs Females
Median age
Average estimated value of detached houses in 2021 (56.9% of all units):
Most popular occupations of males: service occupations (19.1%); construction, extraction, and maintenance occupations (12.6%); healthcare practitioners and technical occupations (11.9%); transportation occupations (9.4%); sales and office occupations (7.0%); business and financial operations occupations (5.5%); education, training, and library occupations (5.1%)
Most popular occupations of females: service occupations (19.4%); education, training, and library occupations (15.7%); sales and office occupations (14.8%); healthcare practitioners and technical occupations (11.1%); management occupations (except farmers) (8.5%); material moving occupations (8.3%); business and financial operations occupations (6.5%)
Roads and streets: High St; Suter St; Allendale Ave; Penniman Ave; High; Minna Ave; Eastman Ave; Octavia St; Viola St; 38th Ave; Abbey St; 38th; Porter St; Walnut St; Angelo Ave; Brookdale Ave; Liese Ave; Culver St; Short St; Fullington St; 39th Ave; Penniman Ct; Dale Pl; Marion Ave; Interstate 580 E; Maybelle Way; Vale Ave; Lorenzo Ave; Star Ave; Loma Vista Way; Over St; Culver Ct; Quigley Pl; Maybelle Ave (Maybelle Way); Dale.
Allendale neighborhood detailed profile
Area: 0.251 square miles
Population: 4,913
Population density:
| Allendale: | 19,610 people per square mile |
| Oakland: | 7,739 people per square mile |
Median household income in 2021:
| Allendale: | $85,776 |
| Oakland: | $82,236 |
Median rent in in 2021:
| Allendale: | $1,844 |
| Oakland: | $1,617 |
Male vs Females
| Males: | 2,105 |
| Females: | 2,807 |
Median age
| Males: | 33.2 years |
| Females: | 34.2 years |
Average estimated value of detached houses in 2021 (56.9% of all units):
| Allendale: | $460,191 |
| Oakland: | $883,784 |
Most popular occupations of males: service occupations (19.1%); construction, extraction, and maintenance occupations (12.6%); healthcare practitioners and technical occupations (11.9%); transportation occupations (9.4%); sales and office occupations (7.0%); business and financial operations occupations (5.5%); education, training, and library occupations (5.1%)
Most popular occupations of females: service occupations (19.4%); education, training, and library occupations (15.7%); sales and office occupations (14.8%); healthcare practitioners and technical occupations (11.1%); management occupations (except farmers) (8.5%); material moving occupations (8.3%); business and financial operations occupations (6.5%)
Roads and streets: High St; Suter St; Allendale Ave; Penniman Ave; High; Minna Ave; Eastman Ave; Octavia St; Viola St; 38th Ave; Abbey St; 38th; Porter St; Walnut St; Angelo Ave; Brookdale Ave; Liese Ave; Culver St; Short St; Fullington St; 39th Ave; Penniman Ct; Dale Pl; Marion Ave; Interstate 580 E; Maybelle Way; Vale Ave; Lorenzo Ave; Star Ave; Loma Vista Way; Over St; Culver Ct; Quigley Pl; Maybelle Ave (Maybelle Way); Dale.
Allendale neighborhood detailed profile
Arroyo Viejo neighborhood in Oakland statistics: (Find on map)
Area: 0.328 square miles
Population: 6,006
Population density:
Median household income in 2021:
Median rent in in 2021:
Male vs Females
Median age
Average estimated value of detached houses in 2021 (62.6% of all units):
Most popular occupations of males: service occupations (21.4%); sales and office occupations (20.0%); construction, extraction, and maintenance occupations (14.2%); material moving occupations (14.1%); production occupations (6.1%); management occupations (except farmers) (5.9%); transportation occupations (4.9%)
Most popular occupations of females: service occupations (35.3%); sales and office occupations (31.2%); management occupations (except farmers) (10.1%); community and social services occupations (6.1%); production occupations (5.7%); education, training, and library occupations (4.7%); transportation occupations (3.0%)
Highways in this neighborhood: State Hwy 185 (International Blvd, E 14th St).
Roads and streets: 81st Ave; 78th Ave; 79th Ave; Holly St; 82nd Ave; 80th Ave; 77th Ave; International Blvd; 74th Ave; 76th Ave; Olive St; Plymouth St; Sunshine Ct; Arthur St; Dashwood Ave; Krause Ave; Alder St; Maywood Ave; Lockwood St; Ash St; Halliday Ave; Weld St; Locust St; Birch St; Legion Ave; Deerwood Ave; Ritchie St; 82nd.
Arroyo Viejo neighborhood detailed profile
Area: 0.328 square miles
Population: 6,006
Population density:
| Arroyo Viejo: | 18,316 people per square mile |
| Oakland: | 7,739 people per square mile |
Median household income in 2021:
| Arroyo Viejo: | $56,047 |
| Oakland: | $82,236 |
Median rent in in 2021:
| Arroyo Viejo: | $1,433 |
| Oakland: | $1,617 |
Male vs Females
| Males: | 3,082 |
| Females: | 2,924 |
Median age
| Males: | 33.3 years |
| Females: | 32.6 years |
Average estimated value of detached houses in 2021 (62.6% of all units):
| Arroyo Viejo: | $492,013 |
| Oakland: | $883,784 |
Most popular occupations of males: service occupations (21.4%); sales and office occupations (20.0%); construction, extraction, and maintenance occupations (14.2%); material moving occupations (14.1%); production occupations (6.1%); management occupations (except farmers) (5.9%); transportation occupations (4.9%)
Most popular occupations of females: service occupations (35.3%); sales and office occupations (31.2%); management occupations (except farmers) (10.1%); community and social services occupations (6.1%); production occupations (5.7%); education, training, and library occupations (4.7%); transportation occupations (3.0%)
Highways in this neighborhood: State Hwy 185 (International Blvd, E 14th St).
Roads and streets: 81st Ave; 78th Ave; 79th Ave; Holly St; 82nd Ave; 80th Ave; 77th Ave; International Blvd; 74th Ave; 76th Ave; Olive St; Plymouth St; Sunshine Ct; Arthur St; Dashwood Ave; Krause Ave; Alder St; Maywood Ave; Lockwood St; Ash St; Halliday Ave; Weld St; Locust St; Birch St; Legion Ave; Deerwood Ave; Ritchie St; 82nd.
Arroyo Viejo neighborhood detailed profile
Bartlett neighborhood in Oakland statistics: (Find on map)
Area: 0.246 square miles
Population: 11,791
Population density:
Median household income in 2021:
Median rent in in 2021:
Male vs Females
Median age
Average estimated value of detached houses in 2021 (35.6% of all units):
Most popular occupations of males: service occupations (31.3%); sales and office occupations (22.2%); construction, extraction, and maintenance occupations (9.3%); healthcare practitioners and technical occupations (8.7%); production occupations (8.6%); education, training, and library occupations (4.3%); management occupations (except farmers) (3.1%)
Most popular occupations of females: service occupations (21.4%); sales and office occupations (18.8%); business and financial operations occupations (14.9%); education, training, and library occupations (9.5%); management occupations (except farmers) (9.2%); community and social services occupations (7.9%); computer and mathematical occupations (7.3%)
Limited-access highways (interstate or state) in this neighborhood: I- 580.
Roads and streets: 35th Ave; Humboldt Ave; Bartlett St; Suter St; School St; Maple Ave; Pleitner Ave; Curran Ave; Interstate 580 E; Arkansas St; Berlin Way; Nicol Ave; Brookdale Ave; Texas St; Laurel Ave; Deering St; Lynde St; Penniman Ave; 35th; Ward Ln; Henrietta St; Arkansas; Curran.
Other features: Perlata Crk.
Bartlett neighborhood detailed profile
Area: 0.246 square miles
Population: 11,791
Population density:
| Bartlett: | 47,959 people per square mile |
| Oakland: | 7,739 people per square mile |
Median household income in 2021:
| Bartlett: | $83,170 |
| Oakland: | $82,236 |
Median rent in in 2021:
| Bartlett: | $1,599 |
| Oakland: | $1,617 |
Male vs Females
| Males: | 5,752 |
| Females: | 6,038 |
Median age
| Males: | 35.8 years |
| Females: | 33.0 years |
Average estimated value of detached houses in 2021 (35.6% of all units):
| Bartlett: | $439,512 |
| Oakland: | $883,784 |
Most popular occupations of males: service occupations (31.3%); sales and office occupations (22.2%); construction, extraction, and maintenance occupations (9.3%); healthcare practitioners and technical occupations (8.7%); production occupations (8.6%); education, training, and library occupations (4.3%); management occupations (except farmers) (3.1%)
Most popular occupations of females: service occupations (21.4%); sales and office occupations (18.8%); business and financial operations occupations (14.9%); education, training, and library occupations (9.5%); management occupations (except farmers) (9.2%); community and social services occupations (7.9%); computer and mathematical occupations (7.3%)
Limited-access highways (interstate or state) in this neighborhood: I- 580.
Roads and streets: 35th Ave; Humboldt Ave; Bartlett St; Suter St; School St; Maple Ave; Pleitner Ave; Curran Ave; Interstate 580 E; Arkansas St; Berlin Way; Nicol Ave; Brookdale Ave; Texas St; Laurel Ave; Deering St; Lynde St; Penniman Ave; 35th; Ward Ln; Henrietta St; Arkansas; Curran.
Other features: Perlata Crk.
Bartlett neighborhood detailed profile
Bella Vista neighborhood in Oakland statistics: (Find on map)
Area: 0.081 square miles
Population: 1,490
Population density:
Median household income in 2021:
Median rent in in 2021:
Male vs Females
Median age
Average estimated value of detached houses in 2021 (26.1% of all units):
Most popular occupations of males: sales and office occupations (17.5%); healthcare practitioners and technical occupations (14.4%); service occupations (10.5%); management occupations (except farmers) (9.6%); arts, design, entertainment, sports, and media occupations (8.8%); construction, extraction, and maintenance occupations (8.6%); transportation occupations (7.2%)
Most popular occupations of females: healthcare practitioners and technical occupations (25.7%); management occupations (except farmers) (23.4%); service occupations (12.6%); sales and office occupations (6.9%); material moving occupations (6.2%); arts, design, entertainment, sports, and media occupations (6.1%); computer and mathematical occupations (5.1%)
Roads and streets: 13th Ave; Bella Vista Ave; E 28th St; 11th Ave; Bayview Ave.
Bella Vista neighborhood detailed profile
Area: 0.081 square miles
Population: 1,490
Population density:
| Bella Vista: | 18,320 people per square mile |
| Oakland: | 7,739 people per square mile |
Median household income in 2021:
| Bella Vista: | $83,572 |
| Oakland: | $82,236 |
Median rent in in 2021:
| Bella Vista: | $1,432 |
| Oakland: | $1,617 |
Male vs Females
| Males: | 715 |
| Females: | 774 |
Median age
| Males: | 35.9 years |
| Females: | 39.9 years |
Average estimated value of detached houses in 2021 (26.1% of all units):
| Bella Vista: | $720,312 |
| Oakland: | $883,784 |
Most popular occupations of males: sales and office occupations (17.5%); healthcare practitioners and technical occupations (14.4%); service occupations (10.5%); management occupations (except farmers) (9.6%); arts, design, entertainment, sports, and media occupations (8.8%); construction, extraction, and maintenance occupations (8.6%); transportation occupations (7.2%)
Most popular occupations of females: healthcare practitioners and technical occupations (25.7%); management occupations (except farmers) (23.4%); service occupations (12.6%); sales and office occupations (6.9%); material moving occupations (6.2%); arts, design, entertainment, sports, and media occupations (6.1%); computer and mathematical occupations (5.1%)
Roads and streets: 13th Ave; Bella Vista Ave; E 28th St; 11th Ave; Bayview Ave.
Bella Vista neighborhood detailed profile
Broadway Auto Row neighborhood in Oakland statistics: (Find on map)
Area: 0.015 square miles
Roads and streets: Bay Pl (27th St); Valdez; 26th St; 27th.
Broadway Auto Row neighborhood detailed profile
Area: 0.015 square miles
Roads and streets: Bay Pl (27th St); Valdez; 26th St; 27th.
Broadway Auto Row neighborhood detailed profile
Brookfield Village neighborhood in Oakland statistics: (Find on map)
Area: 0.397 square miles
Population: 4,823
Population density:
Median household income in 2021:
Median rent in in 2021:
Male vs Females
Median age
Housing prices:
Average estimated value of detached houses in 2021 (82.5% of all units):
Average estimated value of townhouses or other attached units in 2021 (2.5% of all units):
Most popular occupations of males: service occupations (21.0%); transportation occupations (15.5%); material moving occupations (13.6%); construction, extraction, and maintenance occupations (10.9%); sales and office occupations (10.5%); management occupations (except farmers) (7.9%); computer and mathematical occupations (5.5%)
Most popular occupations of females: sales and office occupations (29.2%); service occupations (24.2%); business and financial operations occupations (8.3%); education, training, and library occupations (7.6%); management occupations (except farmers) (6.6%); community and social services occupations (6.6%); healthcare practitioners and technical occupations (5.8%)
Limited-access highways (interstate or state) in this neighborhood: State Hwy 17 (Nimitz Fwy, I- 880).
Roads and streets: Edes Ave; 98th Ave; Clara St; Douglas Ave; Hunter Ave; Interstate 880 N; Bernhardt Dr; Ghormley Ave; Maddux Dr; Walter Ave; Caswell Ave; St Elmo Dr; 98th; Darien Ave; Stoneford Ave; Burlwood Ave; Kerwin Ave; Ashton Ave; Hale Ave; Isleton Ave; Edes; Jones Ave; Eldridge Ave; S Elmhurst Ave; Louvaine Ave; Foster Ave; Tyler St; Worth St; el Verano St; Lyndhurst St; Denny St; Nevada St; Hazelwood Ct; Cary Ave; Cary; Denslowe St; Malta Ct; Norgren St; Cary Ct; Rossmoor Ave; Rossmoor Ct; Oscar Ave; Hunter Ct; Clara Ct; Foster Ct.
Railroad features: Union Pacific RR.
Brookfield Village neighborhood detailed profile
Area: 0.397 square miles
Population: 4,823
Population density:
| Brookfield Village: | 12,139 people per square mile |
| Oakland: | 7,739 people per square mile |
Median household income in 2021:
| Brookfield Village: | $71,472 |
| Oakland: | $82,236 |
Median rent in in 2021:
| Brookfield Village: | $1,367 |
| Oakland: | $1,617 |
Male vs Females
| Males: | 2,263 |
| Females: | 2,559 |
Median age
| Males: | 33.1 years |
| Females: | 31.8 years |
Housing prices:
Average estimated value of detached houses in 2021 (82.5% of all units):
| Brookfield Village: | $421,102 |
| Oakland: | $883,784 |
Average estimated value of townhouses or other attached units in 2021 (2.5% of all units):
| This neighborhood: | $525,120 |
| city: | $744,263 |
Most popular occupations of males: service occupations (21.0%); transportation occupations (15.5%); material moving occupations (13.6%); construction, extraction, and maintenance occupations (10.9%); sales and office occupations (10.5%); management occupations (except farmers) (7.9%); computer and mathematical occupations (5.5%)
Most popular occupations of females: sales and office occupations (29.2%); service occupations (24.2%); business and financial operations occupations (8.3%); education, training, and library occupations (7.6%); management occupations (except farmers) (6.6%); community and social services occupations (6.6%); healthcare practitioners and technical occupations (5.8%)
Limited-access highways (interstate or state) in this neighborhood: State Hwy 17 (Nimitz Fwy, I- 880).
Roads and streets: Edes Ave; 98th Ave; Clara St; Douglas Ave; Hunter Ave; Interstate 880 N; Bernhardt Dr; Ghormley Ave; Maddux Dr; Walter Ave; Caswell Ave; St Elmo Dr; 98th; Darien Ave; Stoneford Ave; Burlwood Ave; Kerwin Ave; Ashton Ave; Hale Ave; Isleton Ave; Edes; Jones Ave; Eldridge Ave; S Elmhurst Ave; Louvaine Ave; Foster Ave; Tyler St; Worth St; el Verano St; Lyndhurst St; Denny St; Nevada St; Hazelwood Ct; Cary Ave; Cary; Denslowe St; Malta Ct; Norgren St; Cary Ct; Rossmoor Ave; Rossmoor Ct; Oscar Ave; Hunter Ct; Clara Ct; Foster Ct.
Railroad features: Union Pacific RR.
Brookfield Village neighborhood detailed profile
Bushrod neighborhood in Oakland statistics: (Find on map)
Area: 0.445 square miles
Population: 7,931
Population density:
Median household income in 2021:
Median rent in in 2021:
Male vs Females
Median age
Housing prices:
Average estimated value of detached houses in 2021 (44.8% of all units):
Average estimated value of townhouses or other attached units in 2021 (9.4% of all units):
Average estimated value of housing units in 2-unit structures in 2021 (12.1% of all units):
Average estimated '21 value of housing units in 3-to-4-unit structures (16.0% of all units):
Average estimated '21 value of housing units in 5-or-more-unit structures (15.8% of all units):
Most popular occupations of males: sales and office occupations (13.8%); management occupations (except farmers) (12.8%); service occupations (10.5%); computer and mathematical occupations (10.3%); education, training, and library occupations (8.9%); business and financial operations occupations (8.0%); production occupations (6.4%)
Most popular occupations of females: sales and office occupations (17.4%); management occupations (except farmers) (16.3%); service occupations (14.7%); education, training, and library occupations (13.2%); business and financial operations occupations (8.0%); healthcare practitioners and technical occupations (6.7%); arts, design, entertainment, sports, and media occupations (6.3%)
Roads and streets: Dover St; Shattuck Ave; Martin Luther King Jr Way; 61st St; 62nd St; 58th St; Alcatraz Ave; 63rd St; Aileen St; Shattuck; 60th St; 59th St; 56th St; 55th St; 57th St; Martin Luther King Jr; 65th St; 54th St; Alcatraz; 66th St; Racine St; 53rd St; Maccall St; Market St (Poirier St); Fairview St; Whitney St; 52nd St; Carberry Ave; Raymond St; Tremont St; Irwin Ct; Deakin St; Woolsey St; Wheeler St; Dover; 52nd; Racine.
Bushrod neighborhood detailed profile
Area: 0.445 square miles
Population: 7,931
Population density:
| Bushrod: | 17,820 people per square mile |
| Oakland: | 7,739 people per square mile |
Median household income in 2021:
| Bushrod: | $119,407 |
| Oakland: | $82,236 |
Median rent in in 2021:
| Bushrod: | $2,036 |
| Oakland: | $1,617 |
Male vs Females
| Males: | 3,707 |
| Females: | 4,224 |
Median age
| Males: | 35.4 years |
| Females: | 35.5 years |
Housing prices:
Average estimated value of detached houses in 2021 (44.8% of all units):
| Bushrod: | $830,822 |
| Oakland: | $883,784 |
Average estimated value of townhouses or other attached units in 2021 (9.4% of all units):
| This neighborhood: | $834,579 |
| city: | $744,263 |
Average estimated value of housing units in 2-unit structures in 2021 (12.1% of all units):
| This neighborhood: | $455,185 |
| Oakland: | $732,452 |
Average estimated '21 value of housing units in 3-to-4-unit structures (16.0% of all units):
| Bushrod: | $858,696 |
| city: | $699,145 |
Average estimated '21 value of housing units in 5-or-more-unit structures (15.8% of all units):
| Bushrod: | $523,810 |
| Oakland: | $622,418 |
Most popular occupations of males: sales and office occupations (13.8%); management occupations (except farmers) (12.8%); service occupations (10.5%); computer and mathematical occupations (10.3%); education, training, and library occupations (8.9%); business and financial operations occupations (8.0%); production occupations (6.4%)
Most popular occupations of females: sales and office occupations (17.4%); management occupations (except farmers) (16.3%); service occupations (14.7%); education, training, and library occupations (13.2%); business and financial operations occupations (8.0%); healthcare practitioners and technical occupations (6.7%); arts, design, entertainment, sports, and media occupations (6.3%)
Roads and streets: Dover St; Shattuck Ave; Martin Luther King Jr Way; 61st St; 62nd St; 58th St; Alcatraz Ave; 63rd St; Aileen St; Shattuck; 60th St; 59th St; 56th St; 55th St; 57th St; Martin Luther King Jr; 65th St; 54th St; Alcatraz; 66th St; Racine St; 53rd St; Maccall St; Market St (Poirier St); Fairview St; Whitney St; 52nd St; Carberry Ave; Raymond St; Tremont St; Irwin Ct; Deakin St; Woolsey St; Wheeler St; Dover; 52nd; Racine.
Bushrod neighborhood detailed profile
Caballo Hills neighborhood in Oakland statistics: (Find on map)
Area: 1.368 square miles
Population: 615
Population density:
Median household income in 2021:
Median rent in in 2021:
Male vs Females
Median age
Housing prices:
Average estimated value of detached houses in 2021 (23.3% of all units):
Average estimated value of townhouses or other attached units in 2021 (23.1% of all units):
Average estimated '21 value of housing units in 3-to-4-unit structures (37.5% of all units):
Average estimated '21 value of housing units in 5-or-more-unit structures (7.8% of all units):
Most popular occupations of males: computer and mathematical occupations (16.3%); service occupations (15.8%); transportation occupations (14.1%); material moving occupations (13.6%); management occupations (except farmers) (11.6%); healthcare practitioners and technical occupations (5.7%); sales and office occupations (4.6%)
Most popular occupations of females: sales and office occupations (30.2%); arts, design, entertainment, sports, and media occupations (16.2%); computer and mathematical occupations (14.8%); management occupations (except farmers) (9.5%); service occupations (8.6%); business and financial operations occupations (8.3%); education, training, and library occupations (6.3%)
Limited-access highways (interstate or state) in this neighborhood: I- 580.
Roads and streets: Campus Dr; Margie Ln; Campus; Mountain Blvd; Mountain; Ridgemont Dr; Interstate 580 E; Altura Pl; Viewcrest Dr; Keb Rd; O Hanneson Rd; Maynard Ave; Stoneridge Ct; Crystal Ridge Ct; Ohanneson Rd; Ridgemont Ct; Keller Ave; Sanford St; Rifle Ln; Calderwood Ct; Keller; Rockingham Ct; Crown Ridge Ct; Viewcrest Ct; High Knoll Dr; Rising Hill Ct; Avonoak Ct; Altura; Crystal Ridge; Edwards Ave; St Cloud Ct; Sunkist; View Crest Dr; Chamberlin Ct; O Hanneson.
Caballo Hills neighborhood detailed profile
Area: 1.368 square miles
Population: 615
Population density:
| Caballo Hills: | 450 people per square mile |
| Oakland: | 7,739 people per square mile |
Median household income in 2021:
| Caballo Hills: | $131,074 |
| Oakland: | $82,236 |
Median rent in in 2021:
| Caballo Hills: | $1,969 |
| Oakland: | $1,617 |
Male vs Females
| Males: | 300 |
| Females: | 314 |
Median age
| Males: | 45.8 years |
| Females: | 43.1 years |
Housing prices:
Average estimated value of detached houses in 2021 (23.3% of all units):
| Caballo Hills: | $683,491 |
| Oakland: | $883,784 |
Average estimated value of townhouses or other attached units in 2021 (23.1% of all units):
| This neighborhood: | $665,882 |
| city: | $744,263 |
Average estimated '21 value of housing units in 3-to-4-unit structures (37.5% of all units):
| Caballo Hills: | $582,989 |
| city: | $699,145 |
Average estimated '21 value of housing units in 5-or-more-unit structures (7.8% of all units):
| Caballo Hills: | $1,059,719 |
| Oakland: | $622,418 |
Most popular occupations of males: computer and mathematical occupations (16.3%); service occupations (15.8%); transportation occupations (14.1%); material moving occupations (13.6%); management occupations (except farmers) (11.6%); healthcare practitioners and technical occupations (5.7%); sales and office occupations (4.6%)
Most popular occupations of females: sales and office occupations (30.2%); arts, design, entertainment, sports, and media occupations (16.2%); computer and mathematical occupations (14.8%); management occupations (except farmers) (9.5%); service occupations (8.6%); business and financial operations occupations (8.3%); education, training, and library occupations (6.3%)
Limited-access highways (interstate or state) in this neighborhood: I- 580.
Roads and streets: Campus Dr; Margie Ln; Campus; Mountain Blvd; Mountain; Ridgemont Dr; Interstate 580 E; Altura Pl; Viewcrest Dr; Keb Rd; O Hanneson Rd; Maynard Ave; Stoneridge Ct; Crystal Ridge Ct; Ohanneson Rd; Ridgemont Ct; Keller Ave; Sanford St; Rifle Ln; Calderwood Ct; Keller; Rockingham Ct; Crown Ridge Ct; Viewcrest Ct; High Knoll Dr; Rising Hill Ct; Avonoak Ct; Altura; Crystal Ridge; Edwards Ave; St Cloud Ct; Sunkist; View Crest Dr; Chamberlin Ct; O Hanneson.
Caballo Hills neighborhood detailed profile
Castlemont neighborhood in Oakland statistics: (Find on map)
Area: 0.268 square miles
Population: 4,316
Population density:
Median household income in 2021:
Median rent in in 2021:
Male vs Females
Median age
Housing prices:
Average estimated value of detached houses in 2021 (42.8% of all units):
Average estimated value of townhouses or other attached units in 2021 (9.6% of all units):
Most popular occupations of males: construction, extraction, and maintenance occupations (33.2%); service occupations (24.8%); production occupations (8.0%); transportation occupations (7.1%); computer and mathematical occupations (4.8%); business and financial operations occupations (4.4%); healthcare practitioners and technical occupations (3.7%)
Most popular occupations of females: service occupations (26.4%); sales and office occupations (17.2%); business and financial operations occupations (12.0%); management occupations (except farmers) (9.3%); production occupations (7.9%); architecture and engineering occupations (7.7%); transportation occupations (6.9%)
Roads and streets: Bancroft Ave; Bancroft; Hillside St; Dowling St; Peach St; 88th Ave; 84th Ave; 85th Ave; 98th Ave; 90th Ave; 90th; 86th Ave; Auseon Ave; 83rd Ave; 87th Ave; 94th Ave; 96th Ave; Iris St; 92nd Ave; Elmview Dr; 89th Ave; 98th; Hillgrade Ct; Dowling.
Castlemont neighborhood detailed profile
Area: 0.268 square miles
Population: 4,316
Population density:
| Castlemont: | 16,086 people per square mile |
| Oakland: | 7,739 people per square mile |
Median household income in 2021:
| Castlemont: | $49,041 |
| Oakland: | $82,236 |
Median rent in in 2021:
| Castlemont: | $1,400 |
| Oakland: | $1,617 |
Male vs Females
| Males: | 2,182 |
| Females: | 2,133 |
Median age
| Males: | 30.2 years |
| Females: | 31.3 years |
Housing prices:
Average estimated value of detached houses in 2021 (42.8% of all units):
| Castlemont: | $414,739 |
| Oakland: | $883,784 |
Average estimated value of townhouses or other attached units in 2021 (9.6% of all units):
| This neighborhood: | $411,111 |
| city: | $744,263 |
Most popular occupations of males: construction, extraction, and maintenance occupations (33.2%); service occupations (24.8%); production occupations (8.0%); transportation occupations (7.1%); computer and mathematical occupations (4.8%); business and financial operations occupations (4.4%); healthcare practitioners and technical occupations (3.7%)
Most popular occupations of females: service occupations (26.4%); sales and office occupations (17.2%); business and financial operations occupations (12.0%); management occupations (except farmers) (9.3%); production occupations (7.9%); architecture and engineering occupations (7.7%); transportation occupations (6.9%)
Roads and streets: Bancroft Ave; Bancroft; Hillside St; Dowling St; Peach St; 88th Ave; 84th Ave; 85th Ave; 98th Ave; 90th Ave; 90th; 86th Ave; Auseon Ave; 83rd Ave; 87th Ave; 94th Ave; 96th Ave; Iris St; 92nd Ave; Elmview Dr; 89th Ave; 98th; Hillgrade Ct; Dowling.
Castlemont neighborhood detailed profile
Chabot Park neighborhood in Oakland statistics: (Find on map)
Area: 2.161 square miles
Population: 4,233
Population density:
Median household income in 2021:
Median rent in in 2021:
Male vs Females
Median age
Housing prices:
Average estimated value of detached houses in 2021 (96.9% of all units):
Most popular occupations of males: sales and office occupations (20.7%); computer and mathematical occupations (11.3%); management occupations (except farmers) (10.9%); transportation occupations (10.8%); architecture and engineering occupations (10.6%); life, physical, and social science occupations (6.6%); arts, design, entertainment, sports, and media occupations (6.2%)
Most popular occupations of females: sales and office occupations (23.9%); education, training, and library occupations (18.1%); healthcare practitioners and technical occupations (13.0%); business and financial operations occupations (12.7%); management occupations (except farmers) (9.1%); service occupations (8.5%); arts, design, entertainment, sports, and media occupations (4.5%)
Limited-access highways (interstate or state) in this neighborhood: I- 580.
Roads and streets: Malcolm Ave; Golf Links Rd; Lochard St; Sun Valley Dr; Foothill Blvd; Ettrick St; Elvessa St; Scotia Ave; Monan St; Skyline Trl (Grass Valley Rd); Stacy St; Peralta Oaks Dr; Kerrigan Dr; Shetland Ave; Covington Dr; Glen Manor Pl; Commonwealth Dr; Dunkirk Ave; Lowrey Rd; Mac Arthur; Turner Ave; Ziegler Ave; Montwood Way; Cameron Ave; Cliffland Ave; Skyline Blvd; Aberfoil Ave; Cotter St; Glen Artney St; Caloden St; Bemis St; Hellman; Interstate 580 E; Dingley St; Golf Links; Snowdown Ave; Sheldon St; Greenbrier St; Turner Ct; Barrett St; Tate Ter; Maggiora Dr; 107th Ave; Peralta Oaks Ct; Roderick Rd; Leamont Ct; Overmoor St; 106th Ave; Grass Valley Ct; Mark St; Woodcliff Ct; Merlin Ct; Broadmoor Vw; Stella St; Hood St; Macarthur Blvd; Maydon Ct; Marvin Ct; Shetland Ct; Maggior Ct (Maggiora Ct); Kirkland Ct.
Other features: Jeep Trl.
Other features: San Leandro Crk.
Chabot Park neighborhood detailed profile
Area: 2.161 square miles
Population: 4,233
Population density:
| Chabot Park: | 1,959 people per square mile |
| Oakland: | 7,739 people per square mile |
Median household income in 2021:
| Chabot Park: | $124,603 |
| Oakland: | $82,236 |
Median rent in in 2021:
| Chabot Park: | $2,709 |
| Oakland: | $1,617 |
Male vs Females
| Males: | 2,036 |
| Females: | 2,197 |
Median age
| Males: | 44.5 years |
| Females: | 44.7 years |
Housing prices:
Average estimated value of detached houses in 2021 (96.9% of all units):
| Chabot Park: | $763,640 |
| Oakland: | $883,784 |
Most popular occupations of males: sales and office occupations (20.7%); computer and mathematical occupations (11.3%); management occupations (except farmers) (10.9%); transportation occupations (10.8%); architecture and engineering occupations (10.6%); life, physical, and social science occupations (6.6%); arts, design, entertainment, sports, and media occupations (6.2%)
Most popular occupations of females: sales and office occupations (23.9%); education, training, and library occupations (18.1%); healthcare practitioners and technical occupations (13.0%); business and financial operations occupations (12.7%); management occupations (except farmers) (9.1%); service occupations (8.5%); arts, design, entertainment, sports, and media occupations (4.5%)
Limited-access highways (interstate or state) in this neighborhood: I- 580.
Roads and streets: Malcolm Ave; Golf Links Rd; Lochard St; Sun Valley Dr; Foothill Blvd; Ettrick St; Elvessa St; Scotia Ave; Monan St; Skyline Trl (Grass Valley Rd); Stacy St; Peralta Oaks Dr; Kerrigan Dr; Shetland Ave; Covington Dr; Glen Manor Pl; Commonwealth Dr; Dunkirk Ave; Lowrey Rd; Mac Arthur; Turner Ave; Ziegler Ave; Montwood Way; Cameron Ave; Cliffland Ave; Skyline Blvd; Aberfoil Ave; Cotter St; Glen Artney St; Caloden St; Bemis St; Hellman; Interstate 580 E; Dingley St; Golf Links; Snowdown Ave; Sheldon St; Greenbrier St; Turner Ct; Barrett St; Tate Ter; Maggiora Dr; 107th Ave; Peralta Oaks Ct; Roderick Rd; Leamont Ct; Overmoor St; 106th Ave; Grass Valley Ct; Mark St; Woodcliff Ct; Merlin Ct; Broadmoor Vw; Stella St; Hood St; Macarthur Blvd; Maydon Ct; Marvin Ct; Shetland Ct; Maggior Ct (Maggiora Ct); Kirkland Ct.
Other features: Jeep Trl.
Other features: San Leandro Crk.
Chabot Park neighborhood detailed profile
Chinatown neighborhood in Oakland statistics: (Find on map)
Area: 0.161 square miles
Population: 2,414
Population density:
Median household income in 2021:
Median rent in in 2021:
Male vs Females
Median age
Most popular occupations of males: service occupations (23.6%); computer and mathematical occupations (16.4%); education, training, and library occupations (15.2%); management occupations (except farmers) (12.0%); sales and office occupations (10.0%); material moving occupations (7.6%); arts, design, entertainment, sports, and media occupations (7.3%)
Most popular occupations of females: service occupations (41.7%); sales and office occupations (14.4%); healthcare practitioners and technical occupations (13.8%); business and financial operations occupations (10.1%); production occupations (5.2%); computer and mathematical occupations (4.2%); education, training, and library occupations (4.2%)
Roads and streets: 9th St; 8th St; 7th St; 10th St; 11th St; Broadway; Madison St; Oak St; Franklin St; Webster St; Harrison St; Jackson St; Alice St; 10th; 6th St.
Chinatown neighborhood detailed profile
Area: 0.161 square miles
Population: 2,414
Population density:
| Chinatown: | 14,951 people per square mile |
| Oakland: | 7,739 people per square mile |
Median household income in 2021:
| Chinatown: | $70,469 |
| Oakland: | $82,236 |
Median rent in in 2021:
| Chinatown: | $775 |
| Oakland: | $1,617 |
Male vs Females
| Males: | 1,042 |
| Females: | 1,372 |
Median age
| Males: | 46.0 years |
| Females: | 50.9 years |
Most popular occupations of males: service occupations (23.6%); computer and mathematical occupations (16.4%); education, training, and library occupations (15.2%); management occupations (except farmers) (12.0%); sales and office occupations (10.0%); material moving occupations (7.6%); arts, design, entertainment, sports, and media occupations (7.3%)
Most popular occupations of females: service occupations (41.7%); sales and office occupations (14.4%); healthcare practitioners and technical occupations (13.8%); business and financial operations occupations (10.1%); production occupations (5.2%); computer and mathematical occupations (4.2%); education, training, and library occupations (4.2%)
Roads and streets: 9th St; 8th St; 7th St; 10th St; 11th St; Broadway; Madison St; Oak St; Franklin St; Webster St; Harrison St; Jackson St; Alice St; 10th; 6th St.
Chinatown neighborhood detailed profile
City Center neighborhood in Oakland statistics: (Find on map)
Area: 0.052 square miles
Population: 419
Population density:
Median household income in 2021:
Median rent in in 2021:
Male vs Females
Median age
Most popular occupations of males: business and financial operations occupations (29.4%); sales and office occupations (23.7%); management occupations (except farmers) (16.1%); computer and mathematical occupations (13.4%); arts, design, entertainment, sports, and media occupations (6.0%); service occupations (5.4%); healthcare practitioners and technical occupations (3.3%)
Most popular occupations of females: sales and office occupations (23.1%); business and financial operations occupations (21.4%); healthcare practitioners and technical occupations (15.3%); education, training, and library occupations (12.8%); service occupations (6.9%); legal occupations (4.4%); management occupations (except farmers) (4.0%)
Roads and streets: Broadway; San Pablo; Frank H Ogawa Plz; 16th St; 11th St; 14th; 14th St; 15th St; Washington St (City Hall Plz, San Pablo Ave); Telegraph Ave; San Pablo Ave; 16th.
City Center neighborhood detailed profile
Area: 0.052 square miles
Population: 419
Population density:
| City Center: | 8,069 people per square mile |
| Oakland: | 7,739 people per square mile |
Median household income in 2021:
| City Center: | $75,990 |
| Oakland: | $82,236 |
Median rent in in 2021:
| City Center: | $2,592 |
| Oakland: | $1,617 |
Male vs Females
| Males: | 233 |
| Females: | 185 |
Median age
| Males: | 41.4 years |
| Females: | 43.0 years |
Most popular occupations of males: business and financial operations occupations (29.4%); sales and office occupations (23.7%); management occupations (except farmers) (16.1%); computer and mathematical occupations (13.4%); arts, design, entertainment, sports, and media occupations (6.0%); service occupations (5.4%); healthcare practitioners and technical occupations (3.3%)
Most popular occupations of females: sales and office occupations (23.1%); business and financial operations occupations (21.4%); healthcare practitioners and technical occupations (15.3%); education, training, and library occupations (12.8%); service occupations (6.9%); legal occupations (4.4%); management occupations (except farmers) (4.0%)
Roads and streets: Broadway; San Pablo; Frank H Ogawa Plz; 16th St; 11th St; 14th; 14th St; 15th St; Washington St (City Hall Plz, San Pablo Ave); Telegraph Ave; San Pablo Ave; 16th.
City Center neighborhood detailed profile
Civic Center neighborhood in Oakland statistics: (Find on map)
Area: 0.089 square miles
Population: 1,001
Population density:
Median household income in 2021:
Median rent in in 2021:
Male vs Females
Median age
Most popular occupations of males: service occupations (52.7%); computer and mathematical occupations (14.8%); material moving occupations (12.8%); sales and office occupations (8.1%); architecture and engineering occupations (4.5%); education, training, and library occupations (3.1%); healthcare practitioners and technical occupations (1.3%)
Most popular occupations of females: service occupations (32.9%); healthcare practitioners and technical occupations (22.0%); sales and office occupations (13.8%); business and financial operations occupations (11.5%); production occupations (10.9%); architecture and engineering occupations (5.0%); life, physical, and social science occupations (4.3%)
Roads and streets: 13th St; 12th St; 14th St; 11th St; Oak St; 14th; Harrison St; Madison St; Jackson St; Alice St; Fallon St.
Civic Center neighborhood detailed profile
Area: 0.089 square miles
Population: 1,001
Population density:
| Civic Center: | 11,235 people per square mile |
| Oakland: | 7,739 people per square mile |
Median household income in 2021:
| Civic Center: | $28,501 |
| Oakland: | $82,236 |
Median rent in in 2021:
| Civic Center: | $450 |
| Oakland: | $1,617 |
Male vs Females
| Males: | 355 |
| Females: | 645 |
Median age
| Males: | 53.1 years |
| Females: | 50.1 years |
Most popular occupations of males: service occupations (52.7%); computer and mathematical occupations (14.8%); material moving occupations (12.8%); sales and office occupations (8.1%); architecture and engineering occupations (4.5%); education, training, and library occupations (3.1%); healthcare practitioners and technical occupations (1.3%)
Most popular occupations of females: service occupations (32.9%); healthcare practitioners and technical occupations (22.0%); sales and office occupations (13.8%); business and financial operations occupations (11.5%); production occupations (10.9%); architecture and engineering occupations (5.0%); life, physical, and social science occupations (4.3%)
Roads and streets: 13th St; 12th St; 14th St; 11th St; Oak St; 14th; Harrison St; Madison St; Jackson St; Alice St; Fallon St.
Civic Center neighborhood detailed profile
Cleveland Heights neighborhood in Oakland statistics: (Find on map)
Area: 0.454 square miles
Population: 6,564
Population density:
Median household income in 2021:
Median rent in in 2021:
Male vs Females
Median age
Most popular occupations of males: arts, design, entertainment, sports, and media occupations (14.1%); management occupations (except farmers) (13.2%); sales and office occupations (11.3%); computer and mathematical occupations (8.8%); architecture and engineering occupations (8.6%); service occupations (7.7%); healthcare practitioners and technical occupations (6.3%)
Most popular occupations of females: sales and office occupations (19.9%); management occupations (except farmers) (19.8%); education, training, and library occupations (13.7%); service occupations (10.5%); arts, design, entertainment, sports, and media occupations (8.2%); healthcare practitioners and technical occupations (7.4%); computer and mathematical occupations (7.3%)
Limited-access highways (interstate or state) in this neighborhood: I- 580.
Roads and streets: Macarthur Blvd; Athol Ave; Lakeshore Ave; Cleveland St; Prospect Ave; Brooklyn Ave; McKinley Ave; Wesley Ave; Hanover Ave; Haddon Rd; Park Blvd; Newton Ave; Merritt Ave; Wayne Ave; Montclair Ave; Hillgirt Cir; Lester Ave; Spruce St; Capell St; Kenwyn Rd; Beacon St; Boden Way; Alma Ave; Capital St; Stow Ave; Excelsior Ct; Hillsborough St; Van Dyke Ave; Radnor Rd; Macarthur; Home Pl E; Zorah St; Lake Park Ave; Portland Ave; Cleveland Cascade; Acton Pl; Wayne Pl; Home Pl W; Barbara Rd; Haddon Ln; McKinley; Merritt; Park; Montclair.
Cleveland Heights neighborhood detailed profile
Area: 0.454 square miles
Population: 6,564
Population density:
| Cleveland Heights: | 14,457 people per square mile |
| Oakland: | 7,739 people per square mile |
Median household income in 2021:
| Cleveland Heights: | $103,717 |
| Oakland: | $82,236 |
Median rent in in 2021:
| Cleveland Heights: | $1,573 |
| Oakland: | $1,617 |
Male vs Females
| Males: | 3,150 |
| Females: | 3,414 |
Median age
| Males: | 42.3 years |
| Females: | 36.9 years |
Most popular occupations of males: arts, design, entertainment, sports, and media occupations (14.1%); management occupations (except farmers) (13.2%); sales and office occupations (11.3%); computer and mathematical occupations (8.8%); architecture and engineering occupations (8.6%); service occupations (7.7%); healthcare practitioners and technical occupations (6.3%)
Most popular occupations of females: sales and office occupations (19.9%); management occupations (except farmers) (19.8%); education, training, and library occupations (13.7%); service occupations (10.5%); arts, design, entertainment, sports, and media occupations (8.2%); healthcare practitioners and technical occupations (7.4%); computer and mathematical occupations (7.3%)
Limited-access highways (interstate or state) in this neighborhood: I- 580.
Roads and streets: Macarthur Blvd; Athol Ave; Lakeshore Ave; Cleveland St; Prospect Ave; Brooklyn Ave; McKinley Ave; Wesley Ave; Hanover Ave; Haddon Rd; Park Blvd; Newton Ave; Merritt Ave; Wayne Ave; Montclair Ave; Hillgirt Cir; Lester Ave; Spruce St; Capell St; Kenwyn Rd; Beacon St; Boden Way; Alma Ave; Capital St; Stow Ave; Excelsior Ct; Hillsborough St; Van Dyke Ave; Radnor Rd; Macarthur; Home Pl E; Zorah St; Lake Park Ave; Portland Ave; Cleveland Cascade; Acton Pl; Wayne Pl; Home Pl W; Barbara Rd; Haddon Ln; McKinley; Merritt; Park; Montclair.
Cleveland Heights neighborhood detailed profile
Clinton neighborhood in Oakland statistics: (Find on map)
Area: 0.315 square miles
Population: 6,927
Population density:
Median household income in 2021:
Median rent in in 2021:
Male vs Females
Median age
Average estimated value of detached houses in 2021 (29.0% of all units):
Most popular occupations of males: service occupations (24.6%); construction, extraction, and maintenance occupations (20.0%); transportation occupations (12.3%); sales and office occupations (11.1%); management occupations (except farmers) (5.9%); production occupations (5.1%); education, training, and library occupations (4.8%)
Most popular occupations of females: sales and office occupations (26.2%); service occupations (26.0%); healthcare practitioners and technical occupations (16.4%); management occupations (except farmers) (7.3%); business and financial operations occupations (7.3%); arts, design, entertainment, sports, and media occupations (6.1%); legal occupations (3.0%)
Roads and streets: E 17th St; Foothill Blvd; 14th Ave; 11th Ave; 12th Ave; 9th Ave; 13th Ave; 10th Ave; E 18th; E 18th St; 8th Ave; E 22nd St; E 20th St; E 21st St; E 19th St; 14th; E 24th St; E 23rd St; 5th Ave; 7th Ave; 6th Ave; Foothill Pl; E 17th.
Clinton neighborhood detailed profile
Area: 0.315 square miles
Population: 6,927
Population density:
| Clinton: | 22,015 people per square mile |
| Oakland: | 7,739 people per square mile |
Median household income in 2021:
| Clinton: | $78,212 |
| Oakland: | $82,236 |
Median rent in in 2021:
| Clinton: | $1,489 |
| Oakland: | $1,617 |
Male vs Females
| Males: | 3,478 |
| Females: | 3,449 |
Median age
| Males: | 38.0 years |
| Females: | 38.7 years |
Average estimated value of detached houses in 2021 (29.0% of all units):
| Clinton: | $678,711 |
| Oakland: | $883,784 |
Most popular occupations of males: service occupations (24.6%); construction, extraction, and maintenance occupations (20.0%); transportation occupations (12.3%); sales and office occupations (11.1%); management occupations (except farmers) (5.9%); production occupations (5.1%); education, training, and library occupations (4.8%)
Most popular occupations of females: sales and office occupations (26.2%); service occupations (26.0%); healthcare practitioners and technical occupations (16.4%); management occupations (except farmers) (7.3%); business and financial operations occupations (7.3%); arts, design, entertainment, sports, and media occupations (6.1%); legal occupations (3.0%)
Roads and streets: E 17th St; Foothill Blvd; 14th Ave; 11th Ave; 12th Ave; 9th Ave; 13th Ave; 10th Ave; E 18th; E 18th St; 8th Ave; E 22nd St; E 20th St; E 21st St; E 19th St; 14th; E 24th St; E 23rd St; 5th Ave; 7th Ave; 6th Ave; Foothill Pl; E 17th.
Clinton neighborhood detailed profile
Coliseum neighborhood in Oakland statistics: (Find on map)
Area: 0.251 square miles
Population: 4,398
Population density:
Median household income in 2021:
Median rent in in 2021:
Male vs Females
Median age
Average estimated value of detached houses in 2021 (31.8% of all units):
Most popular occupations of males: construction, extraction, and maintenance occupations (28.0%); service occupations (16.2%); material moving occupations (13.0%); transportation occupations (12.5%); sales and office occupations (11.5%); production occupations (3.5%); management occupations (except farmers) (3.3%)
Most popular occupations of females: service occupations (43.1%); sales and office occupations (17.1%); transportation occupations (8.9%); management occupations (except farmers) (6.5%); production occupations (5.9%); community and social services occupations (4.8%); education, training, and library occupations (4.8%)
Roads and streets: 69th Ave; 71st Ave; 70th Ave; 73rd Ave; 72nd Ave; Hegenberger Expy; Hegenberger; Hamilton St; Hawley St; Rudsdale St; Spencer St; San Leandro St; Brentford St; Olmstead St; Snell St; San Leandro.
Coliseum neighborhood detailed profile
Area: 0.251 square miles
Population: 4,398
Population density:
| Coliseum: | 17,538 people per square mile |
| Oakland: | 7,739 people per square mile |
Median household income in 2021:
| Coliseum: | $46,756 |
| Oakland: | $82,236 |
Median rent in in 2021:
| Coliseum: | $1,314 |
| Oakland: | $1,617 |
Male vs Females
| Males: | 1,984 |
| Females: | 2,414 |
Median age
| Males: | 29.1 years |
| Females: | 29.9 years |
Average estimated value of detached houses in 2021 (31.8% of all units):
| Coliseum: | $384,372 |
| Oakland: | $883,784 |
Most popular occupations of males: construction, extraction, and maintenance occupations (28.0%); service occupations (16.2%); material moving occupations (13.0%); transportation occupations (12.5%); sales and office occupations (11.5%); production occupations (3.5%); management occupations (except farmers) (3.3%)
Most popular occupations of females: service occupations (43.1%); sales and office occupations (17.1%); transportation occupations (8.9%); management occupations (except farmers) (6.5%); production occupations (5.9%); community and social services occupations (4.8%); education, training, and library occupations (4.8%)
Roads and streets: 69th Ave; 71st Ave; 70th Ave; 73rd Ave; 72nd Ave; Hegenberger Expy; Hegenberger; Hamilton St; Hawley St; Rudsdale St; Spencer St; San Leandro St; Brentford St; Olmstead St; Snell St; San Leandro.
Coliseum neighborhood detailed profile
Coliseum Industrial neighborhood in Oakland statistics: (Find on map)
Area: 1.168 square miles
Population: 5,971
Population density:
Median household income in 2021:
Median rent in in 2021:
Male vs Females
Median age
Housing prices:
Average estimated value of detached houses in 2021 (49.6% of all units):
Average estimated value of townhouses or other attached units in 2021 (3.5% of all units):
Most popular occupations of males: construction, extraction, and maintenance occupations (23.2%); service occupations (18.4%); transportation occupations (10.5%); sales and office occupations (9.7%); production occupations (7.4%); material moving occupations (7.0%); business and financial operations occupations (6.6%)
Most popular occupations of females: service occupations (37.4%); sales and office occupations (28.1%); business and financial operations occupations (4.8%); transportation occupations (4.8%); production occupations (4.7%); management occupations (except farmers) (4.6%); healthcare practitioners and technical occupations (3.8%)
Limited-access highways (interstate or state) in this neighborhood: State Hwy 17 (Nimitz Fwy, I- 880).
Roads and streets: Coliseum Way; Interstate 880 N; Edes Ave; Hegenberger Rd; Hegenberger; Independent Rd; Edes; 66th Ave; Baldwin St; 85th Ave; S Coliseum Way; 66th; N Mall; S Mall; San Leandro St; Enterprise Way; San Leandro; 50th Ave; Baldwin; E 8th St; Julie Ann Way; Kevin Ct; Collins Dr; 46th Ave; Hegenberger Expy; Date St; McClary Ave; 45th Ave; 71st Ave; Phelps St; 76th.
Railroad features: Union Pacific RR.
Other features: Damon Slough.
Coliseum Industrial neighborhood detailed profile
Area: 1.168 square miles
Population: 5,971
Population density:
| Coliseum Industrial: | 5,114 people per square mile |
| Oakland: | 7,739 people per square mile |
Median household income in 2021:
| Coliseum Industrial: | $60,475 |
| Oakland: | $82,236 |
Median rent in in 2021:
| Coliseum Industrial: | $1,508 |
| Oakland: | $1,617 |
Male vs Females
| Males: | 2,965 |
| Females: | 3,005 |
Median age
| Males: | 28.7 years |
| Females: | 30.0 years |
Housing prices:
Average estimated value of detached houses in 2021 (49.6% of all units):
| Coliseum Industrial: | $416,536 |
| Oakland: | $883,784 |
Average estimated value of townhouses or other attached units in 2021 (3.5% of all units):
| This neighborhood: | $525,120 |
| city: | $744,263 |
Most popular occupations of males: construction, extraction, and maintenance occupations (23.2%); service occupations (18.4%); transportation occupations (10.5%); sales and office occupations (9.7%); production occupations (7.4%); material moving occupations (7.0%); business and financial operations occupations (6.6%)
Most popular occupations of females: service occupations (37.4%); sales and office occupations (28.1%); business and financial operations occupations (4.8%); transportation occupations (4.8%); production occupations (4.7%); management occupations (except farmers) (4.6%); healthcare practitioners and technical occupations (3.8%)
Limited-access highways (interstate or state) in this neighborhood: State Hwy 17 (Nimitz Fwy, I- 880).
Roads and streets: Coliseum Way; Interstate 880 N; Edes Ave; Hegenberger Rd; Hegenberger; Independent Rd; Edes; 66th Ave; Baldwin St; 85th Ave; S Coliseum Way; 66th; N Mall; S Mall; San Leandro St; Enterprise Way; San Leandro; 50th Ave; Baldwin; E 8th St; Julie Ann Way; Kevin Ct; Collins Dr; 46th Ave; Hegenberger Expy; Date St; McClary Ave; 45th Ave; 71st Ave; Phelps St; 76th.
Railroad features: Union Pacific RR.
Other features: Damon Slough.
Coliseum Industrial neighborhood detailed profile
Columbia Gardens neighborhood in Oakland statistics: (Find on map)
Area: 0.170 square miles
Population: 687
Population density:
Median household income in 2021:
Median rent in in 2021:
Male vs Females
Median age
Housing prices:
Average estimated value of detached houses in 2021 (81.6% of all units):
Average estimated value of townhouses or other attached units in 2021 (3.9% of all units):
Most popular occupations of males: construction, extraction, and maintenance occupations (22.4%); service occupations (17.1%); material moving occupations (16.6%); sales and office occupations (14.3%); management occupations (except farmers) (7.5%); community and social services occupations (6.3%); education, training, and library occupations (2.6%)
Most popular occupations of females: education, training, and library occupations (27.5%); management occupations (except farmers) (22.4%); service occupations (17.3%); sales and office occupations (8.7%); community and social services occupations (5.8%); business and financial operations occupations (4.5%); healthcare practitioners and technical occupations (3.8%)
Roads and streets: Empire Rd; Coral Rd; Tunis Rd; 98th Ave; 98th; Gibraltar Rd; Wistar Rd; Koford Rd; Hesket Rd; Gannon Rd.
Other features: San Leandro Crk.
Columbia Gardens neighborhood detailed profile
Area: 0.170 square miles
Population: 687
Population density:
| Columbia Gardens: | 4,036 people per square mile |
| Oakland: | 7,739 people per square mile |
Median household income in 2021:
| Columbia Gardens: | $68,431 |
| Oakland: | $82,236 |
Median rent in in 2021:
| Columbia Gardens: | $2,099 |
| Oakland: | $1,617 |
Male vs Females
| Males: | 374 |
| Females: | 312 |
Median age
| Males: | 35.1 years |
| Females: | 37.7 years |
Housing prices:
Average estimated value of detached houses in 2021 (81.6% of all units):
| Columbia Gardens: | $399,897 |
| Oakland: | $883,784 |
Average estimated value of townhouses or other attached units in 2021 (3.9% of all units):
| This neighborhood: | $525,120 |
| city: | $744,263 |
Most popular occupations of males: construction, extraction, and maintenance occupations (22.4%); service occupations (17.1%); material moving occupations (16.6%); sales and office occupations (14.3%); management occupations (except farmers) (7.5%); community and social services occupations (6.3%); education, training, and library occupations (2.6%)
Most popular occupations of females: education, training, and library occupations (27.5%); management occupations (except farmers) (22.4%); service occupations (17.3%); sales and office occupations (8.7%); community and social services occupations (5.8%); business and financial operations occupations (4.5%); healthcare practitioners and technical occupations (3.8%)
Roads and streets: Empire Rd; Coral Rd; Tunis Rd; 98th Ave; 98th; Gibraltar Rd; Wistar Rd; Koford Rd; Hesket Rd; Gannon Rd.
Other features: San Leandro Crk.
Columbia Gardens neighborhood detailed profile
Cox neighborhood in Oakland statistics: (Find on map)
Area: 0.230 square miles
Population: 4,994
Population density:
Median household income in 2021:
Median rent in in 2021:
Male vs Females
Median age
Housing prices:
Average estimated value of detached houses in 2021 (46.7% of all units):
Average estimated value of townhouses or other attached units in 2021 (9.0% of all units):
Most popular occupations of males: construction, extraction, and maintenance occupations (20.7%); production occupations (15.7%); service occupations (15.4%); material moving occupations (8.6%); sales and office occupations (8.4%); transportation occupations (7.7%); management occupations (except farmers) (6.8%)
Most popular occupations of females: sales and office occupations (32.8%); service occupations (32.0%); education, training, and library occupations (6.1%); management occupations (except farmers) (6.0%); business and financial operations occupations (5.2%); material moving occupations (3.7%); production occupations (2.9%)
Highways in this neighborhood: State Hwy 185 (International Blvd, E 14th St).
Roads and streets: 92nd Ave; 96th Ave; 98th Ave; 94th Ave; 98th; Plymouth St; Sunnyside St; International Blvd; Holly St; Walnut St; Birch St; Cherry St; Olive St; Cherry.
Cox neighborhood detailed profile
Area: 0.230 square miles
Population: 4,994
Population density:
| Cox: | 21,732 people per square mile |
| Oakland: | 7,739 people per square mile |
Median household income in 2021:
| Cox: | $56,099 |
| Oakland: | $82,236 |
Median rent in in 2021:
| Cox: | $1,400 |
| Oakland: | $1,617 |
Male vs Females
| Males: | 2,556 |
| Females: | 2,437 |
Median age
| Males: | 32.2 years |
| Females: | 30.6 years |
Housing prices:
Average estimated value of detached houses in 2021 (46.7% of all units):
| Cox: | $520,578 |
| Oakland: | $883,784 |
Average estimated value of townhouses or other attached units in 2021 (9.0% of all units):
| This neighborhood: | $1,830,000 |
| city: | $744,263 |
Most popular occupations of males: construction, extraction, and maintenance occupations (20.7%); production occupations (15.7%); service occupations (15.4%); material moving occupations (8.6%); sales and office occupations (8.4%); transportation occupations (7.7%); management occupations (except farmers) (6.8%)
Most popular occupations of females: sales and office occupations (32.8%); service occupations (32.0%); education, training, and library occupations (6.1%); management occupations (except farmers) (6.0%); business and financial operations occupations (5.2%); material moving occupations (3.7%); production occupations (2.9%)
Highways in this neighborhood: State Hwy 185 (International Blvd, E 14th St).
Roads and streets: 92nd Ave; 96th Ave; 98th Ave; 94th Ave; 98th; Plymouth St; Sunnyside St; International Blvd; Holly St; Walnut St; Birch St; Cherry St; Olive St; Cherry.
Cox neighborhood detailed profile
Crestmont neighborhood in Oakland statistics: (Find on map)
Area: 0.287 square miles
Population: 1,144
Population density:
Median household income in 2021:
Median rent in in 2021:
Male vs Females
Median age
Housing prices:
Average estimated value of detached houses in 2021 (86.9% of all units):
Average estimated value of townhouses or other attached units in 2021 (8.6% of all units):
Average estimated '21 value of housing units in 3-to-4-unit structures (6.9% of all units):
Average estimated '21 value of housing units in 5-or-more-unit structures (4.0% of all units):
Most popular occupations of males: sales and office occupations (20.8%); management occupations (except farmers) (17.3%); business and financial operations occupations (16.1%); computer and mathematical occupations (9.7%); construction, extraction, and maintenance occupations (5.2%); production occupations (4.9%); legal occupations (4.5%)
Most popular occupations of females: sales and office occupations (28.0%); education, training, and library occupations (13.2%); legal occupations (13.0%); service occupations (12.3%); business and financial operations occupations (11.2%); management occupations (except farmers) (6.9%); life, physical, and social science occupations (3.8%)
Roads and streets: Crestmont Dr; Skyline Blvd; Rishell Dr; Chadbourne Way; Terrabella Way; Redwood Rd; Colgett Dr; Creighton Way; Samaria Ln; Kingwood Rd; Van Cleave Way; Stantonville Dr; Westfield Way; Terrabella Pl; Kimberlin Heights Dr; Via Rialto; Sereno Cir; Teralynn Ct; Pembroke Ct; Stantonville Ct; Yarmouth Ct.
Crestmont neighborhood detailed profile
Area: 0.287 square miles
Population: 1,144
Population density:
| Crestmont: | 3,986 people per square mile |
| Oakland: | 7,739 people per square mile |
Median household income in 2021:
| Crestmont: | $125,720 |
| Oakland: | $82,236 |
Median rent in in 2021:
| Crestmont: | $3,485 |
| Oakland: | $1,617 |
Male vs Females
| Males: | 547 |
| Females: | 597 |
Median age
| Males: | 47.2 years |
| Females: | 41.6 years |
Housing prices:
Average estimated value of detached houses in 2021 (86.9% of all units):
| Crestmont: | $987,107 |
| Oakland: | $883,784 |
Average estimated value of townhouses or other attached units in 2021 (8.6% of all units):
| This neighborhood: | $665,882 |
| city: | $744,263 |
Average estimated '21 value of housing units in 3-to-4-unit structures (6.9% of all units):
| Crestmont: | $582,989 |
| city: | $699,145 |
Average estimated '21 value of housing units in 5-or-more-unit structures (4.0% of all units):
| Crestmont: | $1,059,719 |
| Oakland: | $622,418 |
Most popular occupations of males: sales and office occupations (20.8%); management occupations (except farmers) (17.3%); business and financial operations occupations (16.1%); computer and mathematical occupations (9.7%); construction, extraction, and maintenance occupations (5.2%); production occupations (4.9%); legal occupations (4.5%)
Most popular occupations of females: sales and office occupations (28.0%); education, training, and library occupations (13.2%); legal occupations (13.0%); service occupations (12.3%); business and financial operations occupations (11.2%); management occupations (except farmers) (6.9%); life, physical, and social science occupations (3.8%)
Roads and streets: Crestmont Dr; Skyline Blvd; Rishell Dr; Chadbourne Way; Terrabella Way; Redwood Rd; Colgett Dr; Creighton Way; Samaria Ln; Kingwood Rd; Van Cleave Way; Stantonville Dr; Westfield Way; Terrabella Pl; Kimberlin Heights Dr; Via Rialto; Sereno Cir; Teralynn Ct; Pembroke Ct; Stantonville Ct; Yarmouth Ct.
Crestmont neighborhood detailed profile
Crocker Highland neighborhood in Oakland statistics: (Find on map)
Area: 0.291 square miles
Population: 2,463
Population density:
Median household income in 2021:
Median rent in in 2021:
Male vs Females
Median age
Average estimated value of detached houses in 2021 (96.3% of all units):
Most popular occupations of males: management occupations (except farmers) (24.3%); sales and office occupations (23.5%); business and financial operations occupations (13.9%); legal occupations (10.1%); service occupations (6.1%); healthcare practitioners and technical occupations (4.7%); architecture and engineering occupations (4.3%)
Most popular occupations of females: management occupations (except farmers) (29.5%); business and financial operations occupations (19.1%); legal occupations (11.2%); healthcare practitioners and technical occupations (10.5%); arts, design, entertainment, sports, and media occupations (9.9%); education, training, and library occupations (7.1%); sales and office occupations (4.6%)
Roads and streets: Mandana Blvd; Carlston Ave; Sunnyhills Rd; Ashmount Ave; Portal Ave; Clarendon Cres; Balfour Ave; Paramount Rd; Hubert Rd; Ardmore Ave; Wawona Ave; Longridge Rd; Midcrest Rd; Walavista Ave; Downey Pl; Bowles Pl; Mandana Cir; Hillwood Pl; Van Sicklen Pl; Ashmount Way; Valant Pl.
Crocker Highland neighborhood detailed profile
Area: 0.291 square miles
Population: 2,463
Population density:
| Crocker Highland: | 8,476 people per square mile |
| Oakland: | 7,739 people per square mile |
Median household income in 2021:
| Crocker Highland: | $222,747 |
| Oakland: | $82,236 |
Median rent in in 2021:
| Crocker Highland: | $1,421 |
| Oakland: | $1,617 |
Male vs Females
| Males: | 1,215 |
| Females: | 1,248 |
Median age
| Males: | 42.1 years |
| Females: | 46.0 years |
Average estimated value of detached houses in 2021 (96.3% of all units):
| Crocker Highland: | $1,493,593 |
| Oakland: | $883,784 |
Most popular occupations of males: management occupations (except farmers) (24.3%); sales and office occupations (23.5%); business and financial operations occupations (13.9%); legal occupations (10.1%); service occupations (6.1%); healthcare practitioners and technical occupations (4.7%); architecture and engineering occupations (4.3%)
Most popular occupations of females: management occupations (except farmers) (29.5%); business and financial operations occupations (19.1%); legal occupations (11.2%); healthcare practitioners and technical occupations (10.5%); arts, design, entertainment, sports, and media occupations (9.9%); education, training, and library occupations (7.1%); sales and office occupations (4.6%)
Roads and streets: Mandana Blvd; Carlston Ave; Sunnyhills Rd; Ashmount Ave; Portal Ave; Clarendon Cres; Balfour Ave; Paramount Rd; Hubert Rd; Ardmore Ave; Wawona Ave; Longridge Rd; Midcrest Rd; Walavista Ave; Downey Pl; Bowles Pl; Mandana Cir; Hillwood Pl; Van Sicklen Pl; Ashmount Way; Valant Pl.
Crocker Highland neighborhood detailed profile
Dimond neighborhood in Oakland statistics: (Find on map)
Area: 0.123 square miles
Population: 1,542
Population density:
Median household income in 2021:
Median rent in in 2021:
Male vs Females
Median age
Most popular occupations of males: business and financial operations occupations (17.4%); service occupations (15.7%); management occupations (except farmers) (14.8%); sales and office occupations (12.1%); education, training, and library occupations (8.5%); arts, design, entertainment, sports, and media occupations (8.2%); life, physical, and social science occupations (6.6%)
Most popular occupations of females: service occupations (27.8%); education, training, and library occupations (12.4%); sales and office occupations (12.0%); production occupations (11.2%); life, physical, and social science occupations (9.3%); healthcare practitioners and technical occupations (8.1%); business and financial operations occupations (7.7%)
Limited-access highways (interstate or state) in this neighborhood: I- 580.
Roads and streets: Montana St; Georgia St; Delaware St; Champion St; Interstate 580 E; Maple Ave; Coolidge Ave; Palmetto St; Dakota St; Laurel Ave; Boston Ave; Curran Way; Macarthur Blvd; Flagg Ave.
Dimond neighborhood detailed profile
Area: 0.123 square miles
Population: 1,542
Population density:
| Dimond: | 12,529 people per square mile |
| Oakland: | 7,739 people per square mile |
Median household income in 2021:
| Dimond: | $89,097 |
| Oakland: | $82,236 |
Median rent in in 2021:
| Dimond: | $1,344 |
| Oakland: | $1,617 |
Male vs Females
| Males: | 694 |
| Females: | 847 |
Median age
| Males: | 45.3 years |
| Females: | 57.0 years |
Most popular occupations of males: business and financial operations occupations (17.4%); service occupations (15.7%); management occupations (except farmers) (14.8%); sales and office occupations (12.1%); education, training, and library occupations (8.5%); arts, design, entertainment, sports, and media occupations (8.2%); life, physical, and social science occupations (6.6%)
Most popular occupations of females: service occupations (27.8%); education, training, and library occupations (12.4%); sales and office occupations (12.0%); production occupations (11.2%); life, physical, and social science occupations (9.3%); healthcare practitioners and technical occupations (8.1%); business and financial operations occupations (7.7%)
Limited-access highways (interstate or state) in this neighborhood: I- 580.
Roads and streets: Montana St; Georgia St; Delaware St; Champion St; Interstate 580 E; Maple Ave; Coolidge Ave; Palmetto St; Dakota St; Laurel Ave; Boston Ave; Curran Way; Macarthur Blvd; Flagg Ave.
Dimond neighborhood detailed profile
Downtown neighborhood in Oakland statistics: (Find on map)
Area: 0.263 square miles
Population: 3,216
Population density:
Median household income in 2021:
Median rent in in 2021:
Male vs Females
Median age
Most popular occupations of males: service occupations (15.1%); management occupations (except farmers) (13.6%); sales and office occupations (11.6%); computer and mathematical occupations (11.3%); business and financial operations occupations (11.2%); architecture and engineering occupations (8.3%); education, training, and library occupations (7.8%)
Most popular occupations of females: sales and office occupations (20.1%); service occupations (19.1%); business and financial operations occupations (13.8%); healthcare practitioners and technical occupations (11.8%); education, training, and library occupations (9.6%); arts, design, entertainment, sports, and media occupations (7.9%); computer and mathematical occupations (5.2%)
Roads and streets: Broadway; Webster St; Franklin St; Telegraph Ave; 14th St; 14th; 12th St; 21st St; 22nd St; 13th St; 17th St; 15th St; Clay St; 20th; 20th St; 19th St; Telegraph; Grand Ave; 21st; San Pablo; Jefferson St; 11th St; Grand; 16th St; Harrison St; W Grand Ave; Frank H Ogawa Plz; San Pablo Ave; Washington St (City Hall Plz, San Pablo Ave); Kaiser Plz (Valdez St); Valley St; 16th.
Downtown neighborhood detailed profile
Area: 0.263 square miles
Population: 3,216
Population density:
| Downtown: | 12,249 people per square mile |
| Oakland: | 7,739 people per square mile |
Median household income in 2021:
| Downtown: | $62,871 |
| Oakland: | $82,236 |
Median rent in in 2021:
| Downtown: | $1,324 |
| Oakland: | $1,617 |
Male vs Females
| Males: | 1,639 |
| Females: | 1,577 |
Median age
| Males: | 44.4 years |
| Females: | 42.2 years |
Most popular occupations of males: service occupations (15.1%); management occupations (except farmers) (13.6%); sales and office occupations (11.6%); computer and mathematical occupations (11.3%); business and financial operations occupations (11.2%); architecture and engineering occupations (8.3%); education, training, and library occupations (7.8%)
Most popular occupations of females: sales and office occupations (20.1%); service occupations (19.1%); business and financial operations occupations (13.8%); healthcare practitioners and technical occupations (11.8%); education, training, and library occupations (9.6%); arts, design, entertainment, sports, and media occupations (7.9%); computer and mathematical occupations (5.2%)
Roads and streets: Broadway; Webster St; Franklin St; Telegraph Ave; 14th St; 14th; 12th St; 21st St; 22nd St; 13th St; 17th St; 15th St; Clay St; 20th; 20th St; 19th St; Telegraph; Grand Ave; 21st; San Pablo; Jefferson St; 11th St; Grand; 16th St; Harrison St; W Grand Ave; Frank H Ogawa Plz; San Pablo Ave; Washington St (City Hall Plz, San Pablo Ave); Kaiser Plz (Valdez St); Valley St; 16th.
Downtown neighborhood detailed profile
Durant Manor neighborhood in Oakland statistics: (Find on map)
Area: 0.168 square miles
Population: 2,702
Population density:
Median household income in 2021:
Median rent in in 2021:
Male vs Females
Median age
Housing prices:
Average estimated value of detached houses in 2021 (74.3% of all units):
Average estimated value of townhouses or other attached units in 2021 (8.8% of all units):
Average estimated '21 value of housing units in 5-or-more-unit structures (4.5% of all units):
Average estimated value of mobile home in 2021 (5.8% of all units):
Most popular occupations of males: sales and office occupations (24.1%); construction, extraction, and maintenance occupations (18.5%); transportation occupations (12.2%); management occupations (except farmers) (8.3%); service occupations (7.9%); material moving occupations (5.4%); computer and mathematical occupations (4.8%)
Most popular occupations of females: sales and office occupations (47.0%); service occupations (14.7%); education, training, and library occupations (9.3%); management occupations (except farmers) (8.7%); business and financial operations occupations (4.3%); arts, design, entertainment, sports, and media occupations (4.0%); production occupations (3.2%)
Highways in this neighborhood: State Hwy 185 (International Blvd, E 14th St).
Roads and streets: Durant Ave; 105th Ave; Sunnyside St; Breed Ave; Beverly Ave; 107th Ave; 106th Ave; 109th Ave; 108th Ave; International Blvd; Link; Link St; 104th Ave; 104th; 105th.
Durant Manor neighborhood detailed profile
Area: 0.168 square miles
Population: 2,702
Population density:
| Durant Manor: | 16,072 people per square mile |
| Oakland: | 7,739 people per square mile |
Median household income in 2021:
| Durant Manor: | $84,003 |
| Oakland: | $82,236 |
Median rent in in 2021:
| Durant Manor: | $1,681 |
| Oakland: | $1,617 |
Male vs Females
| Males: | 1,325 |
| Females: | 1,377 |
Median age
| Males: | 38.3 years |
| Females: | 43.3 years |
Housing prices:
Average estimated value of detached houses in 2021 (74.3% of all units):
| Durant Manor: | $886,314 |
| Oakland: | $883,784 |
Average estimated value of townhouses or other attached units in 2021 (8.8% of all units):
| This neighborhood: | $928,765 |
| city: | $744,263 |
Average estimated '21 value of housing units in 5-or-more-unit structures (4.5% of all units):
| Durant Manor: | $363,043 |
| Oakland: | $622,418 |
Average estimated value of mobile home in 2021 (5.8% of all units):
| Durant Manor: | $390,573 |
| Oakland: | $326,796 |
Most popular occupations of males: sales and office occupations (24.1%); construction, extraction, and maintenance occupations (18.5%); transportation occupations (12.2%); management occupations (except farmers) (8.3%); service occupations (7.9%); material moving occupations (5.4%); computer and mathematical occupations (4.8%)
Most popular occupations of females: sales and office occupations (47.0%); service occupations (14.7%); education, training, and library occupations (9.3%); management occupations (except farmers) (8.7%); business and financial operations occupations (4.3%); arts, design, entertainment, sports, and media occupations (4.0%); production occupations (3.2%)
Highways in this neighborhood: State Hwy 185 (International Blvd, E 14th St).
Roads and streets: Durant Ave; 105th Ave; Sunnyside St; Breed Ave; Beverly Ave; 107th Ave; 106th Ave; 109th Ave; 108th Ave; International Blvd; Link; Link St; 104th Ave; 104th; 105th.
Durant Manor neighborhood detailed profile
East Peralta neighborhood in Oakland statistics: (Find on map)
Area: 0.182 square miles
Population: 1,330
Population density:
Median household income in 2021:
Median rent in in 2021:
Male vs Females
Median age
Most popular occupations of males: service occupations (25.3%); management occupations (except farmers) (12.3%); sales and office occupations (11.8%); computer and mathematical occupations (7.8%); production occupations (7.6%); material moving occupations (6.8%); arts, design, entertainment, sports, and media occupations (5.9%)
Most popular occupations of females: service occupations (30.2%); sales and office occupations (14.2%); management occupations (except farmers) (12.4%); life, physical, and social science occupations (10.0%); production occupations (6.6%); community and social services occupations (5.7%); arts, design, entertainment, sports, and media occupations (5.6%)
Roads and streets: E 12th St; E 15th St; E 14th St (International Blvd); E 11th St; 5th; International Blvd; 5th Ave; 6th Ave; 9th Ave; 7th Ave; 8th Ave; E 10th St; 10th Ave; E 8th St; 11th Ave; E 12th; 12th Ave; 13th Ave; 14th Ave; E 10th; Loomis Ct.
East Peralta neighborhood detailed profile
Area: 0.182 square miles
Population: 1,330
Population density:
| East Peralta: | 7,320 people per square mile |
| Oakland: | 7,739 people per square mile |
Median household income in 2021:
| East Peralta: | $52,690 |
| Oakland: | $82,236 |
Median rent in in 2021:
| East Peralta: | $680 |
| Oakland: | $1,617 |
Male vs Females
| Males: | 597 |
| Females: | 733 |
Median age
| Males: | 50.0 years |
| Females: | 49.9 years |
Most popular occupations of males: service occupations (25.3%); management occupations (except farmers) (12.3%); sales and office occupations (11.8%); computer and mathematical occupations (7.8%); production occupations (7.6%); material moving occupations (6.8%); arts, design, entertainment, sports, and media occupations (5.9%)
Most popular occupations of females: service occupations (30.2%); sales and office occupations (14.2%); management occupations (except farmers) (12.4%); life, physical, and social science occupations (10.0%); production occupations (6.6%); community and social services occupations (5.7%); arts, design, entertainment, sports, and media occupations (5.6%)
Roads and streets: E 12th St; E 15th St; E 14th St (International Blvd); E 11th St; 5th; International Blvd; 5th Ave; 6th Ave; 9th Ave; 7th Ave; 8th Ave; E 10th St; 10th Ave; E 8th St; 11th Ave; E 12th; 12th Ave; 13th Ave; 14th Ave; E 10th; Loomis Ct.
East Peralta neighborhood detailed profile
Eastmont neighborhood in Oakland statistics: (Find on map)
Area: 0.202 square miles
Population: 3,619
Population density:
Median household income in 2021:
Median rent in in 2021:
Male vs Females
Median age
Average estimated value of detached houses in 2021 (53.7% of all units):
Most popular occupations of males: construction, extraction, and maintenance occupations (19.9%); service occupations (15.8%); education, training, and library occupations (15.2%); sales and office occupations (13.5%); material moving occupations (10.5%); business and financial operations occupations (6.6%); management occupations (except farmers) (4.7%)
Most popular occupations of females: sales and office occupations (41.3%); service occupations (29.0%); business and financial operations occupations (8.3%); management occupations (except farmers) (6.4%); material moving occupations (4.2%); arts, design, entertainment, sports, and media occupations (3.5%); community and social services occupations (3.1%)
Roads and streets: Hillside St; Bancroft; Bancroft Ave (Bancroft Avenue); 79th Ave; 80th Ave; 82nd Ave; Garfield Ave; 75th Ave; 77th Ave; 76th Ave; 78th Ave; Parker Ave; Ritchie St; 74th Ave; 81st Ave; 82nd; Idlewood St; Iris St; Dowling St; Atherton St; Dowling.
Eastmont neighborhood detailed profile
Area: 0.202 square miles
Population: 3,619
Population density:
| Eastmont: | 17,945 people per square mile |
| Oakland: | 7,739 people per square mile |
Median household income in 2021:
| Eastmont: | $59,265 |
| Oakland: | $82,236 |
Median rent in in 2021:
| Eastmont: | $1,544 |
| Oakland: | $1,617 |
Male vs Females
| Males: | 1,779 |
| Females: | 1,840 |
Median age
| Males: | 33.1 years |
| Females: | 35.7 years |
Average estimated value of detached houses in 2021 (53.7% of all units):
| Eastmont: | $457,259 |
| Oakland: | $883,784 |
Most popular occupations of males: construction, extraction, and maintenance occupations (19.9%); service occupations (15.8%); education, training, and library occupations (15.2%); sales and office occupations (13.5%); material moving occupations (10.5%); business and financial operations occupations (6.6%); management occupations (except farmers) (4.7%)
Most popular occupations of females: sales and office occupations (41.3%); service occupations (29.0%); business and financial operations occupations (8.3%); management occupations (except farmers) (6.4%); material moving occupations (4.2%); arts, design, entertainment, sports, and media occupations (3.5%); community and social services occupations (3.1%)
Roads and streets: Hillside St; Bancroft; Bancroft Ave (Bancroft Avenue); 79th Ave; 80th Ave; 82nd Ave; Garfield Ave; 75th Ave; 77th Ave; 76th Ave; 78th Ave; Parker Ave; Ritchie St; 74th Ave; 81st Ave; 82nd; Idlewood St; Iris St; Dowling St; Atherton St; Dowling.
Eastmont neighborhood detailed profile
Eastmont Hills neighborhood in Oakland statistics: (Find on map)
Area: 0.483 square miles
Population: 3,777
Population density:
Median household income in 2021:
Median rent in in 2021:
Male vs Females
Median age
Average estimated value of detached houses in 2021 (82.1% of all units):
Most popular occupations of males: transportation occupations (11.9%); construction, extraction, and maintenance occupations (11.0%); sales and office occupations (10.0%); management occupations (except farmers) (9.4%); computer and mathematical occupations (8.9%); service occupations (8.9%); business and financial operations occupations (8.7%)
Most popular occupations of females: service occupations (19.8%); management occupations (except farmers) (17.0%); business and financial operations occupations (16.3%); sales and office occupations (13.0%); education, training, and library occupations (11.7%); legal occupations (8.5%); life, physical, and social science occupations (4.9%)
Roads and streets: Sunkist Dr; Greenly Dr; Sterling Dr; Ney Ave; Hillmont Dr; Macarthur Blvd; Macarthur; Outlook Ave; Partridge Ave; Circle Hill Dr; Columbian Dr; Michigan Ave; Field St; Parker Ave; 75th Ave; 82nd Ave; Earl St; Winthrope St; Shone Ave; Lamp St; Valentine St; Keller Ave; Crest Ave; Mayfield Path; Ritchie St; 76th Ave; Holmes Ave; 82nd; Tully Pl; Cumberland Way; 78th.
Eastmont Hills neighborhood detailed profile
Area: 0.483 square miles
Population: 3,777
Population density:
| Eastmont Hills: | 7,828 people per square mile |
| Oakland: | 7,739 people per square mile |
Median household income in 2021:
| Eastmont Hills: | $80,876 |
| Oakland: | $82,236 |
Median rent in in 2021:
| Eastmont Hills: | $2,072 |
| Oakland: | $1,617 |
Male vs Females
| Males: | 1,691 |
| Females: | 2,085 |
Median age
| Males: | 34.5 years |
| Females: | 36.8 years |
Average estimated value of detached houses in 2021 (82.1% of all units):
| Eastmont Hills: | $679,996 |
| Oakland: | $883,784 |
Most popular occupations of males: transportation occupations (11.9%); construction, extraction, and maintenance occupations (11.0%); sales and office occupations (10.0%); management occupations (except farmers) (9.4%); computer and mathematical occupations (8.9%); service occupations (8.9%); business and financial operations occupations (8.7%)
Most popular occupations of females: service occupations (19.8%); management occupations (except farmers) (17.0%); business and financial operations occupations (16.3%); sales and office occupations (13.0%); education, training, and library occupations (11.7%); legal occupations (8.5%); life, physical, and social science occupations (4.9%)
Roads and streets: Sunkist Dr; Greenly Dr; Sterling Dr; Ney Ave; Hillmont Dr; Macarthur Blvd; Macarthur; Outlook Ave; Partridge Ave; Circle Hill Dr; Columbian Dr; Michigan Ave; Field St; Parker Ave; 75th Ave; 82nd Ave; Earl St; Winthrope St; Shone Ave; Lamp St; Valentine St; Keller Ave; Crest Ave; Mayfield Path; Ritchie St; 76th Ave; Holmes Ave; 82nd; Tully Pl; Cumberland Way; 78th.
Eastmont Hills neighborhood detailed profile
Elmhurst Park neighborhood in Oakland statistics: (Find on map)
Area: 0.328 square miles
Population: 3,739
Population density:
Median household income in 2021:
Median rent in in 2021:
Male vs Females
Median age
Housing prices:
Average estimated value of detached houses in 2021 (56.0% of all units):
Average estimated value of townhouses or other attached units in 2021 (12.8% of all units):
Most popular occupations of males: service occupations (24.1%); sales and office occupations (16.8%); transportation occupations (12.3%); construction, extraction, and maintenance occupations (9.3%); production occupations (9.0%); material moving occupations (6.7%); management occupations (except farmers) (4.6%)
Most popular occupations of females: sales and office occupations (30.1%); service occupations (26.1%); healthcare practitioners and technical occupations (10.6%); management occupations (except farmers) (9.3%); material moving occupations (7.9%); farming, fishing, and forestry occupations (6.9%); business and financial operations occupations (4.2%)
Roads and streets: 98th Ave; 98th; San Leandro St; San Leandro; Railroad Ave; B St; A St; Elmhurst Ave; E St; 94th Ave; D St; C St; Industrial St; 93rd Ave; 96th Ave; 95th Ave; 97th Ave; Industrial.
Railroad features: Union Pacific RR; Bay Area Rapid Transit RR.
Elmhurst Park neighborhood detailed profile
Area: 0.328 square miles
Population: 3,739
Population density:
| Elmhurst Park: | 11,411 people per square mile |
| Oakland: | 7,739 people per square mile |
Median household income in 2021:
| Elmhurst Park: | $65,962 |
| Oakland: | $82,236 |
Median rent in in 2021:
| Elmhurst Park: | $1,215 |
| Oakland: | $1,617 |
Male vs Females
| Males: | 1,936 |
| Females: | 1,802 |
Median age
| Males: | 31.9 years |
| Females: | 31.7 years |
Housing prices:
Average estimated value of detached houses in 2021 (56.0% of all units):
| Elmhurst Park: | $458,757 |
| Oakland: | $883,784 |
Average estimated value of townhouses or other attached units in 2021 (12.8% of all units):
| This neighborhood: | $1,830,000 |
| city: | $744,263 |
Most popular occupations of males: service occupations (24.1%); sales and office occupations (16.8%); transportation occupations (12.3%); construction, extraction, and maintenance occupations (9.3%); production occupations (9.0%); material moving occupations (6.7%); management occupations (except farmers) (4.6%)
Most popular occupations of females: sales and office occupations (30.1%); service occupations (26.1%); healthcare practitioners and technical occupations (10.6%); management occupations (except farmers) (9.3%); material moving occupations (7.9%); farming, fishing, and forestry occupations (6.9%); business and financial operations occupations (4.2%)
Roads and streets: 98th Ave; 98th; San Leandro St; San Leandro; Railroad Ave; B St; A St; Elmhurst Ave; E St; 94th Ave; D St; C St; Industrial St; 93rd Ave; 96th Ave; 95th Ave; 97th Ave; Industrial.
Railroad features: Union Pacific RR; Bay Area Rapid Transit RR.
Elmhurst Park neighborhood detailed profile
Fairfax neighborhood in Oakland statistics: (Find on map)
Area: 0.167 square miles
Population: 2,559
Population density:
Median household income in 2021:
Median rent in in 2021:
Male vs Females
Median age
Average estimated value of detached houses in 2021 (54.9% of all units):
Most popular occupations of males: service occupations (30.2%); construction, extraction, and maintenance occupations (15.5%); sales and office occupations (15.0%); management occupations (except farmers) (13.7%); education, training, and library occupations (9.3%); material moving occupations (3.8%); legal occupations (3.0%)
Most popular occupations of females: sales and office occupations (27.8%); community and social services occupations (16.1%); education, training, and library occupations (12.9%); management occupations (except farmers) (12.6%); service occupations (10.5%); healthcare practitioners and technical occupations (6.2%); business and financial operations occupations (6.1%)
Roads and streets: Fairfax Ave; Congress Ave; Ygnacio Ave; Foothill Blvd; Monticello Ave; Foothill; Courtland Ave; Fern St; Renwick St; Cole St; Potter St; Gordon St; Brookdale Ave; Vicksburg Ave; Belvedere St; Congress.
Fairfax neighborhood detailed profile
Area: 0.167 square miles
Population: 2,559
Population density:
| Fairfax: | 15,321 people per square mile |
| Oakland: | 7,739 people per square mile |
Median household income in 2021:
| Fairfax: | $82,680 |
| Oakland: | $82,236 |
Median rent in in 2021:
| Fairfax: | $1,602 |
| Oakland: | $1,617 |
Male vs Females
| Males: | 1,207 |
| Females: | 1,352 |
Median age
| Males: | 33.1 years |
| Females: | 39.3 years |
Average estimated value of detached houses in 2021 (54.9% of all units):
| Fairfax: | $684,872 |
| Oakland: | $883,784 |
Most popular occupations of males: service occupations (30.2%); construction, extraction, and maintenance occupations (15.5%); sales and office occupations (15.0%); management occupations (except farmers) (13.7%); education, training, and library occupations (9.3%); material moving occupations (3.8%); legal occupations (3.0%)
Most popular occupations of females: sales and office occupations (27.8%); community and social services occupations (16.1%); education, training, and library occupations (12.9%); management occupations (except farmers) (12.6%); service occupations (10.5%); healthcare practitioners and technical occupations (6.2%); business and financial operations occupations (6.1%)
Roads and streets: Fairfax Ave; Congress Ave; Ygnacio Ave; Foothill Blvd; Monticello Ave; Foothill; Courtland Ave; Fern St; Renwick St; Cole St; Potter St; Gordon St; Brookdale Ave; Vicksburg Ave; Belvedere St; Congress.
Fairfax neighborhood detailed profile
Fairfax Business neighborhood in Oakland statistics: (Find on map)
Area: 0.122 square miles
Population: 2,687
Population density:
Median household income in 2021:
Median rent in in 2021:
Male vs Females
Median age
Average estimated value of detached houses in 2021 (52.7% of all units):
Most popular occupations of males: transportation occupations (19.5%); service occupations (18.3%); production occupations (17.1%); education, training, and library occupations (12.6%); sales and office occupations (9.1%); construction, extraction, and maintenance occupations (6.9%); healthcare practitioners and technical occupations (5.4%)
Most popular occupations of females: service occupations (44.7%); sales and office occupations (17.1%); management occupations (except farmers) (14.8%); production occupations (7.8%); life, physical, and social science occupations (6.6%); healthcare practitioners and technical occupations (4.3%); education, training, and library occupations (2.4%)
Highways in this neighborhood: State Hwy 185 (International Blvd, E 14th St).
Roads and streets: 55th Ave; Bancroft Ave; Wentworth Ave; Princeton St; Bancroft; 54th Ave; Holland St; Wadean Pl; Crittenden St; Fairfax Ave; International Blvd; 53rd Ave; Cole St; Vicksburg Ave; 55th.
Fairfax Business neighborhood detailed profile
Area: 0.122 square miles
Population: 2,687
Population density:
| Fairfax Business (Wentworth): | 21,946 people per square mile |
| Oakland: | 7,739 people per square mile |
Median household income in 2021:
| Fairfax Business (Wentworth): | $63,666 |
| Oakland: | $82,236 |
Median rent in in 2021:
| Fairfax Business (Wentworth): | $1,280 |
| Oakland: | $1,617 |
Male vs Females
| Males: | 1,522 |
| Females: | 1,165 |
Median age
| Males: | 31.3 years |
| Females: | 37.4 years |
Average estimated value of detached houses in 2021 (52.7% of all units):
| Fairfax Business (Wentworth): | $397,789 |
| Oakland: | $883,784 |
Most popular occupations of males: transportation occupations (19.5%); service occupations (18.3%); production occupations (17.1%); education, training, and library occupations (12.6%); sales and office occupations (9.1%); construction, extraction, and maintenance occupations (6.9%); healthcare practitioners and technical occupations (5.4%)
Most popular occupations of females: service occupations (44.7%); sales and office occupations (17.1%); management occupations (except farmers) (14.8%); production occupations (7.8%); life, physical, and social science occupations (6.6%); healthcare practitioners and technical occupations (4.3%); education, training, and library occupations (2.4%)
Highways in this neighborhood: State Hwy 185 (International Blvd, E 14th St).
Roads and streets: 55th Ave; Bancroft Ave; Wentworth Ave; Princeton St; Bancroft; 54th Ave; Holland St; Wadean Pl; Crittenden St; Fairfax Ave; International Blvd; 53rd Ave; Cole St; Vicksburg Ave; 55th.
Fairfax Business neighborhood detailed profile
Fairview Park neighborhood in Oakland statistics: (Find on map)
Area: 0.266 square miles
Population: 5,345
Population density:
Median household income in 2021:
Median rent in in 2021:
Male vs Females
Median age
Housing prices:
Average estimated value of detached houses in 2021 (46.0% of all units):
Average estimated value of townhouses or other attached units in 2021 (7.7% of all units):
Average estimated value of housing units in 2-unit structures in 2021 (13.7% of all units):
Average estimated '21 value of housing units in 3-to-4-unit structures (15.6% of all units):
Average estimated '21 value of housing units in 5-or-more-unit structures (0.5% of all units):
Most popular occupations of males: management occupations (except farmers) (19.9%); computer and mathematical occupations (13.1%); education, training, and library occupations (12.1%); arts, design, entertainment, sports, and media occupations (8.0%); sales and office occupations (7.6%); business and financial operations occupations (5.8%); life, physical, and social science occupations (5.4%)
Most popular occupations of females: management occupations (except farmers) (24.1%); sales and office occupations (14.4%); business and financial operations occupations (11.3%); education, training, and library occupations (10.6%); healthcare practitioners and technical occupations (8.8%); service occupations (8.1%); arts, design, entertainment, sports, and media occupations (6.1%)
Roads and streets: Telegraph Ave; Telegraph; Alcatraz Ave; Colby St; 61st St; 62nd St; 63rd St; Hillegass Ave; McAuley St; 60th St; Canning St; Ayala Ave; Dana St; 59th St; North St; 58th St; Woolsey St; Benvenue Ave; 65th St; Regent St; Howell St; 66th St; Vicente St; Alcatraz; Hermann St; Racine St; 57th St; Martin St; Dana.
Fairview Park neighborhood detailed profile
Area: 0.266 square miles
Population: 5,345
Population density:
| Fairview Park: | 20,068 people per square mile |
| Oakland: | 7,739 people per square mile |
Median household income in 2021:
| Fairview Park: | $141,543 |
| Oakland: | $82,236 |
Median rent in in 2021:
| Fairview Park: | $2,072 |
| Oakland: | $1,617 |
Male vs Females
| Males: | 2,385 |
| Females: | 2,959 |
Median age
| Males: | 38.6 years |
| Females: | 38.2 years |
Housing prices:
Average estimated value of detached houses in 2021 (46.0% of all units):
| Fairview Park: | $982,535 |
| Oakland: | $883,784 |
Average estimated value of townhouses or other attached units in 2021 (7.7% of all units):
| This neighborhood: | $834,579 |
| city: | $744,263 |
Average estimated value of housing units in 2-unit structures in 2021 (13.7% of all units):
| This neighborhood: | $455,185 |
| Oakland: | $732,452 |
Average estimated '21 value of housing units in 3-to-4-unit structures (15.6% of all units):
| Fairview Park: | $858,696 |
| city: | $699,145 |
Average estimated '21 value of housing units in 5-or-more-unit structures (0.5% of all units):
| Fairview Park: | $523,810 |
| Oakland: | $622,418 |
Most popular occupations of males: management occupations (except farmers) (19.9%); computer and mathematical occupations (13.1%); education, training, and library occupations (12.1%); arts, design, entertainment, sports, and media occupations (8.0%); sales and office occupations (7.6%); business and financial operations occupations (5.8%); life, physical, and social science occupations (5.4%)
Most popular occupations of females: management occupations (except farmers) (24.1%); sales and office occupations (14.4%); business and financial operations occupations (11.3%); education, training, and library occupations (10.6%); healthcare practitioners and technical occupations (8.8%); service occupations (8.1%); arts, design, entertainment, sports, and media occupations (6.1%)
Roads and streets: Telegraph Ave; Telegraph; Alcatraz Ave; Colby St; 61st St; 62nd St; 63rd St; Hillegass Ave; McAuley St; 60th St; Canning St; Ayala Ave; Dana St; 59th St; North St; 58th St; Woolsey St; Benvenue Ave; 65th St; Regent St; Howell St; 66th St; Vicente St; Alcatraz; Hermann St; Racine St; 57th St; Martin St; Dana.
Fairview Park neighborhood detailed profile
Fitchburg neighborhood in Oakland statistics: (Find on map)
Area: 0.288 square miles
Population: 4,268
Population density:
Median household income in 2021:
Median rent in in 2021:
Male vs Females
Median age
Most popular occupations of males: construction, extraction, and maintenance occupations (39.3%); service occupations (10.6%); transportation occupations (9.0%); material moving occupations (8.7%); sales and office occupations (8.5%); production occupations (5.9%); management occupations (except farmers) (5.8%)
Most popular occupations of females: service occupations (49.2%); sales and office occupations (26.2%); transportation occupations (5.1%); material moving occupations (3.4%); education, training, and library occupations (2.9%); management occupations (except farmers) (2.3%); construction, extraction, and maintenance occupations (2.0%)
Roads and streets: 81st Ave; 77th Ave; 75th Ave; 76th Ave; Rudsdale St; 79th Ave; San Leandro; San Leandro St; 82nd Ave; 80th Ave; Hawley St; Spencer St; Hamilton St; B St; 78th Ave.
Railroad features: Union Pacific RR; Bay Area Rapid Transit RR.
Fitchburg neighborhood detailed profile
Area: 0.288 square miles
Population: 4,268
Population density:
| Fitchburg: | 14,839 people per square mile |
| Oakland: | 7,739 people per square mile |
Median household income in 2021:
| Fitchburg: | $60,851 |
| Oakland: | $82,236 |
Median rent in in 2021:
| Fitchburg: | $1,267 |
| Oakland: | $1,617 |
Male vs Females
| Males: | 2,122 |
| Females: | 2,146 |
Median age
| Males: | 30.6 years |
| Females: | 30.2 years |
Most popular occupations of males: construction, extraction, and maintenance occupations (39.3%); service occupations (10.6%); transportation occupations (9.0%); material moving occupations (8.7%); sales and office occupations (8.5%); production occupations (5.9%); management occupations (except farmers) (5.8%)
Most popular occupations of females: service occupations (49.2%); sales and office occupations (26.2%); transportation occupations (5.1%); material moving occupations (3.4%); education, training, and library occupations (2.9%); management occupations (except farmers) (2.3%); construction, extraction, and maintenance occupations (2.0%)
Roads and streets: 81st Ave; 77th Ave; 75th Ave; 76th Ave; Rudsdale St; 79th Ave; San Leandro; San Leandro St; 82nd Ave; 80th Ave; Hawley St; Spencer St; Hamilton St; B St; 78th Ave.
Railroad features: Union Pacific RR; Bay Area Rapid Transit RR.
Fitchburg neighborhood detailed profile
Foothill Square neighborhood in Oakland statistics: (Find on map)
Area: 0.167 square miles
Population: 1,680
Population density:
Median household income in 2021:
Median rent in in 2021:
Male vs Females
Median age
Housing prices:
Average estimated value of detached houses in 2021 (72.7% of all units):
Average estimated value of townhouses or other attached units in 2021 (1.3% of all units):
Most popular occupations of males: construction, extraction, and maintenance occupations (15.9%); service occupations (14.5%); business and financial operations occupations (9.7%); production occupations (8.4%); material moving occupations (8.1%); transportation occupations (7.8%); computer and mathematical occupations (7.6%)
Most popular occupations of females: sales and office occupations (22.5%); education, training, and library occupations (14.2%); service occupations (14.0%); healthcare practitioners and technical occupations (11.6%); community and social services occupations (6.7%); management occupations (except farmers) (6.5%); business and financial operations occupations (5.8%)
Roads and streets: Macarthur Blvd; Macarthur; Truman Ave; Foothill Blvd; Oliver Ave; 106th; 106th Ave; Frazier Ave; Interstate 580 E; Talbot Ave; Stanley Ave; 108th Ave; Shaw St; Durant Ave; Fisher Ave; Burr St; Lawlor St; 109th Ave; McIntyre St; Julius St; Byron Ave; 100th.
Foothill Square neighborhood detailed profile
Area: 0.167 square miles
Population: 1,680
Population density:
| Foothill Square: | 10,074 people per square mile |
| Oakland: | 7,739 people per square mile |
Median household income in 2021:
| Foothill Square: | $97,742 |
| Oakland: | $82,236 |
Median rent in in 2021:
| Foothill Square: | $1,376 |
| Oakland: | $1,617 |
Male vs Females
| Males: | 670 |
| Females: | 1,010 |
Median age
| Males: | 37.1 years |
| Females: | 37.1 years |
Housing prices:
Average estimated value of detached houses in 2021 (72.7% of all units):
| Foothill Square: | $451,786 |
| Oakland: | $883,784 |
Average estimated value of townhouses or other attached units in 2021 (1.3% of all units):
| This neighborhood: | $411,111 |
| city: | $744,263 |
Most popular occupations of males: construction, extraction, and maintenance occupations (15.9%); service occupations (14.5%); business and financial operations occupations (9.7%); production occupations (8.4%); material moving occupations (8.1%); transportation occupations (7.8%); computer and mathematical occupations (7.6%)
Most popular occupations of females: sales and office occupations (22.5%); education, training, and library occupations (14.2%); service occupations (14.0%); healthcare practitioners and technical occupations (11.6%); community and social services occupations (6.7%); management occupations (except farmers) (6.5%); business and financial operations occupations (5.8%)
Roads and streets: Macarthur Blvd; Macarthur; Truman Ave; Foothill Blvd; Oliver Ave; 106th; 106th Ave; Frazier Ave; Interstate 580 E; Talbot Ave; Stanley Ave; 108th Ave; Shaw St; Durant Ave; Fisher Ave; Burr St; Lawlor St; 109th Ave; McIntyre St; Julius St; Byron Ave; 100th.
Foothill Square neighborhood detailed profile
Forestland neighborhood in Oakland statistics: (Find on map)
Area: 0.480 square miles
Population: 2,059
Population density:
Median household income in 2021:
Median rent in in 2021:
Male vs Females
Median age
Average estimated value of detached houses in 2021 (94.6% of all units):
Most popular occupations of males: management occupations (except farmers) (22.2%); sales and office occupations (15.0%); service occupations (11.4%); education, training, and library occupations (10.1%); business and financial operations occupations (9.7%); computer and mathematical occupations (6.9%); construction, extraction, and maintenance occupations (5.8%)
Most popular occupations of females: sales and office occupations (17.5%); management occupations (except farmers) (15.5%); education, training, and library occupations (13.1%); legal occupations (9.3%); computer and mathematical occupations (9.0%); healthcare practitioners and technical occupations (8.5%); business and financial operations occupations (7.0%)
Roads and streets: Thorndale Dr; Elverton Dr; Skyline Blvd; Manzanita Dr; Arrowhead Dr; Sobrante Rd; Villanova Dr; Homewood Dr; Oakwood Dr; Glencourt Dr; Northwood Ct; Villanova Ln; Diablo Dr; Thornhill Dr; Saroni Dr; Lauriston Ct; Ridgewood Ln; Oakwood Ct; Colton Blvd; Bonnington Ct; Jewell Ct; Ridgewood Dr; Conrad Ct; Thorn Ct; Ormindale Ct; Willowbank Ct; Observation Pl; Snake Rd; North Cir.
Roads and streets: Villanova Dr.
Forestland neighborhood detailed profile
Area: 0.480 square miles
Population: 2,059
Population density:
| Forestland: | 4,285 people per square mile |
| Oakland: | 7,739 people per square mile |
Median household income in 2021:
| Forestland: | $218,521 |
| Oakland: | $82,236 |
Median rent in in 2021:
| Forestland: | $1,884 |
| Oakland: | $1,617 |
Male vs Females
| Males: | 1,106 |
| Females: | 953 |
Median age
| Males: | 45.5 years |
| Females: | 46.1 years |
Average estimated value of detached houses in 2021 (94.6% of all units):
| Forestland: | $1,101,987 |
| Oakland: | $883,784 |
Most popular occupations of males: management occupations (except farmers) (22.2%); sales and office occupations (15.0%); service occupations (11.4%); education, training, and library occupations (10.1%); business and financial operations occupations (9.7%); computer and mathematical occupations (6.9%); construction, extraction, and maintenance occupations (5.8%)
Most popular occupations of females: sales and office occupations (17.5%); management occupations (except farmers) (15.5%); education, training, and library occupations (13.1%); legal occupations (9.3%); computer and mathematical occupations (9.0%); healthcare practitioners and technical occupations (8.5%); business and financial operations occupations (7.0%)
Roads and streets: Thorndale Dr; Elverton Dr; Skyline Blvd; Manzanita Dr; Arrowhead Dr; Sobrante Rd; Villanova Dr; Homewood Dr; Oakwood Dr; Glencourt Dr; Northwood Ct; Villanova Ln; Diablo Dr; Thornhill Dr; Saroni Dr; Lauriston Ct; Ridgewood Ln; Oakwood Ct; Colton Blvd; Bonnington Ct; Jewell Ct; Ridgewood Dr; Conrad Ct; Thorn Ct; Ormindale Ct; Willowbank Ct; Observation Pl; Snake Rd; North Cir.
Roads and streets: Villanova Dr.
Forestland neighborhood detailed profile
Fremont neighborhood in Oakland statistics: (Find on map)
Area: 0.279 square miles
Population: 5,316
Population density:
Median household income in 2021:
Median rent in in 2021:
Male vs Females
Median age
Average estimated value of detached houses in 2021 (38.5% of all units):
Most popular occupations of males: service occupations (21.2%); construction, extraction, and maintenance occupations (17.5%); sales and office occupations (13.7%); transportation occupations (10.1%); production occupations (7.4%); material moving occupations (5.5%); management occupations (except farmers) (3.8%)
Most popular occupations of females: sales and office occupations (29.7%); service occupations (25.3%); management occupations (except farmers) (11.4%); material moving occupations (8.1%); production occupations (6.5%); education, training, and library occupations (5.7%); healthcare practitioners and technical occupations (5.3%)
Highways in this neighborhood: State Hwy 185 (International Blvd, E 14th St).
Roads and streets: 48th Ave; 47th Ave; Bancroft Ave; 51st Ave; Foothill Blvd; Foothill; 45th Ave; 50th Ave; Ygnacio Ave; Melrose Ave; Bond St; High St; High; 46th Ave; Courtland Ave; International Blvd; Bancroft Way; Bancroft; Thompson St; San Carlos Ave; Tyrrell St; Ellen St; 44th Ave; Fremont Way; Judd; Judd Pl (Judd St); E 17th St.
Fremont neighborhood detailed profile
Area: 0.279 square miles
Population: 5,316
Population density:
| Fremont: | 19,022 people per square mile |
| Oakland: | 7,739 people per square mile |
Median household income in 2021:
| Fremont: | $66,910 |
| Oakland: | $82,236 |
Median rent in in 2021:
| Fremont: | $1,459 |
| Oakland: | $1,617 |
Male vs Females
| Males: | 2,459 |
| Females: | 2,857 |
Median age
| Males: | 33.2 years |
| Females: | 36.4 years |
Average estimated value of detached houses in 2021 (38.5% of all units):
| Fremont: | $465,261 |
| Oakland: | $883,784 |
Most popular occupations of males: service occupations (21.2%); construction, extraction, and maintenance occupations (17.5%); sales and office occupations (13.7%); transportation occupations (10.1%); production occupations (7.4%); material moving occupations (5.5%); management occupations (except farmers) (3.8%)
Most popular occupations of females: sales and office occupations (29.7%); service occupations (25.3%); management occupations (except farmers) (11.4%); material moving occupations (8.1%); production occupations (6.5%); education, training, and library occupations (5.7%); healthcare practitioners and technical occupations (5.3%)
Highways in this neighborhood: State Hwy 185 (International Blvd, E 14th St).
Roads and streets: 48th Ave; 47th Ave; Bancroft Ave; 51st Ave; Foothill Blvd; Foothill; 45th Ave; 50th Ave; Ygnacio Ave; Melrose Ave; Bond St; High St; High; 46th Ave; Courtland Ave; International Blvd; Bancroft Way; Bancroft; Thompson St; San Carlos Ave; Tyrrell St; Ellen St; 44th Ave; Fremont Way; Judd; Judd Pl (Judd St); E 17th St.
Fremont neighborhood detailed profile
Frick neighborhood in Oakland statistics: (Find on map)
Area: 0.306 square miles
Population: 3,179
Population density:
Median household income in 2021:
Median rent in in 2021:
Male vs Females
Median age
Average estimated value of detached houses in 2021 (65.3% of all units):
Most popular occupations of males: sales and office occupations (23.8%); production occupations (13.1%); service occupations (9.5%); transportation occupations (8.7%); material moving occupations (7.1%); architecture and engineering occupations (6.9%); construction, extraction, and maintenance occupations (5.2%)
Most popular occupations of females: sales and office occupations (22.1%); service occupations (20.1%); management occupations (except farmers) (12.7%); business and financial operations occupations (11.6%); legal occupations (8.8%); architecture and engineering occupations (5.6%); arts, design, entertainment, sports, and media occupations (4.6%)
Roads and streets: Foothill Blvd; Brann St; Foothill; Seminary Ave; 62nd Ave; 60th Ave; Camden St; Camden; Morse Dr; Fleming Ave; Walnut St; 61st Ave; Roberts Ave; 56th Ave; 64th Ave; 57th Ave; Picardy Dr S; Picardy Dr N; 58th Ave; Seminary; Kingsley Cir; Macarthur; Mason St; Picardy Dr; Millsbrae Ave; 67th Ave; Havenscourt; Havenscourt Blvd; Murdock Ct; Beal Ave; Macarthur Blvd; Morse.
Frick neighborhood detailed profile
Area: 0.306 square miles
Population: 3,179
Population density:
| Frick: | 10,378 people per square mile |
| Oakland: | 7,739 people per square mile |
Median household income in 2021:
| Frick: | $67,044 |
| Oakland: | $82,236 |
Median rent in in 2021:
| Frick: | $1,404 |
| Oakland: | $1,617 |
Male vs Females
| Males: | 1,504 |
| Females: | 1,675 |
Median age
| Males: | 36.7 years |
| Females: | 40.4 years |
Average estimated value of detached houses in 2021 (65.3% of all units):
| Frick: | $704,351 |
| Oakland: | $883,784 |
Most popular occupations of males: sales and office occupations (23.8%); production occupations (13.1%); service occupations (9.5%); transportation occupations (8.7%); material moving occupations (7.1%); architecture and engineering occupations (6.9%); construction, extraction, and maintenance occupations (5.2%)
Most popular occupations of females: sales and office occupations (22.1%); service occupations (20.1%); management occupations (except farmers) (12.7%); business and financial operations occupations (11.6%); legal occupations (8.8%); architecture and engineering occupations (5.6%); arts, design, entertainment, sports, and media occupations (4.6%)
Roads and streets: Foothill Blvd; Brann St; Foothill; Seminary Ave; 62nd Ave; 60th Ave; Camden St; Camden; Morse Dr; Fleming Ave; Walnut St; 61st Ave; Roberts Ave; 56th Ave; 64th Ave; 57th Ave; Picardy Dr S; Picardy Dr N; 58th Ave; Seminary; Kingsley Cir; Macarthur; Mason St; Picardy Dr; Millsbrae Ave; 67th Ave; Havenscourt; Havenscourt Blvd; Murdock Ct; Beal Ave; Macarthur Blvd; Morse.
Frick neighborhood detailed profile
Fruitvale Station neighborhood in Oakland statistics: (Find on map)
Area: 0.167 square miles
Population: 663
Population density:
Median household income in 2021:
Median rent in in 2021:
Male vs Females
Median age
Average estimated value of detached houses in 2021 (32.0% of all units):
Most popular occupations of males: sales and office occupations (23.2%); service occupations (16.2%); management occupations (except farmers) (13.4%); construction, extraction, and maintenance occupations (12.2%); arts, design, entertainment, sports, and media occupations (8.6%); material moving occupations (8.1%); legal occupations (5.8%)
Most popular occupations of females: service occupations (38.4%); business and financial operations occupations (35.0%); sales and office occupations (18.3%); production occupations (11.8%); legal occupations (8.0%); education, training, and library occupations (7.5%); life, physical, and social science occupations (6.9%)
Limited-access highways (interstate or state) in this neighborhood: State Hwy 77.
Roads and streets: San Leandro; E 12th St; San Leandro St; International Blvd; E 12th; 37th Ave; 35th Ave; E 9th St; 39th Ave; 38th Ave; 33rd Ave; 34th Ave; 41st Ave; 42nd; 36th Ave; Wattling St; 35th; 40th Ave.
Railroad features: Bay Area Rapid Transit RR; Union Pacific RR.
Fruitvale Station neighborhood detailed profile
Area: 0.167 square miles
Population: 663
Population density:
| Fruitvale Station: | 3,973 people per square mile |
| Oakland: | 7,739 people per square mile |
Median household income in 2021:
| Fruitvale Station: | $81,250 |
| Oakland: | $82,236 |
Median rent in in 2021:
| Fruitvale Station: | $1,282 |
| Oakland: | $1,617 |
Male vs Females
| Males: | 370 |
| Females: | 292 |
Median age
| Males: | 44.1 years |
| Females: | 41.5 years |
Average estimated value of detached houses in 2021 (32.0% of all units):
| Fruitvale Station: | $565,861 |
| Oakland: | $883,784 |
Most popular occupations of males: sales and office occupations (23.2%); service occupations (16.2%); management occupations (except farmers) (13.4%); construction, extraction, and maintenance occupations (12.2%); arts, design, entertainment, sports, and media occupations (8.6%); material moving occupations (8.1%); legal occupations (5.8%)
Most popular occupations of females: service occupations (38.4%); business and financial operations occupations (35.0%); sales and office occupations (18.3%); production occupations (11.8%); legal occupations (8.0%); education, training, and library occupations (7.5%); life, physical, and social science occupations (6.9%)
Limited-access highways (interstate or state) in this neighborhood: State Hwy 77.
Roads and streets: San Leandro; E 12th St; San Leandro St; International Blvd; E 12th; 37th Ave; 35th Ave; E 9th St; 39th Ave; 38th Ave; 33rd Ave; 34th Ave; 41st Ave; 42nd; 36th Ave; Wattling St; 35th; 40th Ave.
Railroad features: Bay Area Rapid Transit RR; Union Pacific RR.
Fruitvale Station neighborhood detailed profile
Glen Highlands neighborhood in Oakland statistics: (Find on map)
Area: 0.321 square miles
Population: 1,276
Population density:
Median household income in 2021:
Median rent in in 2021:
Male vs Females
Median age
Average estimated value of detached houses in 2021 (95.7% of all units):
Most popular occupations of males: sales and office occupations (23.4%); management occupations (except farmers) (18.1%); architecture and engineering occupations (16.0%); business and financial operations occupations (9.6%); service occupations (8.6%); healthcare practitioners and technical occupations (4.0%); arts, design, entertainment, sports, and media occupations (3.6%)
Most popular occupations of females: management occupations (except farmers) (30.0%); education, training, and library occupations (10.7%); healthcare practitioners and technical occupations (10.5%); life, physical, and social science occupations (9.8%); sales and office occupations (8.7%); service occupations (6.9%); community and social services occupations (6.7%)
Roads and streets: Mountain Blvd; Swainland Rd; Broadway Ter; Fairlane Dr; Ruthland Rd; Duncan Way; Pinewood Rd; Glenwood Glade; Leo Way; Caldwell Rd; Aquarius Way; Lowell St (Fairlane Dr); Warren Fwy; Avoca Ave; Monzal Ave; Florence Ter; Serramar Dr; Neva Ct; Taurus Ave; Alleyway; Oval Rd; Glenarms Dr; Morningside Dr.
Glen Highlands neighborhood detailed profile
Area: 0.321 square miles
Population: 1,276
Population density:
| Glen Highlands: | 3,980 people per square mile |
| Oakland: | 7,739 people per square mile |
Median household income in 2021:
| Glen Highlands: | $205,565 |
| Oakland: | $82,236 |
Median rent in in 2021:
| Glen Highlands: | $3,070 |
| Oakland: | $1,617 |
Male vs Females
| Males: | 567 |
| Females: | 709 |
Median age
| Males: | 48.4 years |
| Females: | 48.5 years |
Average estimated value of detached houses in 2021 (95.7% of all units):
| Glen Highlands: | $1,345,870 |
| Oakland: | $883,784 |
Most popular occupations of males: sales and office occupations (23.4%); management occupations (except farmers) (18.1%); architecture and engineering occupations (16.0%); business and financial operations occupations (9.6%); service occupations (8.6%); healthcare practitioners and technical occupations (4.0%); arts, design, entertainment, sports, and media occupations (3.6%)
Most popular occupations of females: management occupations (except farmers) (30.0%); education, training, and library occupations (10.7%); healthcare practitioners and technical occupations (10.5%); life, physical, and social science occupations (9.8%); sales and office occupations (8.7%); service occupations (6.9%); community and social services occupations (6.7%)
Roads and streets: Mountain Blvd; Swainland Rd; Broadway Ter; Fairlane Dr; Ruthland Rd; Duncan Way; Pinewood Rd; Glenwood Glade; Leo Way; Caldwell Rd; Aquarius Way; Lowell St (Fairlane Dr); Warren Fwy; Avoca Ave; Monzal Ave; Florence Ter; Serramar Dr; Neva Ct; Taurus Ave; Alleyway; Oval Rd; Glenarms Dr; Morningside Dr.
Glen Highlands neighborhood detailed profile
Glenview neighborhood in Oakland statistics: (Find on map)
Area: 0.548 square miles
Population: 6,691
Population density:
Median household income in 2021:
Median rent in in 2021:
Male vs Females
Median age
Average estimated value of detached houses in 2021 (62.2% of all units):
Most popular occupations of males: management occupations (except farmers) (19.8%); sales and office occupations (12.8%); education, training, and library occupations (10.7%); computer and mathematical occupations (10.3%); business and financial operations occupations (8.9%); service occupations (8.9%); arts, design, entertainment, sports, and media occupations (7.9%)
Most popular occupations of females: management occupations (except farmers) (18.6%); sales and office occupations (17.7%); business and financial operations occupations (12.5%); arts, design, entertainment, sports, and media occupations (11.2%); education, training, and library occupations (9.9%); healthcare practitioners and technical occupations (9.0%); service occupations (8.5%)
Limited-access highways (interstate or state) in this neighborhood: I- 580.
Roads and streets: Macarthur Blvd; Park Blvd; Everett Ave; E 38th St; Excelsior Ave; el Centro Ave; Wellington St; Randolph Ave; Edgewood Ave; Ardley Ave; Woodruff Ave; Hampel St; Glen Park Rd (14th Ave); Canon Ave; la Cresta Ave; Interstate 580 E; Elston Ave; Linwood Ave; Beaumont Ave; Glendome Cir; Montana St; Brighton Ave; Hollywood Ave; E 36th St; Glendora Ave; Dolores Ave; Cavendish Ln; Evans Ave; San Sebastian Ave; Trestle Glen Rd; Allman St; Vista St; Townsend Ave; Dimond Ave; Glenfield Ave; Bruce St; Benevides Ave; Adell Ct; Chatham Rd; Elbert St; San Luis Ave; Fruitvale Ave; Leach Ave; Sloan St; Elsinore Ave; Sheffield Ave; Evers Ave; Miami Ct; Galvin St; Benton St; Veteran Way; Elston Ct; Greenwood Ave; Morrison Ave.
Other features: Sausal Crk.
Glenview neighborhood detailed profile
Area: 0.548 square miles
Population: 6,691
Population density:
| Glenview: | 12,220 people per square mile |
| Oakland: | 7,739 people per square mile |
Median household income in 2021:
| Glenview: | $137,936 |
| Oakland: | $82,236 |
Median rent in in 2021:
| Glenview: | $1,752 |
| Oakland: | $1,617 |
Male vs Females
| Males: | 3,240 |
| Females: | 3,451 |
Median age
| Males: | 43.3 years |
| Females: | 45.1 years |
Average estimated value of detached houses in 2021 (62.2% of all units):
| Glenview: | $1,122,350 |
| Oakland: | $883,784 |
Most popular occupations of males: management occupations (except farmers) (19.8%); sales and office occupations (12.8%); education, training, and library occupations (10.7%); computer and mathematical occupations (10.3%); business and financial operations occupations (8.9%); service occupations (8.9%); arts, design, entertainment, sports, and media occupations (7.9%)
Most popular occupations of females: management occupations (except farmers) (18.6%); sales and office occupations (17.7%); business and financial operations occupations (12.5%); arts, design, entertainment, sports, and media occupations (11.2%); education, training, and library occupations (9.9%); healthcare practitioners and technical occupations (9.0%); service occupations (8.5%)
Limited-access highways (interstate or state) in this neighborhood: I- 580.
Roads and streets: Macarthur Blvd; Park Blvd; Everett Ave; E 38th St; Excelsior Ave; el Centro Ave; Wellington St; Randolph Ave; Edgewood Ave; Ardley Ave; Woodruff Ave; Hampel St; Glen Park Rd (14th Ave); Canon Ave; la Cresta Ave; Interstate 580 E; Elston Ave; Linwood Ave; Beaumont Ave; Glendome Cir; Montana St; Brighton Ave; Hollywood Ave; E 36th St; Glendora Ave; Dolores Ave; Cavendish Ln; Evans Ave; San Sebastian Ave; Trestle Glen Rd; Allman St; Vista St; Townsend Ave; Dimond Ave; Glenfield Ave; Bruce St; Benevides Ave; Adell Ct; Chatham Rd; Elbert St; San Luis Ave; Fruitvale Ave; Leach Ave; Sloan St; Elsinore Ave; Sheffield Ave; Evers Ave; Miami Ct; Galvin St; Benton St; Veteran Way; Elston Ct; Greenwood Ave; Morrison Ave.
Other features: Sausal Crk.
Glenview neighborhood detailed profile
Gold Coast neighborhood in Oakland statistics: (Find on map)
Area: 0.117 square miles
Population: 972
Population density:
Median household income in 2021:
Median rent in in 2021:
Male vs Females
Median age
Most popular occupations of males: architecture and engineering occupations (26.8%); education, training, and library occupations (18.8%); computer and mathematical occupations (12.2%); service occupations (9.9%); arts, design, entertainment, sports, and media occupations (8.4%); sales and office occupations (8.2%); healthcare practitioners and technical occupations (7.5%)
Most popular occupations of females: education, training, and library occupations (24.4%); sales and office occupations (22.8%); business and financial operations occupations (14.8%); computer and mathematical occupations (14.0%); management occupations (except farmers) (11.7%); healthcare practitioners and technical occupations (11.4%); arts, design, entertainment, sports, and media occupations (10.8%)
Roads and streets: 14th St; Lakeside Dr; Jackson St; 17th St; Alice St; Madison St; Oak St; 19th St; 15th St; 14th.
Gold Coast neighborhood detailed profile
Area: 0.117 square miles
Population: 972
Population density:
| Gold Coast: | 8,307 people per square mile |
| Oakland: | 7,739 people per square mile |
Median household income in 2021:
| Gold Coast: | $23,569 |
| Oakland: | $82,236 |
Median rent in in 2021:
| Gold Coast: | $1,325 |
| Oakland: | $1,617 |
Male vs Females
| Males: | 454 |
| Females: | 518 |
Median age
| Males: | 48.1 years |
| Females: | 45.9 years |
Most popular occupations of males: architecture and engineering occupations (26.8%); education, training, and library occupations (18.8%); computer and mathematical occupations (12.2%); service occupations (9.9%); arts, design, entertainment, sports, and media occupations (8.4%); sales and office occupations (8.2%); healthcare practitioners and technical occupations (7.5%)
Most popular occupations of females: education, training, and library occupations (24.4%); sales and office occupations (22.8%); business and financial operations occupations (14.8%); computer and mathematical occupations (14.0%); management occupations (except farmers) (11.7%); healthcare practitioners and technical occupations (11.4%); arts, design, entertainment, sports, and media occupations (10.8%)
Roads and streets: 14th St; Lakeside Dr; Jackson St; 17th St; Alice St; Madison St; Oak St; 19th St; 15th St; 14th.
Gold Coast neighborhood detailed profile
Golf Links neighborhood in Oakland statistics: (Find on map)
Area: 0.430 square miles
Population: 1,762
Population density:
Median household income in 2021:
Median rent in in 2021:
Male vs Females
Median age
Average estimated value of detached houses in 2021 (92.3% of all units):
Most popular occupations of males: service occupations (32.2%); sales and office occupations (20.6%); community and social services occupations (13.1%); construction, extraction, and maintenance occupations (9.1%); management occupations (except farmers) (7.1%); education, training, and library occupations (5.0%); arts, design, entertainment, sports, and media occupations (2.8%)
Most popular occupations of females: business and financial operations occupations (15.3%); management occupations (except farmers) (14.6%); sales and office occupations (13.7%); education, training, and library occupations (12.9%); service occupations (9.9%); healthcare practitioners and technical occupations (6.3%); community and social services occupations (5.4%)
Limited-access highways (interstate or state) in this neighborhood: I- 580.
Roads and streets: Fontaine St; Fontaine; Golf Links Rd; Golf Links; Interstate 580 E; Ney Ave; Castlewood St; Oak Knoll Blvd; Calandria Ave; Crest Ave; el Monte Ave; Aster Ave; Margarita Ave; Blandon Rd; Granada Ave; Flintridge Ln; Mirasol Ave; Outlook Ave; Encina Way; Murillo Ave; Cosgrave Ave; Alcala Ave; Encina Ave; Greenly Dr; Flintridge Ave; Glenly Rd; Sarazen Ave; Twin Oaks Way; Cosgrave.
Golf Links neighborhood detailed profile
Area: 0.430 square miles
Population: 1,762
Population density:
| Golf Links: | 4,095 people per square mile |
| Oakland: | 7,739 people per square mile |
Median household income in 2021:
| Golf Links: | $101,368 |
| Oakland: | $82,236 |
Median rent in in 2021:
| Golf Links: | $2,442 |
| Oakland: | $1,617 |
Male vs Females
| Males: | 1,035 |
| Females: | 726 |
Median age
| Males: | 35.3 years |
| Females: | 37.3 years |
Average estimated value of detached houses in 2021 (92.3% of all units):
| Golf Links: | $707,536 |
| Oakland: | $883,784 |
Most popular occupations of males: service occupations (32.2%); sales and office occupations (20.6%); community and social services occupations (13.1%); construction, extraction, and maintenance occupations (9.1%); management occupations (except farmers) (7.1%); education, training, and library occupations (5.0%); arts, design, entertainment, sports, and media occupations (2.8%)
Most popular occupations of females: business and financial operations occupations (15.3%); management occupations (except farmers) (14.6%); sales and office occupations (13.7%); education, training, and library occupations (12.9%); service occupations (9.9%); healthcare practitioners and technical occupations (6.3%); community and social services occupations (5.4%)
Limited-access highways (interstate or state) in this neighborhood: I- 580.
Roads and streets: Fontaine St; Fontaine; Golf Links Rd; Golf Links; Interstate 580 E; Ney Ave; Castlewood St; Oak Knoll Blvd; Calandria Ave; Crest Ave; el Monte Ave; Aster Ave; Margarita Ave; Blandon Rd; Granada Ave; Flintridge Ln; Mirasol Ave; Outlook Ave; Encina Way; Murillo Ave; Cosgrave Ave; Alcala Ave; Encina Ave; Greenly Dr; Flintridge Ave; Glenly Rd; Sarazen Ave; Twin Oaks Way; Cosgrave.
Golf Links neighborhood detailed profile
Grand Lake neighborhood in Oakland statistics: (Find on map)
Area: 0.229 square miles
Population: 4,473
Population density:
Median household income in 2021:
Median rent in in 2021:
Male vs Females
Median age
Average estimated '21 value of housing units in 5-or-more-unit structures (22.1% of all units):
Most popular occupations of males: service occupations (21.2%); sales and office occupations (11.7%); legal occupations (10.7%); management occupations (except farmers) (8.9%); business and financial operations occupations (7.9%); computer and mathematical occupations (7.5%); transportation occupations (5.6%)
Most popular occupations of females: management occupations (except farmers) (27.1%); education, training, and library occupations (13.1%); business and financial operations occupations (10.7%); service occupations (9.2%); sales and office occupations (7.8%); arts, design, entertainment, sports, and media occupations (7.7%); legal occupations (5.7%)
Limited-access highways (interstate or state) in this neighborhood: I- 580.
Roads and streets: Santa Clara Ave; Chetwood St; Jean St; Vernon St; Harrison St; Oakland Ave; Valle Vista Ave; Oakland; Santa Rosa Ave; Moss Ave; Elwood Ave; Mira Vista Ave; Mariposa Ave; Crescent St; Alta Vista Ave; Monte Vista Ave; Sunnyslope Ave; Bayo Vista Ave; W Macarthur; Adams; W Macarthur Blvd (Macarthur Blvd); Interstate 580 E.
Grand Lake neighborhood detailed profile
Area: 0.229 square miles
Population: 4,473
Population density:
| Grand Lake: | 19,491 people per square mile |
| Oakland: | 7,739 people per square mile |
Median household income in 2021:
| Grand Lake: | $122,207 |
| Oakland: | $82,236 |
Median rent in in 2021:
| Grand Lake: | $1,847 |
| Oakland: | $1,617 |
Male vs Females
| Males: | 2,094 |
| Females: | 2,378 |
Median age
| Males: | 39.3 years |
| Females: | 37.4 years |
Average estimated '21 value of housing units in 5-or-more-unit structures (22.1% of all units):
| Grand Lake: | $551,300 |
| Oakland: | $622,418 |
Most popular occupations of males: service occupations (21.2%); sales and office occupations (11.7%); legal occupations (10.7%); management occupations (except farmers) (8.9%); business and financial operations occupations (7.9%); computer and mathematical occupations (7.5%); transportation occupations (5.6%)
Most popular occupations of females: management occupations (except farmers) (27.1%); education, training, and library occupations (13.1%); business and financial operations occupations (10.7%); service occupations (9.2%); sales and office occupations (7.8%); arts, design, entertainment, sports, and media occupations (7.7%); legal occupations (5.7%)
Limited-access highways (interstate or state) in this neighborhood: I- 580.
Roads and streets: Santa Clara Ave; Chetwood St; Jean St; Vernon St; Harrison St; Oakland Ave; Valle Vista Ave; Oakland; Santa Rosa Ave; Moss Ave; Elwood Ave; Mira Vista Ave; Mariposa Ave; Crescent St; Alta Vista Ave; Monte Vista Ave; Sunnyslope Ave; Bayo Vista Ave; W Macarthur; Adams; W Macarthur Blvd (Macarthur Blvd); Interstate 580 E.
Grand Lake neighborhood detailed profile
Hacienda neighborhood in Oakland statistics: (Find on map)
Area: 0.106 square miles
Population: 1,274
Population density:
Median household income in 2021:
Median rent in in 2021:
Male vs Females
Median age
Most popular occupations of males: sales and office occupations (32.3%); service occupations (16.4%); construction, extraction, and maintenance occupations (15.0%); material moving occupations (7.4%); business and financial operations occupations (5.8%); computer and mathematical occupations (3.7%); management occupations (except farmers) (3.3%)
Most popular occupations of females: service occupations (32.7%); sales and office occupations (26.6%); education, training, and library occupations (11.2%); healthcare practitioners and technical occupations (10.0%); community and social services occupations (5.0%); production occupations (4.8%); management occupations (except farmers) (4.7%)
Roads and streets: 34th Ave; 35th Ave; Davis St; Salisbury St; Paxton Ave; Foothill Blvd; Harper St; 35th; Alexander Ct; Foothill; Eden Ln; Deering Ct.
Other features: Perlata Crk.
Hacienda neighborhood detailed profile
Area: 0.106 square miles
Population: 1,274
Population density:
| Hacienda (Peralta Hacienda): | 11,996 people per square mile |
| Oakland: | 7,739 people per square mile |
Median household income in 2021:
| Hacienda (Peralta Hacienda): | $66,755 |
| Oakland: | $82,236 |
Median rent in in 2021:
| Hacienda (Peralta Hacienda): | $1,433 |
| Oakland: | $1,617 |
Male vs Females
| Males: | 626 |
| Females: | 647 |
Median age
| Males: | 36.7 years |
| Females: | 36.1 years |
Most popular occupations of males: sales and office occupations (32.3%); service occupations (16.4%); construction, extraction, and maintenance occupations (15.0%); material moving occupations (7.4%); business and financial operations occupations (5.8%); computer and mathematical occupations (3.7%); management occupations (except farmers) (3.3%)
Most popular occupations of females: service occupations (32.7%); sales and office occupations (26.6%); education, training, and library occupations (11.2%); healthcare practitioners and technical occupations (10.0%); community and social services occupations (5.0%); production occupations (4.8%); management occupations (except farmers) (4.7%)
Roads and streets: 34th Ave; 35th Ave; Davis St; Salisbury St; Paxton Ave; Foothill Blvd; Harper St; 35th; Alexander Ct; Foothill; Eden Ln; Deering Ct.
Other features: Perlata Crk.
Hacienda neighborhood detailed profile
Harrington neighborhood in Oakland statistics: (Find on map)
Area: 0.166 square miles
Population: 4,834
Population density:
Median household income in 2021:
Median rent in in 2021:
Male vs Females
Median age
Average estimated value of detached houses in 2021 (31.6% of all units):
Most popular occupations of males: construction, extraction, and maintenance occupations (28.4%); sales and office occupations (21.4%); service occupations (14.5%); material moving occupations (10.3%); production occupations (9.0%); management occupations (except farmers) (4.5%); transportation occupations (2.4%)
Most popular occupations of females: management occupations (except farmers) (21.9%); service occupations (20.2%); sales and office occupations (19.7%); material moving occupations (9.0%); education, training, and library occupations (7.6%); production occupations (5.8%); healthcare practitioners and technical occupations (4.1%)
Roads and streets: 38th; Harrington Ave; 38th Ave; Ransom Ave; Santa Rita St; Foothill Blvd; Foothill; 36th Ave; Crosby Ave; Nevil St; Lyon Ave; Galindo St; Brookdale Ave; Gray St; San Juan St; Carrington Way; Carrington St; Baxter St; Harper St; Bridge Ave.
Harrington neighborhood detailed profile
Area: 0.166 square miles
Population: 4,834
Population density:
| Harrington: | 29,087 people per square mile |
| Oakland: | 7,739 people per square mile |
Median household income in 2021:
| Harrington: | $59,356 |
| Oakland: | $82,236 |
Median rent in in 2021:
| Harrington: | $1,500 |
| Oakland: | $1,617 |
Male vs Females
| Males: | 2,507 |
| Females: | 2,327 |
Median age
| Males: | 31.5 years |
| Females: | 35.7 years |
Average estimated value of detached houses in 2021 (31.6% of all units):
| Harrington: | $636,618 |
| Oakland: | $883,784 |
Most popular occupations of males: construction, extraction, and maintenance occupations (28.4%); sales and office occupations (21.4%); service occupations (14.5%); material moving occupations (10.3%); production occupations (9.0%); management occupations (except farmers) (4.5%); transportation occupations (2.4%)
Most popular occupations of females: management occupations (except farmers) (21.9%); service occupations (20.2%); sales and office occupations (19.7%); material moving occupations (9.0%); education, training, and library occupations (7.6%); production occupations (5.8%); healthcare practitioners and technical occupations (4.1%)
Roads and streets: 38th; Harrington Ave; 38th Ave; Ransom Ave; Santa Rita St; Foothill Blvd; Foothill; 36th Ave; Crosby Ave; Nevil St; Lyon Ave; Galindo St; Brookdale Ave; Gray St; San Juan St; Carrington Way; Carrington St; Baxter St; Harper St; Bridge Ave.
Harrington neighborhood detailed profile
Harrison Street neighborhood in Oakland statistics: (Find on map)
Area: 0.261 square miles
Population: 2,595
Population density:
Median household income in 2021:
Median rent in in 2021:
Male vs Females
Median age
Housing prices:
Average estimated value of detached houses in 2021 (8.4% of all units):
Average estimated value of townhouses or other attached units in 2021 (4.6% of all units):
Average estimated value of housing units in 2-unit structures in 2021 (3.1% of all units):
Average estimated '21 value of housing units in 3-to-4-unit structures (13.9% of all units):
Average estimated '21 value of housing units in 5-or-more-unit structures (27.8% of all units):
Most popular occupations of males: sales and office occupations (16.2%); management occupations (except farmers) (16.0%); computer and mathematical occupations (12.5%); service occupations (11.0%); arts, design, entertainment, sports, and media occupations (7.9%); production occupations (7.9%); architecture and engineering occupations (5.5%)
Most popular occupations of females: management occupations (except farmers) (25.4%); service occupations (17.7%); business and financial operations occupations (12.6%); sales and office occupations (11.3%); education, training, and library occupations (9.2%); computer and mathematical occupations (4.8%); legal occupations (4.0%)
Limited-access highways (interstate or state) in this neighborhood: I- 580.
Roads and streets: Broadway; Richmond Blvd; Harrison St; Fairmount Ave; Orange St; Oakland Ave; 29th St; Piedmont Ave; Piedmont; Frisbie St; Macarthur Blvd; Pearl St; Stanley Pl; Brook St; Kempton Ave; 30th St; 28th St; Harrison; Valdez St; Hamilton Pl; Randwick Ave; Perry Pl; Garland Ave; Croxton Ave; Westall Ave; Interstate 580; Warren Ave; Richmond Ave; Perkins Way; Vernon Ter (Veron Ter); Oakland; Interstate 580 E; Bay Pl (27th St); W Macarthur.
Harrison Street neighborhood detailed profile
Area: 0.261 square miles
Population: 2,595
Population density:
| Harrison Street: | 9,959 people per square mile |
| Oakland: | 7,739 people per square mile |
Median household income in 2021:
| Harrison Street: | $90,947 |
| Oakland: | $82,236 |
Median rent in in 2021:
| Harrison Street: | $1,724 |
| Oakland: | $1,617 |
Male vs Females
| Males: | 1,216 |
| Females: | 1,378 |
Median age
| Males: | 37.4 years |
| Females: | 34.0 years |
Housing prices:
Average estimated value of detached houses in 2021 (8.4% of all units):
| Harrison Street: | $8,725,723 |
| Oakland: | $883,784 |
Average estimated value of townhouses or other attached units in 2021 (4.6% of all units):
| This neighborhood: | $442,308 |
| city: | $744,263 |
Average estimated value of housing units in 2-unit structures in 2021 (3.1% of all units):
| This neighborhood: | $433,677 |
| Oakland: | $732,452 |
Average estimated '21 value of housing units in 3-to-4-unit structures (13.9% of all units):
| Harrison Street: | $461,200 |
| city: | $699,145 |
Average estimated '21 value of housing units in 5-or-more-unit structures (27.8% of all units):
| Harrison Street: | $551,300 |
| Oakland: | $622,418 |
Most popular occupations of males: sales and office occupations (16.2%); management occupations (except farmers) (16.0%); computer and mathematical occupations (12.5%); service occupations (11.0%); arts, design, entertainment, sports, and media occupations (7.9%); production occupations (7.9%); architecture and engineering occupations (5.5%)
Most popular occupations of females: management occupations (except farmers) (25.4%); service occupations (17.7%); business and financial operations occupations (12.6%); sales and office occupations (11.3%); education, training, and library occupations (9.2%); computer and mathematical occupations (4.8%); legal occupations (4.0%)
Limited-access highways (interstate or state) in this neighborhood: I- 580.
Roads and streets: Broadway; Richmond Blvd; Harrison St; Fairmount Ave; Orange St; Oakland Ave; 29th St; Piedmont Ave; Piedmont; Frisbie St; Macarthur Blvd; Pearl St; Stanley Pl; Brook St; Kempton Ave; 30th St; 28th St; Harrison; Valdez St; Hamilton Pl; Randwick Ave; Perry Pl; Garland Ave; Croxton Ave; Westall Ave; Interstate 580; Warren Ave; Richmond Ave; Perkins Way; Vernon Ter (Veron Ter); Oakland; Interstate 580 E; Bay Pl (27th St); W Macarthur.
Harrison Street neighborhood detailed profile
Havensourt neighborhood in Oakland statistics: (Find on map)
Area: 0.430 square miles
Population: 9,328
Population density:
Median household income in 2021:
Median rent in in 2021:
Male vs Females
Median age
Average estimated value of detached houses in 2021 (59.5% of all units):
Most popular occupations of males: construction, extraction, and maintenance occupations (19.9%); service occupations (19.8%); sales and office occupations (12.0%); production occupations (8.5%); computer and mathematical occupations (8.0%); arts, design, entertainment, sports, and media occupations (5.8%); education, training, and library occupations (5.7%)
Most popular occupations of females: service occupations (31.4%); sales and office occupations (22.2%); management occupations (except farmers) (10.3%); education, training, and library occupations (6.8%); production occupations (5.8%); business and financial operations occupations (5.7%); legal occupations (5.3%)
Highways in this neighborhood: State Hwy 185 (International Blvd, E 14th St).
Roads and streets: Bancroft Ave; Havenscourt Blvd; 67th Ave; 66th Ave; 65th Ave; 68th Ave; 73rd Ave; Avenal Ave; Bancroft; Arthur St; Havenscourt; 73rd; 64th Ave; 63rd Ave; International Blvd; Halliday Ave; Krause Ave; Fresno St; Fortune Way; 62nd Ave; Flora St; Church St; 61st Ave; Seminary Ave; Eastmont Mall (73rd Ave); 60th Ave; 66th; Flora.
Havensourt neighborhood detailed profile
Area: 0.430 square miles
Population: 9,328
Population density:
| Havensourt (Bancroft Business): | 21,697 people per square mile |
| Oakland: | 7,739 people per square mile |
Median household income in 2021:
| Havensourt (Bancroft Business): | $60,603 |
| Oakland: | $82,236 |
Median rent in in 2021:
| Havensourt (Bancroft Business): | $1,272 |
| Oakland: | $1,617 |
Male vs Females
| Males: | 3,759 |
| Females: | 5,569 |
Median age
| Males: | 34.2 years |
| Females: | 38.1 years |
Average estimated value of detached houses in 2021 (59.5% of all units):
| Havensourt (Bancroft Business): | $484,693 |
| Oakland: | $883,784 |
Most popular occupations of males: construction, extraction, and maintenance occupations (19.9%); service occupations (19.8%); sales and office occupations (12.0%); production occupations (8.5%); computer and mathematical occupations (8.0%); arts, design, entertainment, sports, and media occupations (5.8%); education, training, and library occupations (5.7%)
Most popular occupations of females: service occupations (31.4%); sales and office occupations (22.2%); management occupations (except farmers) (10.3%); education, training, and library occupations (6.8%); production occupations (5.8%); business and financial operations occupations (5.7%); legal occupations (5.3%)
Highways in this neighborhood: State Hwy 185 (International Blvd, E 14th St).
Roads and streets: Bancroft Ave; Havenscourt Blvd; 67th Ave; 66th Ave; 65th Ave; 68th Ave; 73rd Ave; Avenal Ave; Bancroft; Arthur St; Havenscourt; 73rd; 64th Ave; 63rd Ave; International Blvd; Halliday Ave; Krause Ave; Fresno St; Fortune Way; 62nd Ave; Flora St; Church St; 61st Ave; Seminary Ave; Eastmont Mall (73rd Ave); 60th Ave; 66th; Flora.
Havensourt neighborhood detailed profile
Hawthorne neighborhood in Oakland statistics: (Find on map)
Area: 0.163 square miles
Population: 2,782
Population density:
Median household income in 2021:
Median rent in in 2021:
Male vs Females
Median age
Housing prices:
Average estimated value of detached houses in 2021 (13.6% of all units):
Average estimated value of townhouses or other attached units in 2021 (7.2% of all units):
Most popular occupations of males: construction, extraction, and maintenance occupations (24.5%); service occupations (20.2%); sales and office occupations (10.9%); material moving occupations (10.4%); production occupations (8.5%); management occupations (except farmers) (6.3%); transportation occupations (3.5%)
Most popular occupations of females: sales and office occupations (29.4%); service occupations (21.4%); healthcare practitioners and technical occupations (11.2%); education, training, and library occupations (8.7%); farming, fishing, and forestry occupations (5.5%); business and financial operations occupations (5.4%); management occupations (except farmers) (4.7%)
Roads and streets: E 14th St (International Blvd); Fruitvale Ave; Fruitvale; E 12th St; 29th Ave; E 16th St; Derby Ave; 31st Ave; E 17th St; E 15th St; Foothill; E 19th St; Foothill Blvd; E 13th St; 30th Ave; E 18th St; 25th Ave; 26th Ave; Miller Ave; International Blvd.
Other features: Sausal Crk.
Hawthorne neighborhood detailed profile
Area: 0.163 square miles
Population: 2,782
Population density:
| Hawthorne: | 17,110 people per square mile |
| Oakland: | 7,739 people per square mile |
Median household income in 2021:
| Hawthorne: | $50,071 |
| Oakland: | $82,236 |
Median rent in in 2021:
| Hawthorne: | $1,231 |
| Oakland: | $1,617 |
Male vs Females
| Males: | 1,428 |
| Females: | 1,353 |
Median age
| Males: | 32.2 years |
| Females: | 35.8 years |
Housing prices:
Average estimated value of detached houses in 2021 (13.6% of all units):
| Hawthorne: | $652,739 |
| Oakland: | $883,784 |
Average estimated value of townhouses or other attached units in 2021 (7.2% of all units):
| This neighborhood: | $619,408 |
| city: | $744,263 |
Most popular occupations of males: construction, extraction, and maintenance occupations (24.5%); service occupations (20.2%); sales and office occupations (10.9%); material moving occupations (10.4%); production occupations (8.5%); management occupations (except farmers) (6.3%); transportation occupations (3.5%)
Most popular occupations of females: sales and office occupations (29.4%); service occupations (21.4%); healthcare practitioners and technical occupations (11.2%); education, training, and library occupations (8.7%); farming, fishing, and forestry occupations (5.5%); business and financial operations occupations (5.4%); management occupations (except farmers) (4.7%)
Roads and streets: E 14th St (International Blvd); Fruitvale Ave; Fruitvale; E 12th St; 29th Ave; E 16th St; Derby Ave; 31st Ave; E 17th St; E 15th St; Foothill; E 19th St; Foothill Blvd; E 13th St; 30th Ave; E 18th St; 25th Ave; 26th Ave; Miller Ave; International Blvd.
Other features: Sausal Crk.
Hawthorne neighborhood detailed profile
Hegenberger neighborhood in Oakland statistics: (Find on map)
Area: 0.134 square miles
Population: 3,009
Population density:
Median household income in 2021:
Median rent in in 2021:
Male vs Females
Median age
Average estimated value of detached houses in 2021 (70.4% of all units):
Most popular occupations of males: service occupations (20.9%); construction, extraction, and maintenance occupations (20.2%); sales and office occupations (10.3%); material moving occupations (10.3%); production occupations (8.2%); education, training, and library occupations (6.1%); farming, fishing, and forestry occupations (5.7%)
Most popular occupations of females: service occupations (31.5%); sales and office occupations (26.7%); healthcare practitioners and technical occupations (9.3%); education, training, and library occupations (8.5%); material moving occupations (5.2%); community and social services occupations (4.4%); business and financial operations occupations (4.3%)
Highways in this neighborhood: State Hwy 185 (International Blvd, E 14th St).
Roads and streets: 69th Ave; 70th Ave; 73rd Ave; 71st Ave; International Blvd; Church St; 72nd Ave; Weld St; Lockwood St; 73rd; Holly St; Favor St; Orral St; Flora St; Morken St; 71st.
Hegenberger neighborhood detailed profile
Area: 0.134 square miles
Population: 3,009
Population density:
| Hegenberger: | 22,415 people per square mile |
| Oakland: | 7,739 people per square mile |
Median household income in 2021:
| Hegenberger: | $61,465 |
| Oakland: | $82,236 |
Median rent in in 2021:
| Hegenberger: | $1,498 |
| Oakland: | $1,617 |
Male vs Females
| Males: | 1,424 |
| Females: | 1,585 |
Median age
| Males: | 31.1 years |
| Females: | 32.3 years |
Average estimated value of detached houses in 2021 (70.4% of all units):
| Hegenberger: | $469,277 |
| Oakland: | $883,784 |
Most popular occupations of males: service occupations (20.9%); construction, extraction, and maintenance occupations (20.2%); sales and office occupations (10.3%); material moving occupations (10.3%); production occupations (8.2%); education, training, and library occupations (6.1%); farming, fishing, and forestry occupations (5.7%)
Most popular occupations of females: service occupations (31.5%); sales and office occupations (26.7%); healthcare practitioners and technical occupations (9.3%); education, training, and library occupations (8.5%); material moving occupations (5.2%); community and social services occupations (4.4%); business and financial operations occupations (4.3%)
Highways in this neighborhood: State Hwy 185 (International Blvd, E 14th St).
Roads and streets: 69th Ave; 70th Ave; 73rd Ave; 71st Ave; International Blvd; Church St; 72nd Ave; Weld St; Lockwood St; 73rd; Holly St; Favor St; Orral St; Flora St; Morken St; 71st.
Hegenberger neighborhood detailed profile
Highland neighborhood in Oakland statistics: (Find on map)
Area: 0.284 square miles
Population: 4,643
Population density:
Median household income in 2021:
Median rent in in 2021:
Male vs Females
Median age
Average estimated value of detached houses in 2021 (56.2% of all units):
Most popular occupations of males: service occupations (25.5%); sales and office occupations (20.2%); construction, extraction, and maintenance occupations (18.1%); transportation occupations (9.8%); production occupations (6.8%); material moving occupations (6.7%); management occupations (except farmers) (2.2%)
Most popular occupations of females: sales and office occupations (28.8%); service occupations (26.3%); production occupations (16.2%); farming, fishing, and forestry occupations (10.6%); material moving occupations (5.0%); community and social services occupations (4.8%); education, training, and library occupations (3.1%)
Roads and streets: 92nd Ave; 86th Ave; 87th Ave; 88th Ave; 89th Ave; 90th Ave; 91st Ave; D St; G St; E St; B St; A St; San Leandro.
Railroad features: Union Pacific RR.
Highland neighborhood detailed profile
Area: 0.284 square miles
Population: 4,643
Population density:
| Highland: | 16,342 people per square mile |
| Oakland: | 7,739 people per square mile |
Median household income in 2021:
| Highland: | $43,926 |
| Oakland: | $82,236 |
Median rent in in 2021:
| Highland: | $1,369 |
| Oakland: | $1,617 |
Male vs Females
| Males: | 2,274 |
| Females: | 2,369 |
Median age
| Males: | 28.3 years |
| Females: | 33.0 years |
Average estimated value of detached houses in 2021 (56.2% of all units):
| Highland: | $356,613 |
| Oakland: | $883,784 |
Most popular occupations of males: service occupations (25.5%); sales and office occupations (20.2%); construction, extraction, and maintenance occupations (18.1%); transportation occupations (9.8%); production occupations (6.8%); material moving occupations (6.7%); management occupations (except farmers) (2.2%)
Most popular occupations of females: sales and office occupations (28.8%); service occupations (26.3%); production occupations (16.2%); farming, fishing, and forestry occupations (10.6%); material moving occupations (5.0%); community and social services occupations (4.8%); education, training, and library occupations (3.1%)
Roads and streets: 92nd Ave; 86th Ave; 87th Ave; 88th Ave; 89th Ave; 90th Ave; 91st Ave; D St; G St; E St; B St; A St; San Leandro.
Railroad features: Union Pacific RR.
Highland neighborhood detailed profile
Highland Park neighborhood in Oakland statistics: (Find on map)
Area: 0.159 square miles
Population: 2,608
Population density:
Median household income in 2021:
Median rent in in 2021:
Male vs Females
Median age
Average estimated value of detached houses in 2021 (31.4% of all units):
Most popular occupations of males: service occupations (21.5%); material moving occupations (11.7%); sales and office occupations (10.3%); education, training, and library occupations (9.7%); transportation occupations (8.0%); production occupations (7.9%); management occupations (except farmers) (6.6%)
Most popular occupations of females: service occupations (26.8%); sales and office occupations (18.4%); healthcare practitioners and technical occupations (10.5%); education, training, and library occupations (9.1%); management occupations (except farmers) (8.9%); community and social services occupations (6.6%); business and financial operations occupations (5.8%)
Roads and streets: 14th Ave; E 33rd St; E 34th St; E 31st St; Macarthur Blvd; 14th; E 32nd St; 13th Ave; Stuart St; E 25th St; Vallecito Pl; Beaumont Ave; E 25th Street Way.
Highland Park neighborhood detailed profile
Area: 0.159 square miles
Population: 2,608
Population density:
| Highland Park (Lynn): | 16,353 people per square mile |
| Oakland: | 7,739 people per square mile |
Median household income in 2021:
| Highland Park (Lynn): | $83,687 |
| Oakland: | $82,236 |
Median rent in in 2021:
| Highland Park (Lynn): | $1,243 |
| Oakland: | $1,617 |
Male vs Females
| Males: | 1,258 |
| Females: | 1,349 |
Median age
| Males: | 36.5 years |
| Females: | 36.5 years |
Average estimated value of detached houses in 2021 (31.4% of all units):
| Highland Park (Lynn): | $701,423 |
| Oakland: | $883,784 |
Most popular occupations of males: service occupations (21.5%); material moving occupations (11.7%); sales and office occupations (10.3%); education, training, and library occupations (9.7%); transportation occupations (8.0%); production occupations (7.9%); management occupations (except farmers) (6.6%)
Most popular occupations of females: service occupations (26.8%); sales and office occupations (18.4%); healthcare practitioners and technical occupations (10.5%); education, training, and library occupations (9.1%); management occupations (except farmers) (8.9%); community and social services occupations (6.6%); business and financial operations occupations (5.8%)
Roads and streets: 14th Ave; E 33rd St; E 34th St; E 31st St; Macarthur Blvd; 14th; E 32nd St; 13th Ave; Stuart St; E 25th St; Vallecito Pl; Beaumont Ave; E 25th Street Way.
Highland Park neighborhood detailed profile
Highland Terrace neighborhood in Oakland statistics: (Find on map)
Area: 0.191 square miles
Population: 4,093
Population density:
Median household income in 2021:
Median rent in in 2021:
Male vs Females
Median age
Average estimated value of detached houses in 2021 (43.7% of all units):
Most popular occupations of males: service occupations (18.5%); sales and office occupations (17.6%); production occupations (12.5%); transportation occupations (11.2%); material moving occupations (9.5%); arts, design, entertainment, sports, and media occupations (6.9%); healthcare practitioners and technical occupations (3.8%)
Most popular occupations of females: service occupations (30.1%); sales and office occupations (21.6%); business and financial operations occupations (9.0%); management occupations (except farmers) (8.9%); education, training, and library occupations (7.6%); arts, design, entertainment, sports, and media occupations (6.6%); healthcare practitioners and technical occupations (5.9%)
Roads and streets: E 22nd St; E 24th St; E 23rd St; E 25th St; 19th Ave; 19th; 23rd Ave; Highland Ave; 21st; 21st Ave; E 21st St; 23rd; 17th Ave; E 26th St; Wakefield Ave.
Highland Terrace neighborhood detailed profile
Area: 0.191 square miles
Population: 4,093
Population density:
| Highland Terrace: | 21,437 people per square mile |
| Oakland: | 7,739 people per square mile |
Median household income in 2021:
| Highland Terrace: | $62,704 |
| Oakland: | $82,236 |
Median rent in in 2021:
| Highland Terrace: | $1,382 |
| Oakland: | $1,617 |
Male vs Females
| Males: | 1,842 |
| Females: | 2,251 |
Median age
| Males: | 34.4 years |
| Females: | 35.6 years |
Average estimated value of detached houses in 2021 (43.7% of all units):
| Highland Terrace: | $560,939 |
| Oakland: | $883,784 |
Most popular occupations of males: service occupations (18.5%); sales and office occupations (17.6%); production occupations (12.5%); transportation occupations (11.2%); material moving occupations (9.5%); arts, design, entertainment, sports, and media occupations (6.9%); healthcare practitioners and technical occupations (3.8%)
Most popular occupations of females: service occupations (30.1%); sales and office occupations (21.6%); business and financial operations occupations (9.0%); management occupations (except farmers) (8.9%); education, training, and library occupations (7.6%); arts, design, entertainment, sports, and media occupations (6.6%); healthcare practitioners and technical occupations (5.9%)
Roads and streets: E 22nd St; E 24th St; E 23rd St; E 25th St; 19th Ave; 19th; 23rd Ave; Highland Ave; 21st; 21st Ave; E 21st St; 23rd; 17th Ave; E 26th St; Wakefield Ave.
Highland Terrace neighborhood detailed profile
Hiller Highlands neighborhood in Oakland statistics: (Find on map)
Area: 0.285 square miles
Population: 329
Population density:
Median household income in 2021:
Median rent in in 2021:
Male vs Females
Median age
Housing prices:
Average estimated value of detached houses in 2021 (93.2% of all units):
Average estimated value of townhouses or other attached units in 2021 (5.3% of all units):
Most popular occupations of males: management occupations (except farmers) (27.3%); service occupations (11.7%); sales and office occupations (11.2%); computer and mathematical occupations (10.0%); business and financial operations occupations (8.8%); life, physical, and social science occupations (7.3%); education, training, and library occupations (5.9%)
Most popular occupations of females: management occupations (except farmers) (30.2%); sales and office occupations (11.4%); education, training, and library occupations (10.1%); life, physical, and social science occupations (8.2%); healthcare practitioners and technical occupations (8.2%); legal occupations (6.7%); arts, design, entertainment, sports, and media occupations (6.4%)
Roads and streets: Hiller Dr; Caldecott Ln; State Hwy 24; Schooner Hill; Starview Dr; Spyglass Hill (Spy Glass Hill); Binnacle Hill; Tunnel Rd; N Hill Ct; Charing Cross Rd; Windward Hill; Broadway; Captains Cove; Clipper Hill; Treasure Hill; Yankee Hill; Grand View Dr; S Hill Ct; Hawks Hill Ct; Marlin Cove; Starview Ct.
Railroad features: Bay Area Rapid Transit RR.
Hiller Highlands neighborhood detailed profile
Area: 0.285 square miles
Population: 329
Population density:
| Hiller Highlands: | 1,154 people per square mile |
| Oakland: | 7,739 people per square mile |
Median household income in 2021:
| Hiller Highlands: | $216,141 |
| Oakland: | $82,236 |
Median rent in in 2021:
| Hiller Highlands: | $3,290 |
| Oakland: | $1,617 |
Male vs Females
| Males: | 160 |
| Females: | 169 |
Median age
| Males: | 50.2 years |
| Females: | 48.4 years |
Housing prices:
Average estimated value of detached houses in 2021 (93.2% of all units):
| Hiller Highlands: | $1,615,703 |
| Oakland: | $883,784 |
Average estimated value of townhouses or other attached units in 2021 (5.3% of all units):
| This neighborhood: | $1,114,980 |
| city: | $744,263 |
Most popular occupations of males: management occupations (except farmers) (27.3%); service occupations (11.7%); sales and office occupations (11.2%); computer and mathematical occupations (10.0%); business and financial operations occupations (8.8%); life, physical, and social science occupations (7.3%); education, training, and library occupations (5.9%)
Most popular occupations of females: management occupations (except farmers) (30.2%); sales and office occupations (11.4%); education, training, and library occupations (10.1%); life, physical, and social science occupations (8.2%); healthcare practitioners and technical occupations (8.2%); legal occupations (6.7%); arts, design, entertainment, sports, and media occupations (6.4%)
Roads and streets: Hiller Dr; Caldecott Ln; State Hwy 24; Schooner Hill; Starview Dr; Spyglass Hill (Spy Glass Hill); Binnacle Hill; Tunnel Rd; N Hill Ct; Charing Cross Rd; Windward Hill; Broadway; Captains Cove; Clipper Hill; Treasure Hill; Yankee Hill; Grand View Dr; S Hill Ct; Hawks Hill Ct; Marlin Cove; Starview Ct.
Railroad features: Bay Area Rapid Transit RR.
Hiller Highlands neighborhood detailed profile
Ironworks District neighborhood in Oakland statistics: (Find on map)
Area: 0.108 square miles
Roads and streets: 4th St; 5th St; 3rd St; 2nd St; Broadway; Brush St; Washington St; Grove St (Martin Luther King Jr Way); Castro St; Jefferson St; Clay St; Market; 5th; Embarcadero (Castro St).
Railroad features: Bay Area Rapid Transit RR; Union Pacific RR.
Ironworks District neighborhood detailed profile
Iveywood neighborhood in Oakland statistics: (Find on map)
Area: 0.199 square miles
Population: 3,501
Population density:
Median household income in 2021:
Median rent in in 2021:
Male vs Females
Median age
Housing prices:
Average estimated value of detached houses in 2021 (58.4% of all units):
Average estimated value of townhouses or other attached units in 2021 (11.4% of all units):
Average estimated '21 value of housing units in 5-or-more-unit structures (3.2% of all units):
Average estimated value of mobile home in 2021 (5.3% of all units):
Most popular occupations of males: construction, extraction, and maintenance occupations (22.0%); service occupations (15.1%); sales and office occupations (13.6%); transportation occupations (10.3%); material moving occupations (9.2%); production occupations (7.4%); management occupations (except farmers) (5.2%)
Most popular occupations of females: service occupations (24.1%); sales and office occupations (21.1%); education, training, and library occupations (12.6%); management occupations (except farmers) (11.5%); transportation occupations (6.1%); production occupations (5.3%); community and social services occupations (5.0%)
Highways in this neighborhood: State Hwy 185 (International Blvd, E 14th St).
Roads and streets: 102nd Ave; 100th Ave; 101st Ave; 103rd Ave; 99th Ave; 104th Ave; Birch St; Sunnyside St; Plymouth St; Walnut St; International Blvd; Warner Ave; Olive St; Holly St; Cherry St; 104th; 103rd.
Iveywood neighborhood detailed profile
Area: 0.199 square miles
Population: 3,501
Population density:
| Iveywood: | 17,616 people per square mile |
| Oakland: | 7,739 people per square mile |
Median household income in 2021:
| Iveywood: | $59,735 |
| Oakland: | $82,236 |
Median rent in in 2021:
| Iveywood: | $1,450 |
| Oakland: | $1,617 |
Male vs Females
| Males: | 1,885 |
| Females: | 1,616 |
Median age
| Males: | 31.1 years |
| Females: | 35.8 years |
Housing prices:
Average estimated value of detached houses in 2021 (58.4% of all units):
| Iveywood: | $395,653 |
| Oakland: | $883,784 |
Average estimated value of townhouses or other attached units in 2021 (11.4% of all units):
| This neighborhood: | $1,830,000 |
| city: | $744,263 |
Average estimated '21 value of housing units in 5-or-more-unit structures (3.2% of all units):
| Iveywood: | $363,043 |
| Oakland: | $622,418 |
Average estimated value of mobile home in 2021 (5.3% of all units):
| Iveywood: | $390,573 |
| Oakland: | $326,796 |
Most popular occupations of males: construction, extraction, and maintenance occupations (22.0%); service occupations (15.1%); sales and office occupations (13.6%); transportation occupations (10.3%); material moving occupations (9.2%); production occupations (7.4%); management occupations (except farmers) (5.2%)
Most popular occupations of females: service occupations (24.1%); sales and office occupations (21.1%); education, training, and library occupations (12.6%); management occupations (except farmers) (11.5%); transportation occupations (6.1%); production occupations (5.3%); community and social services occupations (5.0%)
Highways in this neighborhood: State Hwy 185 (International Blvd, E 14th St).
Roads and streets: 102nd Ave; 100th Ave; 101st Ave; 103rd Ave; 99th Ave; 104th Ave; Birch St; Sunnyside St; Plymouth St; Walnut St; International Blvd; Warner Ave; Olive St; Holly St; Cherry St; 104th; 103rd.
Iveywood neighborhood detailed profile
Ivy Hill neighborhood in Oakland statistics: (Find on map)
Area: 0.165 square miles
Population: 3,806
Population density:
Median household income in 2021:
Median rent in in 2021:
Male vs Females
Median age
Most popular occupations of males: management occupations (except farmers) (16.9%); business and financial operations occupations (13.4%); service occupations (12.3%); sales and office occupations (9.8%); education, training, and library occupations (8.0%); arts, design, entertainment, sports, and media occupations (6.6%); construction, extraction, and maintenance occupations (5.1%)
Most popular occupations of females: management occupations (except farmers) (24.6%); sales and office occupations (19.0%); service occupations (13.6%); arts, design, entertainment, sports, and media occupations (9.5%); healthcare practitioners and technical occupations (6.7%); education, training, and library occupations (5.9%); business and financial operations occupations (3.9%)
Roads and streets: Park; 7th Ave; Ivy Dr; Park Blvd; 8th Ave; 5th Ave; E 20th St; E 19th St; E 21st St; E 22nd St; 5th; E 23rd St; E 28th St; 6th Ave; Beatie St; 3rd Ave; E 33rd St; E 24th St; Booker St; Carroll St; Wayne Pl; Montclair.
Ivy Hill neighborhood detailed profile
Area: 0.165 square miles
Population: 3,806
Population density:
| Ivy Hill: | 23,058 people per square mile |
| Oakland: | 7,739 people per square mile |
Median household income in 2021:
| Ivy Hill: | $88,220 |
| Oakland: | $82,236 |
Median rent in in 2021:
| Ivy Hill: | $1,645 |
| Oakland: | $1,617 |
Male vs Females
| Males: | 1,748 |
| Females: | 2,057 |
Median age
| Males: | 40.2 years |
| Females: | 38.7 years |
Most popular occupations of males: management occupations (except farmers) (16.9%); business and financial operations occupations (13.4%); service occupations (12.3%); sales and office occupations (9.8%); education, training, and library occupations (8.0%); arts, design, entertainment, sports, and media occupations (6.6%); construction, extraction, and maintenance occupations (5.1%)
Most popular occupations of females: management occupations (except farmers) (24.6%); sales and office occupations (19.0%); service occupations (13.6%); arts, design, entertainment, sports, and media occupations (9.5%); healthcare practitioners and technical occupations (6.7%); education, training, and library occupations (5.9%); business and financial operations occupations (3.9%)
Roads and streets: Park; 7th Ave; Ivy Dr; Park Blvd; 8th Ave; 5th Ave; E 20th St; E 19th St; E 21st St; E 22nd St; 5th; E 23rd St; E 28th St; 6th Ave; Beatie St; 3rd Ave; E 33rd St; E 24th St; Booker St; Carroll St; Wayne Pl; Montclair.
Ivy Hill neighborhood detailed profile
Jack London Square neighborhood in Oakland statistics: (Find on map)
Area: 0.042 square miles
Roads and streets: Jack London Sq (Water St); Embarcadero W (1st St); Posey Tube (State Rte 260, Harrison St); Franklin St; Washington St (Jack London Sq); Clay St; Broadway.
Jack London Square neighborhood detailed profile
Area: 0.042 square miles
Roads and streets: Jack London Sq (Water St); Embarcadero W (1st St); Posey Tube (State Rte 260, Harrison St); Franklin St; Washington St (Jack London Sq); Clay St; Broadway.
Jack London Square neighborhood detailed profile
Jefferson neighborhood in Oakland statistics: (Find on map)
Area: 0.230 square miles
Population: 4,628
Population density:
Median household income in 2021:
Median rent in in 2021:
Male vs Females
Median age
Average estimated value of detached houses in 2021 (32.9% of all units):
Most popular occupations of males: service occupations (21.0%); sales and office occupations (20.1%); construction, extraction, and maintenance occupations (15.5%); production occupations (8.6%); transportation occupations (7.8%); management occupations (except farmers) (5.1%); computer and mathematical occupations (4.5%)
Most popular occupations of females: sales and office occupations (31.5%); service occupations (18.7%); management occupations (except farmers) (11.9%); material moving occupations (11.0%); education, training, and library occupations (10.1%); healthcare practitioners and technical occupations (4.5%); life, physical, and social science occupations (3.3%)
Roads and streets: High St; Rosedale Ave; 40th Ave; 42nd Ave; 41st Ave; High; Carrington St; 39th Ave; Santa Rita St; Aqua Vista St; Foothill Blvd; Foothill; Mera St; Courtland Ave; 42nd; San Carlos Walk; 38th Ave; San Juan St; Rosedale.
Jefferson neighborhood detailed profile
Area: 0.230 square miles
Population: 4,628
Population density:
| Jefferson: | 20,147 people per square mile |
| Oakland: | 7,739 people per square mile |
Median household income in 2021:
| Jefferson: | $56,658 |
| Oakland: | $82,236 |
Median rent in in 2021:
| Jefferson: | $1,434 |
| Oakland: | $1,617 |
Male vs Females
| Males: | 2,121 |
| Females: | 2,507 |
Median age
| Males: | 32.5 years |
| Females: | 34.0 years |
Average estimated value of detached houses in 2021 (32.9% of all units):
| Jefferson: | $636,618 |
| Oakland: | $883,784 |
Most popular occupations of males: service occupations (21.0%); sales and office occupations (20.1%); construction, extraction, and maintenance occupations (15.5%); production occupations (8.6%); transportation occupations (7.8%); management occupations (except farmers) (5.1%); computer and mathematical occupations (4.5%)
Most popular occupations of females: sales and office occupations (31.5%); service occupations (18.7%); management occupations (except farmers) (11.9%); material moving occupations (11.0%); education, training, and library occupations (10.1%); healthcare practitioners and technical occupations (4.5%); life, physical, and social science occupations (3.3%)
Roads and streets: High St; Rosedale Ave; 40th Ave; 42nd Ave; 41st Ave; High; Carrington St; 39th Ave; Santa Rita St; Aqua Vista St; Foothill Blvd; Foothill; Mera St; Courtland Ave; 42nd; San Carlos Walk; 38th Ave; San Juan St; Rosedale.
Jefferson neighborhood detailed profile
Lake Merritt District neighborhood in Oakland statistics: (Find on map)
Area: 0.070 square miles
Population: 1,242
Population density:
Median household income in 2021:
Median rent in in 2021:
Male vs Females
Median age
Most popular occupations of males: service occupations (25.8%); management occupations (except farmers) (14.9%); business and financial operations occupations (7.1%); computer and mathematical occupations (6.9%); production occupations (6.6%); sales and office occupations (6.4%); architecture and engineering occupations (5.4%)
Most popular occupations of females: service occupations (20.8%); sales and office occupations (19.3%); arts, design, entertainment, sports, and media occupations (13.8%); healthcare practitioners and technical occupations (12.7%); business and financial operations occupations (11.3%); computer and mathematical occupations (8.8%); management occupations (except farmers) (7.2%)
Roads and streets: Harrison St; 22nd St; 21st St; Webster St; Grand Ave; 20th St; Franklin St; 21st; Grand; 20th; Kaiser Plz (Valdez St); Harrison.
Lake Merritt District neighborhood detailed profile
Area: 0.070 square miles
Population: 1,242
Population density:
| Lake Merritt District: | 17,731 people per square mile |
| Oakland: | 7,739 people per square mile |
Median household income in 2021:
| Lake Merritt District: | $33,157 |
| Oakland: | $82,236 |
Median rent in in 2021:
| Lake Merritt District: | $1,116 |
| Oakland: | $1,617 |
Male vs Females
| Males: | 659 |
| Females: | 582 |
Median age
| Males: | 40.3 years |
| Females: | 35.0 years |
Most popular occupations of males: service occupations (25.8%); management occupations (except farmers) (14.9%); business and financial operations occupations (7.1%); computer and mathematical occupations (6.9%); production occupations (6.6%); sales and office occupations (6.4%); architecture and engineering occupations (5.4%)
Most popular occupations of females: service occupations (20.8%); sales and office occupations (19.3%); arts, design, entertainment, sports, and media occupations (13.8%); healthcare practitioners and technical occupations (12.7%); business and financial operations occupations (11.3%); computer and mathematical occupations (8.8%); management occupations (except farmers) (7.2%)
Roads and streets: Harrison St; 22nd St; 21st St; Webster St; Grand Ave; 20th St; Franklin St; 21st; Grand; 20th; Kaiser Plz (Valdez St); Harrison.
Lake Merritt District neighborhood detailed profile
Lakeshore neighborhood in Oakland statistics: (Find on map)
Area: 0.268 square miles
Population: 4,141
Population density:
Median household income in 2021:
Median rent in in 2021:
Male vs Females
Median age
Average estimated value of detached houses in 2021 (24.8% of all units):
Most popular occupations of males: management occupations (except farmers) (21.9%); business and financial operations occupations (11.6%); architecture and engineering occupations (9.0%); arts, design, entertainment, sports, and media occupations (8.8%); legal occupations (8.5%); service occupations (7.5%); education, training, and library occupations (7.3%)
Most popular occupations of females: management occupations (except farmers) (19.7%); business and financial operations occupations (19.1%); sales and office occupations (12.4%); healthcare practitioners and technical occupations (11.4%); service occupations (9.1%); education, training, and library occupations (7.7%); life, physical, and social science occupations (4.7%)
Roads and streets: Lakeshore Ave; Warfield Ave; Grand; Grand Ave; Walker Ave; Weldon Ave; Boulevard Way; Mandana Blvd; Fairbanks Ave; Vermont St; Rand Ave; Lakeshore; Kenmore Ave; Prince St; Crofton Ave; York St; Erie St; Rosal Ave; Winsor Ave; Davidson Way; Harvard Rd; Walavista Ave; Lake Park Ave; Wickson Ave; Annerley Rd; Glenview Ave; Lake Park Way; Scott St; Cheney Ave; Sylvan Way; Wildwood Ave; Santa Clara Ave; Portsmouth Rd; Rosal.
Lakeshore neighborhood detailed profile
Area: 0.268 square miles
Population: 4,141
Population density:
| Lakeshore: | 15,471 people per square mile |
| Oakland: | 7,739 people per square mile |
Median household income in 2021:
| Lakeshore: | $170,724 |
| Oakland: | $82,236 |
Median rent in in 2021:
| Lakeshore: | $1,987 |
| Oakland: | $1,617 |
Male vs Females
| Males: | 1,955 |
| Females: | 2,186 |
Median age
| Males: | 41.5 years |
| Females: | 41.8 years |
Average estimated value of detached houses in 2021 (24.8% of all units):
| Lakeshore: | $1,346,308 |
| Oakland: | $883,784 |
Most popular occupations of males: management occupations (except farmers) (21.9%); business and financial operations occupations (11.6%); architecture and engineering occupations (9.0%); arts, design, entertainment, sports, and media occupations (8.8%); legal occupations (8.5%); service occupations (7.5%); education, training, and library occupations (7.3%)
Most popular occupations of females: management occupations (except farmers) (19.7%); business and financial operations occupations (19.1%); sales and office occupations (12.4%); healthcare practitioners and technical occupations (11.4%); service occupations (9.1%); education, training, and library occupations (7.7%); life, physical, and social science occupations (4.7%)
Roads and streets: Lakeshore Ave; Warfield Ave; Grand; Grand Ave; Walker Ave; Weldon Ave; Boulevard Way; Mandana Blvd; Fairbanks Ave; Vermont St; Rand Ave; Lakeshore; Kenmore Ave; Prince St; Crofton Ave; York St; Erie St; Rosal Ave; Winsor Ave; Davidson Way; Harvard Rd; Walavista Ave; Lake Park Ave; Wickson Ave; Annerley Rd; Glenview Ave; Lake Park Way; Scott St; Cheney Ave; Sylvan Way; Wildwood Ave; Santa Clara Ave; Portsmouth Rd; Rosal.
Lakeshore neighborhood detailed profile
Lakewide neighborhood in Oakland statistics: (Find on map)
Area: 0.215 square miles
Population: 1,836
Population density:
Median household income in 2021:
Median rent in in 2021:
Male vs Females
Median age
Most popular occupations of males: architecture and engineering occupations (25.8%); education, training, and library occupations (17.8%); computer and mathematical occupations (11.7%); service occupations (9.7%); sales and office occupations (8.1%); healthcare practitioners and technical occupations (7.5%); management occupations (except farmers) (6.6%)
Most popular occupations of females: education, training, and library occupations (23.8%); sales and office occupations (23.0%); business and financial operations occupations (14.7%); arts, design, entertainment, sports, and media occupations (11.6%); healthcare practitioners and technical occupations (10.9%); service occupations (6.6%); legal occupations (5.0%)
Roads and streets: Lakeside Dr; Grand Ave; 17th St; Jackson St; 19th St; Madison St; Harrison St; 15th St; Alice St; 20th; Harrison.
Lakewide neighborhood detailed profile
Area: 0.215 square miles
Population: 1,836
Population density:
| Lakewide: | 8,527 people per square mile |
| Oakland: | 7,739 people per square mile |
Median household income in 2021:
| Lakewide: | $33,157 |
| Oakland: | $82,236 |
Median rent in in 2021:
| Lakewide: | $1,345 |
| Oakland: | $1,617 |
Male vs Females
| Males: | 878 |
| Females: | 957 |
Median age
| Males: | 40.3 years |
| Females: | 35.0 years |
Most popular occupations of males: architecture and engineering occupations (25.8%); education, training, and library occupations (17.8%); computer and mathematical occupations (11.7%); service occupations (9.7%); sales and office occupations (8.1%); healthcare practitioners and technical occupations (7.5%); management occupations (except farmers) (6.6%)
Most popular occupations of females: education, training, and library occupations (23.8%); sales and office occupations (23.0%); business and financial operations occupations (14.7%); arts, design, entertainment, sports, and media occupations (11.6%); healthcare practitioners and technical occupations (10.9%); service occupations (6.6%); legal occupations (5.0%)
Roads and streets: Lakeside Dr; Grand Ave; 17th St; Jackson St; 19th St; Madison St; Harrison St; 15th St; Alice St; 20th; Harrison.
Lakewide neighborhood detailed profile
Laney neighborhood in Oakland statistics: (Find on map)
Area: 0.145 square miles
Population: 692
Population density:
Median household income in 2021:
Median rent in in 2021:
Male vs Females
Median age
Most popular occupations of males: service occupations (29.3%); management occupations (except farmers) (13.1%); sales and office occupations (11.0%); material moving occupations (9.1%); production occupations (8.5%); computer and mathematical occupations (7.3%); healthcare practitioners and technical occupations (5.3%)
Most popular occupations of females: service occupations (41.4%); management occupations (except farmers) (15.7%); production occupations (11.3%); sales and office occupations (8.6%); community and social services occupations (6.6%); arts, design, entertainment, sports, and media occupations (5.7%); material moving occupations (4.2%)
Roads and streets: E 8th; 10th St; 7th St; E 8th St; Fallon St; E 10th; 5th; 5th Ave; 8th; E 10th St.
Railroad features: Union Pacific RR.
Other features: Merritt Chnnl.
Laney neighborhood detailed profile
Area: 0.145 square miles
Population: 692
Population density:
| Laney (Peralta/Laney): | 4,766 people per square mile |
| Oakland: | 7,739 people per square mile |
Median household income in 2021:
| Laney (Peralta/Laney): | $72,058 |
| Oakland: | $82,236 |
Median rent in in 2021:
| Laney (Peralta/Laney): | $1,175 |
| Oakland: | $1,617 |
Male vs Females
| Males: | 342 |
| Females: | 350 |
Median age
| Males: | 40.3 years |
| Females: | 44.3 years |
Most popular occupations of males: service occupations (29.3%); management occupations (except farmers) (13.1%); sales and office occupations (11.0%); material moving occupations (9.1%); production occupations (8.5%); computer and mathematical occupations (7.3%); healthcare practitioners and technical occupations (5.3%)
Most popular occupations of females: service occupations (41.4%); management occupations (except farmers) (15.7%); production occupations (11.3%); sales and office occupations (8.6%); community and social services occupations (6.6%); arts, design, entertainment, sports, and media occupations (5.7%); material moving occupations (4.2%)
Roads and streets: E 8th; 10th St; 7th St; E 8th St; Fallon St; E 10th; 5th; 5th Ave; 8th; E 10th St.
Railroad features: Union Pacific RR.
Other features: Merritt Chnnl.
Laney neighborhood detailed profile
Las Palmas neighborhood in Oakland statistics: (Find on map)
Area: 0.193 square miles
Population: 2,847
Population density:
Median household income in 2021:
Median rent in in 2021:
Male vs Females
Median age
Housing prices:
Average estimated value of detached houses in 2021 (67.1% of all units):
Average estimated value of townhouses or other attached units in 2021 (7.3% of all units):
Average estimated '21 value of housing units in 5-or-more-unit structures (1.2% of all units):
Average estimated value of mobile home in 2021 (3.1% of all units):
Most popular occupations of males: service occupations (28.6%); construction, extraction, and maintenance occupations (19.5%); sales and office occupations (16.4%); transportation occupations (11.8%); production occupations (7.4%); material moving occupations (3.9%); computer and mathematical occupations (3.8%)
Most popular occupations of females: service occupations (36.5%); sales and office occupations (33.8%); community and social services occupations (7.5%); management occupations (except farmers) (5.7%); education, training, and library occupations (5.3%); healthcare practitioners and technical occupations (4.3%); material moving occupations (3.1%)
Roads and streets: Bancroft Ave; Voltaire Ave; Bancroft; Longfellow Ave; Dante Ave; Durant Ave; 107th Ave; 108th Ave; 109th Ave; 106th Ave; 100th Ave; 99th Ave; 103rd Ave; Myers St; Warner Ave; Elmar Ave; 106th; Toler Ave; Link; Byron Ave.
Las Palmas neighborhood detailed profile
Area: 0.193 square miles
Population: 2,847
Population density:
| Las Palmas: | 14,788 people per square mile |
| Oakland: | 7,739 people per square mile |
Median household income in 2021:
| Las Palmas: | $83,255 |
| Oakland: | $82,236 |
Median rent in in 2021:
| Las Palmas: | $1,646 |
| Oakland: | $1,617 |
Male vs Females
| Males: | 1,073 |
| Females: | 1,774 |
Median age
| Males: | 35.8 years |
| Females: | 37.8 years |
Housing prices:
Average estimated value of detached houses in 2021 (67.1% of all units):
| Las Palmas: | $468,512 |
| Oakland: | $883,784 |
Average estimated value of townhouses or other attached units in 2021 (7.3% of all units):
| This neighborhood: | $411,111 |
| city: | $744,263 |
Average estimated '21 value of housing units in 5-or-more-unit structures (1.2% of all units):
| Las Palmas: | $363,043 |
| Oakland: | $622,418 |
Average estimated value of mobile home in 2021 (3.1% of all units):
| Las Palmas: | $390,573 |
| Oakland: | $326,796 |
Most popular occupations of males: service occupations (28.6%); construction, extraction, and maintenance occupations (19.5%); sales and office occupations (16.4%); transportation occupations (11.8%); production occupations (7.4%); material moving occupations (3.9%); computer and mathematical occupations (3.8%)
Most popular occupations of females: service occupations (36.5%); sales and office occupations (33.8%); community and social services occupations (7.5%); management occupations (except farmers) (5.7%); education, training, and library occupations (5.3%); healthcare practitioners and technical occupations (4.3%); material moving occupations (3.1%)
Roads and streets: Bancroft Ave; Voltaire Ave; Bancroft; Longfellow Ave; Dante Ave; Durant Ave; 107th Ave; 108th Ave; 109th Ave; 106th Ave; 100th Ave; 99th Ave; 103rd Ave; Myers St; Warner Ave; Elmar Ave; 106th; Toler Ave; Link; Byron Ave.
Las Palmas neighborhood detailed profile
Laurel neighborhood in Oakland statistics: (Find on map)
Area: 0.120 square miles
Population: 1,594
Population density:
Median household income in 2021:
Median rent in in 2021:
Male vs Females
Median age
Housing prices:
Average estimated value of detached houses in 2021 (54.6% of all units):
Average estimated value of townhouses or other attached units in 2021 (5.1% of all units):
Average estimated '21 value of housing units in 3-to-4-unit structures (10.6% of all units):
Average estimated '21 value of housing units in 5-or-more-unit structures (6.5% of all units):
Most popular occupations of males: construction, extraction, and maintenance occupations (28.9%); business and financial operations occupations (19.6%); sales and office occupations (13.9%); education, training, and library occupations (11.3%); architecture and engineering occupations (9.9%); healthcare practitioners and technical occupations (7.1%); service occupations (3.8%)
Most popular occupations of females: service occupations (37.1%); sales and office occupations (22.4%); education, training, and library occupations (10.1%); management occupations (except farmers) (10.0%); material moving occupations (6.1%); production occupations (5.3%); healthcare practitioners and technical occupations (3.6%)
Limited-access highways (interstate or state) in this neighborhood: I- 580.
Roads and streets: Redding St; Macarthur Blvd; Quigley St; 38th Ave; 35th Ave; Loma Vista Ave; High St; Delaware St; Interstate 580 E; Maybelle Ave; 39th Ave; Georgia St; Dakota St; Midvale Ave; Quigley Ln (Quigley St).
Other features: Perlata Crk.
Laurel neighborhood detailed profile
Area: 0.120 square miles
Population: 1,594
Population density:
| Laurel: | 13,264 people per square mile |
| Oakland: | 7,739 people per square mile |
Median household income in 2021:
| Laurel: | $91,836 |
| Oakland: | $82,236 |
Median rent in in 2021:
| Laurel: | $1,268 |
| Oakland: | $1,617 |
Male vs Females
| Males: | 782 |
| Females: | 811 |
Median age
| Males: | 39.6 years |
| Females: | 37.5 years |
Housing prices:
Average estimated value of detached houses in 2021 (54.6% of all units):
| Laurel: | $455,594 |
| Oakland: | $883,784 |
Average estimated value of townhouses or other attached units in 2021 (5.1% of all units):
| This neighborhood: | $515,000 |
| city: | $744,263 |
Average estimated '21 value of housing units in 3-to-4-unit structures (10.6% of all units):
| Laurel: | $517,200 |
| city: | $699,145 |
Average estimated '21 value of housing units in 5-or-more-unit structures (6.5% of all units):
| Laurel: | $474,096 |
| Oakland: | $622,418 |
Most popular occupations of males: construction, extraction, and maintenance occupations (28.9%); business and financial operations occupations (19.6%); sales and office occupations (13.9%); education, training, and library occupations (11.3%); architecture and engineering occupations (9.9%); healthcare practitioners and technical occupations (7.1%); service occupations (3.8%)
Most popular occupations of females: service occupations (37.1%); sales and office occupations (22.4%); education, training, and library occupations (10.1%); management occupations (except farmers) (10.0%); material moving occupations (6.1%); production occupations (5.3%); healthcare practitioners and technical occupations (3.6%)
Limited-access highways (interstate or state) in this neighborhood: I- 580.
Roads and streets: Redding St; Macarthur Blvd; Quigley St; 38th Ave; 35th Ave; Loma Vista Ave; High St; Delaware St; Interstate 580 E; Maybelle Ave; 39th Ave; Georgia St; Dakota St; Midvale Ave; Quigley Ln (Quigley St).
Other features: Perlata Crk.
Laurel neighborhood detailed profile
Leona Heights neighborhood in Oakland statistics: (Find on map)
Area: 0.377 square miles
Population: 199
Population density:
Median household income in 2021:
Median rent in in 2021:
Male vs Females
Median age
Housing prices:
Average estimated value of detached houses in 2021 (30.9% of all units):
Average estimated value of townhouses or other attached units in 2021 (20.9% of all units):
Average estimated '21 value of housing units in 3-to-4-unit structures (34.5% of all units):
Average estimated '21 value of housing units in 5-or-more-unit structures (7.3% of all units):
Most popular occupations of males: computer and mathematical occupations (15.7%); service occupations (14.5%); management occupations (except farmers) (13.1%); transportation occupations (12.2%); material moving occupations (12.0%); sales and office occupations (6.3%); healthcare practitioners and technical occupations (5.3%)
Most popular occupations of females: sales and office occupations (33.7%); arts, design, entertainment, sports, and media occupations (14.6%); computer and mathematical occupations (13.0%); education, training, and library occupations (9.3%); management occupations (except farmers) (7.5%); service occupations (7.5%); business and financial operations occupations (4.9%)
Limited-access highways (interstate or state) in this neighborhood: I- 580.
Roads and streets: Leona St; Redwood Rd; Mountain View Ave; Russell Ave; Mountain Blvd; Edenvale; Bermuda Ave; Belfast Ave; Stauffer Pl; Twitter Ct; Kuhnle; Stauffer Ct.
Leona Heights neighborhood detailed profile
Area: 0.377 square miles
Population: 199
Population density:
| Leona Heights: | 528 people per square mile |
| Oakland: | 7,739 people per square mile |
Median household income in 2021:
| Leona Heights: | $109,778 |
| Oakland: | $82,236 |
Median rent in in 2021:
| Leona Heights: | $2,045 |
| Oakland: | $1,617 |
Male vs Females
| Males: | 99 |
| Females: | 100 |
Median age
| Males: | 42.8 years |
| Females: | 43.2 years |
Housing prices:
Average estimated value of detached houses in 2021 (30.9% of all units):
| Leona Heights: | $947,518 |
| Oakland: | $883,784 |
Average estimated value of townhouses or other attached units in 2021 (20.9% of all units):
| This neighborhood: | $665,882 |
| city: | $744,263 |
Average estimated '21 value of housing units in 3-to-4-unit structures (34.5% of all units):
| Leona Heights: | $582,989 |
| city: | $699,145 |
Average estimated '21 value of housing units in 5-or-more-unit structures (7.3% of all units):
| Leona Heights: | $560,469 |
| Oakland: | $622,418 |
Most popular occupations of males: computer and mathematical occupations (15.7%); service occupations (14.5%); management occupations (except farmers) (13.1%); transportation occupations (12.2%); material moving occupations (12.0%); sales and office occupations (6.3%); healthcare practitioners and technical occupations (5.3%)
Most popular occupations of females: sales and office occupations (33.7%); arts, design, entertainment, sports, and media occupations (14.6%); computer and mathematical occupations (13.0%); education, training, and library occupations (9.3%); management occupations (except farmers) (7.5%); service occupations (7.5%); business and financial operations occupations (4.9%)
Limited-access highways (interstate or state) in this neighborhood: I- 580.
Roads and streets: Leona St; Redwood Rd; Mountain View Ave; Russell Ave; Mountain Blvd; Edenvale; Bermuda Ave; Belfast Ave; Stauffer Pl; Twitter Ct; Kuhnle; Stauffer Ct.
Leona Heights neighborhood detailed profile
Lincoln Highlands neighborhood in Oakland statistics: (Find on map)
Area: 0.417 square miles
Population: 2,704
Population density:
Median household income in 2021:
Median rent in in 2021:
Male vs Females
Median age
Housing prices:
Average estimated value of detached houses in 2021 (91.9% of all units):
Average estimated value of townhouses or other attached units in 2021 (8.1% of all units):
Most popular occupations of males: management occupations (except farmers) (24.7%); arts, design, entertainment, sports, and media occupations (14.6%); service occupations (12.8%); education, training, and library occupations (8.9%); computer and mathematical occupations (8.5%); architecture and engineering occupations (7.0%); legal occupations (4.9%)
Most popular occupations of females: management occupations (except farmers) (27.4%); sales and office occupations (12.1%); service occupations (10.6%); life, physical, and social science occupations (8.1%); business and financial operations occupations (7.9%); healthcare practitioners and technical occupations (7.9%); arts, design, entertainment, sports, and media occupations (5.3%)
Roads and streets: Frye St; Coolidge Ave; Monterey Blvd; Maple Ave; Alida St; Laguna Ave; Rettig Ave; Rhoda Ave; Carlsen St; Morgan Ave; Wilshire Blvd; Maiden Ln; Jordan Rd; London Rd; Barner Ave; Wisconsin St; Charleston St; Sylvan Ave; Laurel Ave; Kitchener Ct; Sylhowe Rd; Camellia Pl; Lincoln Ave; Steinmetz Way; Coolidge Ter; Carmel St; Rettig Pl; Jordon Rd; Linnet Ave; Alida Ct; Barner Pl.
Lincoln Highlands neighborhood detailed profile
Area: 0.417 square miles
Population: 2,704
Population density:
| Lincoln Highlands: | 6,489 people per square mile |
| Oakland: | 7,739 people per square mile |
Median household income in 2021:
| Lincoln Highlands: | $143,213 |
| Oakland: | $82,236 |
Median rent in in 2021:
| Lincoln Highlands: | $2,461 |
| Oakland: | $1,617 |
Male vs Females
| Males: | 1,450 |
| Females: | 1,254 |
Median age
| Males: | 44.1 years |
| Females: | 49.7 years |
Housing prices:
Average estimated value of detached houses in 2021 (91.9% of all units):
| Lincoln Highlands: | $915,318 |
| Oakland: | $883,784 |
Average estimated value of townhouses or other attached units in 2021 (8.1% of all units):
| This neighborhood: | $665,882 |
| city: | $744,263 |
Most popular occupations of males: management occupations (except farmers) (24.7%); arts, design, entertainment, sports, and media occupations (14.6%); service occupations (12.8%); education, training, and library occupations (8.9%); computer and mathematical occupations (8.5%); architecture and engineering occupations (7.0%); legal occupations (4.9%)
Most popular occupations of females: management occupations (except farmers) (27.4%); sales and office occupations (12.1%); service occupations (10.6%); life, physical, and social science occupations (8.1%); business and financial operations occupations (7.9%); healthcare practitioners and technical occupations (7.9%); arts, design, entertainment, sports, and media occupations (5.3%)
Roads and streets: Frye St; Coolidge Ave; Monterey Blvd; Maple Ave; Alida St; Laguna Ave; Rettig Ave; Rhoda Ave; Carlsen St; Morgan Ave; Wilshire Blvd; Maiden Ln; Jordan Rd; London Rd; Barner Ave; Wisconsin St; Charleston St; Sylvan Ave; Laurel Ave; Kitchener Ct; Sylhowe Rd; Camellia Pl; Lincoln Ave; Steinmetz Way; Coolidge Ter; Carmel St; Rettig Pl; Jordon Rd; Linnet Ave; Alida Ct; Barner Pl.
Lincoln Highlands neighborhood detailed profile
Lockwood Tevis neighborhood in Oakland statistics: (Find on map)
Area: 0.238 square miles
Population: 3,585
Population density:
Median household income in 2021:
Median rent in in 2021:
Male vs Females
Median age
Most popular occupations of males: construction, extraction, and maintenance occupations (24.5%); service occupations (19.2%); material moving occupations (14.2%); sales and office occupations (12.0%); transportation occupations (5.0%); community and social services occupations (4.6%); management occupations (except farmers) (3.7%)
Most popular occupations of females: sales and office occupations (34.1%); service occupations (32.4%); education, training, and library occupations (12.0%); material moving occupations (12.0%); management occupations (except farmers) (3.5%); transportation occupations (2.0%); healthcare practitioners and technical occupations (1.2%)
Roads and streets: 66th Ave; Eastlawn St; Seminary Ave; 58th Ave; 60th Ave; 61st Ave; 62nd Ave; Fenham St; Tevis St; San Leandro; 65th Ave; 64th Ave; 58th; Maldon St; 66th.
Railroad features: Union Pacific RR.
Lockwood Tevis neighborhood detailed profile
Area: 0.238 square miles
Population: 3,585
Population density:
| Lockwood Tevis: | 15,052 people per square mile |
| Oakland: | 7,739 people per square mile |
Median household income in 2021:
| Lockwood Tevis: | $42,103 |
| Oakland: | $82,236 |
Median rent in in 2021:
| Lockwood Tevis: | $657 |
| Oakland: | $1,617 |
Male vs Females
| Males: | 1,666 |
| Females: | 1,918 |
Median age
| Males: | 27.0 years |
| Females: | 31.5 years |
Most popular occupations of males: construction, extraction, and maintenance occupations (24.5%); service occupations (19.2%); material moving occupations (14.2%); sales and office occupations (12.0%); transportation occupations (5.0%); community and social services occupations (4.6%); management occupations (except farmers) (3.7%)
Most popular occupations of females: sales and office occupations (34.1%); service occupations (32.4%); education, training, and library occupations (12.0%); material moving occupations (12.0%); management occupations (except farmers) (3.5%); transportation occupations (2.0%); healthcare practitioners and technical occupations (1.2%)
Roads and streets: 66th Ave; Eastlawn St; Seminary Ave; 58th Ave; 60th Ave; 61st Ave; 62nd Ave; Fenham St; Tevis St; San Leandro; 65th Ave; 64th Ave; 58th; Maldon St; 66th.
Railroad features: Union Pacific RR.
Lockwood Tevis neighborhood detailed profile
Loft District neighborhood in Oakland statistics: (Find on map)
Area: 0.063 square miles
Roads and streets: 4th St; Jackson St; 5th St; Madison St; Oak St; Fallon St; 2nd St.
Railroad features: Union Pacific RR.
Loft District neighborhood detailed profile
Area: 0.063 square miles
Roads and streets: 4th St; Jackson St; 5th St; Madison St; Oak St; Fallon St; 2nd St.
Railroad features: Union Pacific RR.
Loft District neighborhood detailed profile
MacArthur Maze neighborhood in Oakland statistics: (Find on map)
Area: 2.313 square miles
Population: 3,869
Population density:
Median household income in 2021:
Median rent in in 2021:
Male vs Females
Median age
Housing prices:
Average estimated value of detached houses in 2021 (26.0% of all units):
Average estimated value of townhouses or other attached units in 2021 (13.2% of all units):
Average estimated value of housing units in 2-unit structures in 2021 (17.3% of all units):
Average estimated '21 value of housing units in 5-or-more-unit structures (21.6% of all units):
Most popular occupations of males: sales and office occupations (15.2%); management occupations (except farmers) (14.8%); service occupations (10.5%); transportation occupations (10.2%); arts, design, entertainment, sports, and media occupations (9.2%); computer and mathematical occupations (7.0%); construction, extraction, and maintenance occupations (6.8%)
Most popular occupations of females: service occupations (21.3%); management occupations (except farmers) (18.7%); sales and office occupations (14.2%); computer and mathematical occupations (7.6%); arts, design, entertainment, sports, and media occupations (7.5%); education, training, and library occupations (7.4%); healthcare practitioners and technical occupations (7.2%)
Limited-access highways (interstate or state) in this neighborhood: I- 80; I- 580.
Highways in this neighborhood: State Hwy 123 (San Pablo Ave).
Roads and streets: Peralta St; Mandela Pkwy (Cypress St); Burma Rd; W Grand Ave; I- 880; Wood St; Yerba Buena Ave; 40th St; Shellmound St; Wake Ave; Park Ave; Campbell St; Hollis St; 34th St; Adeline St; 32nd St; Engineer Rd; Willow St; Warehouse Rd; Maritime St; 26th St; 20th St; 21st St; Algiers St; 19th St; W Grand; 45th St; Tulagi St; 24th St; Ettie St; Poplar St; Hannah St; Corregidor Ave; Tobruk St; Horton St; Helen St; Africa St; Peralta; Bataan Ave; Poplar; 41st St; Halleck St; Emery St; 28th St; Louise St; (Interstate 580); Kirkham St; Alaska St; Haven St; Union St; Beach St; 17th St; 18th St; (San Pablo); Hubbard St; Holden St; Urkraine St; 40th; Buna St; I- 580 Rmp (W Macarthur Blvd); Bay St; Sherwin Ave (Sherwin St); Harlan St; 16th St; Watts St; Interstate 880 N; Attu St; Macarthur Blvd; Covent Ln; 26th; Magnolia St; W Macarthur; 36th St; Hollis; Moss Ln; 30th St; Fitzgerald St; Apgar St; Ambler Ln; Interstate 880 S; Linden St; Foot of Wood (Wood St); Ealing Ln; Adeline; Baku St; I- 80 E; Surryhne St; 35th St.
Railroad features: Union Pacific RR.
Other features: Temescal Crk.
MacArthur Maze neighborhood detailed profile
Area: 2.313 square miles
Population: 3,869
Population density:
| MacArthur Maze (The Maze): | 1,673 people per square mile |
| Oakland: | 7,739 people per square mile |
Median household income in 2021:
| MacArthur Maze (The Maze): | $106,484 |
| Oakland: | $82,236 |
Median rent in in 2021:
| MacArthur Maze (The Maze): | $1,699 |
| Oakland: | $1,617 |
Male vs Females
| Males: | 2,194 |
| Females: | 1,674 |
Median age
| Males: | 34.7 years |
| Females: | 34.8 years |
Housing prices:
Average estimated value of detached houses in 2021 (26.0% of all units):
| MacArthur Maze (The Maze): | $836,668 |
| Oakland: | $883,784 |
Average estimated value of townhouses or other attached units in 2021 (13.2% of all units):
| This neighborhood: | $696,809 |
| city: | $744,263 |
Average estimated value of housing units in 2-unit structures in 2021 (17.3% of all units):
| This neighborhood: | $1,047,917 |
| Oakland: | $732,452 |
Average estimated '21 value of housing units in 5-or-more-unit structures (21.6% of all units):
| MacArthur Maze (The Maze): | $1,458,540 |
| Oakland: | $622,418 |
Most popular occupations of males: sales and office occupations (15.2%); management occupations (except farmers) (14.8%); service occupations (10.5%); transportation occupations (10.2%); arts, design, entertainment, sports, and media occupations (9.2%); computer and mathematical occupations (7.0%); construction, extraction, and maintenance occupations (6.8%)
Most popular occupations of females: service occupations (21.3%); management occupations (except farmers) (18.7%); sales and office occupations (14.2%); computer and mathematical occupations (7.6%); arts, design, entertainment, sports, and media occupations (7.5%); education, training, and library occupations (7.4%); healthcare practitioners and technical occupations (7.2%)
Limited-access highways (interstate or state) in this neighborhood: I- 80; I- 580.
Highways in this neighborhood: State Hwy 123 (San Pablo Ave).
Roads and streets: Peralta St; Mandela Pkwy (Cypress St); Burma Rd; W Grand Ave; I- 880; Wood St; Yerba Buena Ave; 40th St; Shellmound St; Wake Ave; Park Ave; Campbell St; Hollis St; 34th St; Adeline St; 32nd St; Engineer Rd; Willow St; Warehouse Rd; Maritime St; 26th St; 20th St; 21st St; Algiers St; 19th St; W Grand; 45th St; Tulagi St; 24th St; Ettie St; Poplar St; Hannah St; Corregidor Ave; Tobruk St; Horton St; Helen St; Africa St; Peralta; Bataan Ave; Poplar; 41st St; Halleck St; Emery St; 28th St; Louise St; (Interstate 580); Kirkham St; Alaska St; Haven St; Union St; Beach St; 17th St; 18th St; (San Pablo); Hubbard St; Holden St; Urkraine St; 40th; Buna St; I- 580 Rmp (W Macarthur Blvd); Bay St; Sherwin Ave (Sherwin St); Harlan St; 16th St; Watts St; Interstate 880 N; Attu St; Macarthur Blvd; Covent Ln; 26th; Magnolia St; W Macarthur; 36th St; Hollis; Moss Ln; 30th St; Fitzgerald St; Apgar St; Ambler Ln; Interstate 880 S; Linden St; Foot of Wood (Wood St); Ealing Ln; Adeline; Baku St; I- 80 E; Surryhne St; 35th St.
Railroad features: Union Pacific RR.
Other features: Temescal Crk.
MacArthur Maze neighborhood detailed profile
Maxwell Park neighborhood in Oakland statistics: (Find on map)
Area: 0.528 square miles
Population: 7,124
Population density:
Median household income in 2021:
Median rent in in 2021:
Male vs Females
Median age
Average estimated value of detached houses in 2021 (89.0% of all units):
Most popular occupations of males: sales and office occupations (21.2%); service occupations (11.9%); construction, extraction, and maintenance occupations (10.9%); management occupations (except farmers) (10.8%); arts, design, entertainment, sports, and media occupations (10.2%); education, training, and library occupations (8.3%); legal occupations (5.2%)
Most popular occupations of females: sales and office occupations (31.5%); education, training, and library occupations (14.4%); healthcare practitioners and technical occupations (11.0%); service occupations (10.6%); management occupations (except farmers) (6.0%); community and social services occupations (5.8%); business and financial operations occupations (5.5%)
Roads and streets: Kingsland Ave; Morcom Ave; Fleming Ave; Birdsall Ave; Madera Ave; Rawson St; 55th Ave; Maxwell Ave; Brookdale Ave; Camden St; Monticello Ave; Best Ave; Macarthur Blvd; Redding St; Walnut St; Courtland Ave; Wyman St; Virginia Ave; Pierson St; Modesto Ave; Knowland Ave; Hillen Dr; Trask St; Simmons St; Allendale Ave; el Camile Ave (el Camille Ave); Meldon Ave; Storer Ave; Yuba Ave; Penniman Ave; Ruth Ave; Brann St; Normandie Ave; Millsview Ave; Fairbairn Ave; Herriott Ave; Roberts Ave; Mavis St; Lilac St; Cole St; Macarthur; Interstate 580 E; Renwick St; Wyman Pl; Morcom Pl; Kingsland Pl; Redding Pl.
Maxwell Park neighborhood detailed profile
Area: 0.528 square miles
Population: 7,124
Population density:
| Maxwell Park: | 13,499 people per square mile |
| Oakland: | 7,739 people per square mile |
Median household income in 2021:
| Maxwell Park: | $94,951 |
| Oakland: | $82,236 |
Median rent in in 2021:
| Maxwell Park: | $2,230 |
| Oakland: | $1,617 |
Male vs Females
| Males: | 3,041 |
| Females: | 4,083 |
Median age
| Males: | 35.1 years |
| Females: | 40.9 years |
Average estimated value of detached houses in 2021 (89.0% of all units):
| Maxwell Park: | $702,222 |
| Oakland: | $883,784 |
Most popular occupations of males: sales and office occupations (21.2%); service occupations (11.9%); construction, extraction, and maintenance occupations (10.9%); management occupations (except farmers) (10.8%); arts, design, entertainment, sports, and media occupations (10.2%); education, training, and library occupations (8.3%); legal occupations (5.2%)
Most popular occupations of females: sales and office occupations (31.5%); education, training, and library occupations (14.4%); healthcare practitioners and technical occupations (11.0%); service occupations (10.6%); management occupations (except farmers) (6.0%); community and social services occupations (5.8%); business and financial operations occupations (5.5%)
Roads and streets: Kingsland Ave; Morcom Ave; Fleming Ave; Birdsall Ave; Madera Ave; Rawson St; 55th Ave; Maxwell Ave; Brookdale Ave; Camden St; Monticello Ave; Best Ave; Macarthur Blvd; Redding St; Walnut St; Courtland Ave; Wyman St; Virginia Ave; Pierson St; Modesto Ave; Knowland Ave; Hillen Dr; Trask St; Simmons St; Allendale Ave; el Camile Ave (el Camille Ave); Meldon Ave; Storer Ave; Yuba Ave; Penniman Ave; Ruth Ave; Brann St; Normandie Ave; Millsview Ave; Fairbairn Ave; Herriott Ave; Roberts Ave; Mavis St; Lilac St; Cole St; Macarthur; Interstate 580 E; Renwick St; Wyman Pl; Morcom Pl; Kingsland Pl; Redding Pl.
Maxwell Park neighborhood detailed profile
Mcclymonds neighborhood in Oakland statistics: (Find on map)
Area: 0.308 square miles
Population: 3,198
Population density:
Median household income in 2021:
Median rent in in 2021:
Male vs Females
Median age
Housing prices:
Average estimated value of detached houses in 2021 (27.7% of all units):
Average estimated value of townhouses or other attached units in 2021 (14.2% of all units):
Average estimated value of housing units in 2-unit structures in 2021 (11.6% of all units):
Average estimated '21 value of housing units in 5-or-more-unit structures (12.3% of all units):
Most popular occupations of males: sales and office occupations (17.7%); construction, extraction, and maintenance occupations (14.3%); service occupations (12.8%); arts, design, entertainment, sports, and media occupations (10.3%); computer and mathematical occupations (9.0%); management occupations (except farmers) (7.9%); material moving occupations (6.4%)
Most popular occupations of females: service occupations (28.3%); sales and office occupations (18.7%); management occupations (except farmers) (14.4%); business and financial operations occupations (9.1%); education, training, and library occupations (7.7%); arts, design, entertainment, sports, and media occupations (7.2%); community and social services occupations (4.5%)
Roads and streets: 24th St; 26th St; 28th St; 30th St; Filbert St; Magnolia St; Adeline St; Union St; Myrtle St; Adeline; Chestnut St; Poplar St; Market St; Linden St; Poplar; Peralta St; Peralta; Kirkham St; Market; Bay Pl (27th St); 23rd St; West St; Alicia St; Chestnut Ct (Chestnut St).
Mcclymonds neighborhood detailed profile
Area: 0.308 square miles
Population: 3,198
Population density:
| Mcclymonds: | 10,393 people per square mile |
| Oakland: | 7,739 people per square mile |
Median household income in 2021:
| Mcclymonds: | $100,484 |
| Oakland: | $82,236 |
Median rent in in 2021:
| Mcclymonds: | $1,768 |
| Oakland: | $1,617 |
Male vs Females
| Males: | 1,704 |
| Females: | 1,494 |
Median age
| Males: | 33.5 years |
| Females: | 36.1 years |
Housing prices:
Average estimated value of detached houses in 2021 (27.7% of all units):
| Mcclymonds: | $785,462 |
| Oakland: | $883,784 |
Average estimated value of townhouses or other attached units in 2021 (14.2% of all units):
| This neighborhood: | $553,707 |
| city: | $744,263 |
Average estimated value of housing units in 2-unit structures in 2021 (11.6% of all units):
| This neighborhood: | $837,148 |
| Oakland: | $732,452 |
Average estimated '21 value of housing units in 5-or-more-unit structures (12.3% of all units):
| Mcclymonds: | $273,385 |
| Oakland: | $622,418 |
Most popular occupations of males: sales and office occupations (17.7%); construction, extraction, and maintenance occupations (14.3%); service occupations (12.8%); arts, design, entertainment, sports, and media occupations (10.3%); computer and mathematical occupations (9.0%); management occupations (except farmers) (7.9%); material moving occupations (6.4%)
Most popular occupations of females: service occupations (28.3%); sales and office occupations (18.7%); management occupations (except farmers) (14.4%); business and financial operations occupations (9.1%); education, training, and library occupations (7.7%); arts, design, entertainment, sports, and media occupations (7.2%); community and social services occupations (4.5%)
Roads and streets: 24th St; 26th St; 28th St; 30th St; Filbert St; Magnolia St; Adeline St; Union St; Myrtle St; Adeline; Chestnut St; Poplar St; Market St; Linden St; Poplar; Peralta St; Peralta; Kirkham St; Market; Bay Pl (27th St); 23rd St; West St; Alicia St; Chestnut Ct (Chestnut St).
Mcclymonds neighborhood detailed profile
Meadow Brook neighborhood in Oakland statistics: (Find on map)
Area: 0.310 square miles
Population: 6,468
Population density:
Median household income in 2021:
Median rent in in 2021:
Male vs Females
Median age
Average estimated value of detached houses in 2021 (46.6% of all units):
Most popular occupations of males: sales and office occupations (18.6%); service occupations (17.9%); material moving occupations (12.1%); transportation occupations (11.1%); construction, extraction, and maintenance occupations (9.8%); life, physical, and social science occupations (9.4%); production occupations (5.5%)
Most popular occupations of females: service occupations (38.8%); sales and office occupations (21.5%); education, training, and library occupations (9.3%); production occupations (4.7%); management occupations (except farmers) (4.1%); community and social services occupations (3.7%); material moving occupations (3.3%)
Roads and streets: 25th Ave; 24th Ave; 26th Ave; Inyo Ave; Grande Vista Ave; E 23rd St; E 22nd St; E 20th St; E 21st St; Sheffield Ave; Foothill Blvd; E 27th St; E 24th St; 27th Ave; Mitchell St; E 29th St; E 26th St; Irving Ave (Irving St); E 28th St; Grande Vista Pl; Inyo Path.
Meadow Brook neighborhood detailed profile
Area: 0.310 square miles
Population: 6,468
Population density:
| Meadow Brook (Reservoir Hill): | 20,882 people per square mile |
| Oakland: | 7,739 people per square mile |
Median household income in 2021:
| Meadow Brook (Reservoir Hill): | $55,955 |
| Oakland: | $82,236 |
Median rent in in 2021:
| Meadow Brook (Reservoir Hill): | $1,315 |
| Oakland: | $1,617 |
Male vs Females
| Males: | 3,114 |
| Females: | 3,354 |
Median age
| Males: | 33.9 years |
| Females: | 36.5 years |
Average estimated value of detached houses in 2021 (46.6% of all units):
| Meadow Brook (Reservoir Hill): | $526,741 |
| Oakland: | $883,784 |
Most popular occupations of males: sales and office occupations (18.6%); service occupations (17.9%); material moving occupations (12.1%); transportation occupations (11.1%); construction, extraction, and maintenance occupations (9.8%); life, physical, and social science occupations (9.4%); production occupations (5.5%)
Most popular occupations of females: service occupations (38.8%); sales and office occupations (21.5%); education, training, and library occupations (9.3%); production occupations (4.7%); management occupations (except farmers) (4.1%); community and social services occupations (3.7%); material moving occupations (3.3%)
Roads and streets: 25th Ave; 24th Ave; 26th Ave; Inyo Ave; Grande Vista Ave; E 23rd St; E 22nd St; E 20th St; E 21st St; Sheffield Ave; Foothill Blvd; E 27th St; E 24th St; 27th Ave; Mitchell St; E 29th St; E 26th St; Irving Ave (Irving St); E 28th St; Grande Vista Pl; Inyo Path.
Meadow Brook neighborhood detailed profile
Melrose neighborhood in Oakland statistics: (Find on map)
Area: 0.162 square miles
Population: 401
Population density:
Median household income in 2021:
Median rent in in 2021:
Male vs Females
Median age
Average estimated value of detached houses in 2021 (53.3% of all units):
Most popular occupations of males: construction, extraction, and maintenance occupations (25.6%); service occupations (19.4%); business and financial operations occupations (7.1%); sales and office occupations (6.2%); transportation occupations (4.9%); material moving occupations (4.9%); management occupations (except farmers) (4.8%)
Most popular occupations of females: sales and office occupations (30.8%); service occupations (21.5%); business and financial operations occupations (9.7%); production occupations (8.0%); healthcare practitioners and technical occupations (7.4%); education, training, and library occupations (6.1%); material moving occupations (5.9%)
Roads and streets: E 12th St; San Leandro St; San Leandro; E 10th St; 46th Ave; 45th Ave; 44th Ave; 54th Ave; 50th Ave; 52nd Ave; 51st Ave; 47th Ave; 49th Ave; 53rd Ave; International Blvd.
Railroad features: Union Pacific RR.
Melrose neighborhood detailed profile
Area: 0.162 square miles
Population: 401
Population density:
| Melrose: | 2,478 people per square mile |
| Oakland: | 7,739 people per square mile |
Median household income in 2021:
| Melrose: | $67,193 |
| Oakland: | $82,236 |
Median rent in in 2021:
| Melrose: | $1,790 |
| Oakland: | $1,617 |
Male vs Females
| Males: | 209 |
| Females: | 192 |
Median age
| Males: | 31.2 years |
| Females: | 34.4 years |
Average estimated value of detached houses in 2021 (53.3% of all units):
| Melrose: | $416,885 |
| Oakland: | $883,784 |
Most popular occupations of males: construction, extraction, and maintenance occupations (25.6%); service occupations (19.4%); business and financial operations occupations (7.1%); sales and office occupations (6.2%); transportation occupations (4.9%); material moving occupations (4.9%); management occupations (except farmers) (4.8%)
Most popular occupations of females: sales and office occupations (30.8%); service occupations (21.5%); business and financial operations occupations (9.7%); production occupations (8.0%); healthcare practitioners and technical occupations (7.4%); education, training, and library occupations (6.1%); material moving occupations (5.9%)
Roads and streets: E 12th St; San Leandro St; San Leandro; E 10th St; 46th Ave; 45th Ave; 44th Ave; 54th Ave; 50th Ave; 52nd Ave; 51st Ave; 47th Ave; 49th Ave; 53rd Ave; International Blvd.
Railroad features: Union Pacific RR.
Melrose neighborhood detailed profile
Merritt neighborhood in Oakland statistics: (Find on map)
Area: 0.136 square miles
Population: 1,142
Population density:
Median household income in 2021:
Median rent in in 2021:
Male vs Females
Median age
Most popular occupations of males: transportation occupations (15.1%); service occupations (14.0%); sales and office occupations (13.9%); arts, design, entertainment, sports, and media occupations (13.1%); management occupations (except farmers) (11.9%); construction, extraction, and maintenance occupations (11.6%); computer and mathematical occupations (11.2%)
Most popular occupations of females: life, physical, and social science occupations (22.6%); sales and office occupations (20.9%); service occupations (13.7%); education, training, and library occupations (10.8%); management occupations (except farmers) (9.2%); healthcare practitioners and technical occupations (6.1%); arts, design, entertainment, sports, and media occupations (5.5%)
Roads and streets: E 12th St; 1st Ave; 2nd Ave; 4th Ave; 3rd Ave; Lakeshore Ave; E 15th St; E 18th St; International Blvd; E 14th St (International Blvd); E 11th St; Foothill Blvd; E 10th St; E 12th; 1st Av Pl; E 17th St; E 16th St; 3rd; 2nd.
Merritt neighborhood detailed profile
Area: 0.136 square miles
Population: 1,142
Population density:
| Merritt: | 8,377 people per square mile |
| Oakland: | 7,739 people per square mile |
Median household income in 2021:
| Merritt: | $39,019 |
| Oakland: | $82,236 |
Median rent in in 2021:
| Merritt: | $496 |
| Oakland: | $1,617 |
Male vs Females
| Males: | 450 |
| Females: | 692 |
Median age
| Males: | 52.9 years |
| Females: | 52.0 years |
Most popular occupations of males: transportation occupations (15.1%); service occupations (14.0%); sales and office occupations (13.9%); arts, design, entertainment, sports, and media occupations (13.1%); management occupations (except farmers) (11.9%); construction, extraction, and maintenance occupations (11.6%); computer and mathematical occupations (11.2%)
Most popular occupations of females: life, physical, and social science occupations (22.6%); sales and office occupations (20.9%); service occupations (13.7%); education, training, and library occupations (10.8%); management occupations (except farmers) (9.2%); healthcare practitioners and technical occupations (6.1%); arts, design, entertainment, sports, and media occupations (5.5%)
Roads and streets: E 12th St; 1st Ave; 2nd Ave; 4th Ave; 3rd Ave; Lakeshore Ave; E 15th St; E 18th St; International Blvd; E 14th St (International Blvd); E 11th St; Foothill Blvd; E 10th St; E 12th; 1st Av Pl; E 17th St; E 16th St; 3rd; 2nd.
Merritt neighborhood detailed profile
Merriwood neighborhood in Oakland statistics: (Find on map)
Area: 0.638 square miles
Population: 3,012
Population density:
Median household income in 2021:
Median rent in in 2021:
Male vs Females
Median age
Average estimated value of detached houses in 2021 (97.0% of all units):
Most popular occupations of males: sales and office occupations (21.4%); management occupations (except farmers) (15.7%); service occupations (11.3%); computer and mathematical occupations (10.1%); education, training, and library occupations (7.1%); business and financial operations occupations (6.9%); architecture and engineering occupations (6.9%)
Most popular occupations of females: sales and office occupations (16.6%); management occupations (except farmers) (15.0%); healthcare practitioners and technical occupations (13.6%); education, training, and library occupations (9.1%); legal occupations (8.7%); life, physical, and social science occupations (8.1%); community and social services occupations (6.2%)
Roads and streets: Thornhill Dr; Merriewood Dr; Valley View Rd; Pinehaven Rd; Broadway Ter; Aspinwall Rd; Gouldin Rd; Woodhaven Way; Virgo Rd; Crown Ave; Oakwood Dr; Indian Way; Grisborne Ave; Beauforest Dr; Nottingham Dr; Farallon Way; Uranus Ave; Merriewood Cir; Doyle St (Pinehaven Rd); Sherwood Dr; Doncaster Pl; Robin Hood Way; Abbott Dr; The Turn; Vista del Mar Ct; Westwood Ct; Overlake Ct; Taurus Ave; Marden Ln; Thornhill Ct; Westwood Way; Alhambra Ln; Mountain Blvd; Abbott; Warren Fwy.
Merriwood neighborhood detailed profile
Area: 0.638 square miles
Population: 3,012
Population density:
| Merriwood: | 4,719 people per square mile |
| Oakland: | 7,739 people per square mile |
Median household income in 2021:
| Merriwood: | $208,289 |
| Oakland: | $82,236 |
Median rent in in 2021:
| Merriwood: | $3,070 |
| Oakland: | $1,617 |
Male vs Females
| Males: | 1,529 |
| Females: | 1,482 |
Median age
| Males: | 44.5 years |
| Females: | 46.6 years |
Average estimated value of detached houses in 2021 (97.0% of all units):
| Merriwood: | $1,229,285 |
| Oakland: | $883,784 |
Most popular occupations of males: sales and office occupations (21.4%); management occupations (except farmers) (15.7%); service occupations (11.3%); computer and mathematical occupations (10.1%); education, training, and library occupations (7.1%); business and financial operations occupations (6.9%); architecture and engineering occupations (6.9%)
Most popular occupations of females: sales and office occupations (16.6%); management occupations (except farmers) (15.0%); healthcare practitioners and technical occupations (13.6%); education, training, and library occupations (9.1%); legal occupations (8.7%); life, physical, and social science occupations (8.1%); community and social services occupations (6.2%)
Roads and streets: Thornhill Dr; Merriewood Dr; Valley View Rd; Pinehaven Rd; Broadway Ter; Aspinwall Rd; Gouldin Rd; Woodhaven Way; Virgo Rd; Crown Ave; Oakwood Dr; Indian Way; Grisborne Ave; Beauforest Dr; Nottingham Dr; Farallon Way; Uranus Ave; Merriewood Cir; Doyle St (Pinehaven Rd); Sherwood Dr; Doncaster Pl; Robin Hood Way; Abbott Dr; The Turn; Vista del Mar Ct; Westwood Ct; Overlake Ct; Taurus Ave; Marden Ln; Thornhill Ct; Westwood Way; Alhambra Ln; Mountain Blvd; Abbott; Warren Fwy.
Merriwood neighborhood detailed profile
Mills College neighborhood in Oakland statistics: (Find on map)
Area: 0.272 square miles
Population: 1,210
Population density:
Median household income in 2021:
Median rent in in 2021:
Male vs Females
Median age
Average estimated value of detached houses in 2021 (67.4% of all units):
Most popular occupations of males: management occupations (except farmers) (29.8%); service occupations (15.6%); construction, extraction, and maintenance occupations (11.5%); sales and office occupations (7.9%); production occupations (5.8%); computer and mathematical occupations (5.2%); education, training, and library occupations (5.1%)
Most popular occupations of females: education, training, and library occupations (22.3%); production occupations (18.0%); management occupations (except farmers) (14.8%); sales and office occupations (10.9%); service occupations (7.3%); arts, design, entertainment, sports, and media occupations (7.2%); business and financial operations occupations (6.1%)
Roads and streets: Seminary Ave; Seminary; Kaplolani Rd; Richards Rd; Richards; Post Rd; Underwood Ave; Wetmore; Macarthur Blvd; Orchard Meadow Rd; Faculty Village Rd; Top; Underwood.
Mills College neighborhood detailed profile
Area: 0.272 square miles
Population: 1,210
Population density:
| Mills College: | 4,454 people per square mile |
| Oakland: | 7,739 people per square mile |
Median household income in 2021:
| Mills College: | $83,841 |
| Oakland: | $82,236 |
Median rent in in 2021:
| Mills College: | $1,519 |
| Oakland: | $1,617 |
Male vs Females
| Males: | 583 |
| Females: | 626 |
Median age
| Males: | 39.3 years |
| Females: | 43.2 years |
Average estimated value of detached houses in 2021 (67.4% of all units):
| Mills College: | $640,423 |
| Oakland: | $883,784 |
Most popular occupations of males: management occupations (except farmers) (29.8%); service occupations (15.6%); construction, extraction, and maintenance occupations (11.5%); sales and office occupations (7.9%); production occupations (5.8%); computer and mathematical occupations (5.2%); education, training, and library occupations (5.1%)
Most popular occupations of females: education, training, and library occupations (22.3%); production occupations (18.0%); management occupations (except farmers) (14.8%); sales and office occupations (10.9%); service occupations (7.3%); arts, design, entertainment, sports, and media occupations (7.2%); business and financial operations occupations (6.1%)
Roads and streets: Seminary Ave; Seminary; Kaplolani Rd; Richards Rd; Richards; Post Rd; Underwood Ave; Wetmore; Macarthur Blvd; Orchard Meadow Rd; Faculty Village Rd; Top; Underwood.
Mills College neighborhood detailed profile
Millsmont neighborhood in Oakland statistics: (Find on map)
Area: 0.453 square miles
Population: 7,117
Population density:
Median household income in 2021:
Median rent in in 2021:
Male vs Females
Median age
Average estimated value of detached houses in 2021 (60.9% of all units):
Most popular occupations of males: management occupations (except farmers) (20.6%); service occupations (13.3%); sales and office occupations (11.2%); production occupations (10.6%); transportation occupations (9.0%); construction, extraction, and maintenance occupations (8.7%); business and financial operations occupations (8.0%)
Most popular occupations of females: sales and office occupations (27.5%); education, training, and library occupations (12.8%); management occupations (except farmers) (10.6%); service occupations (9.5%); business and financial operations occupations (8.3%); architecture and engineering occupations (6.8%); community and social services occupations (6.1%)
Limited-access highways (interstate or state) in this neighborhood: I- 580.
Roads and streets: Outlook Ave; Macarthur Blvd; Delmont Ave; Sunnymere Ave; Hillmont Dr; Macarthur; Simson St; Buena Ventura Ave; Mokelumne Ave; Altamont Ave; Majestic Ave; 64th Ave; Oakdale Ave; 62nd Ave; Edwards Ave; 66th Ave; 65th Ave; Burckhalter Ave; 68th Ave; Edgemoor Pl; 73rd; 73rd Ave; Interstate 580 E; Monadnock Way; 72nd Ave; 69th Ave; Laird Ave; Lundholm Ave; Lacey Ave; 64th Avenue Pl; Bantry Ave; Sunkist Dr; Gardenia Pl; Edenvale Pl; Van Mourik Ave; Archmont Pl; Ney Ave; Edwards; 61st Ave; Nairobi Pl; Hillmont.
Millsmont neighborhood detailed profile
Area: 0.453 square miles
Population: 7,117
Population density:
| Millsmont: | 15,717 people per square mile |
| Oakland: | 7,739 people per square mile |
Median household income in 2021:
| Millsmont: | $86,950 |
| Oakland: | $82,236 |
Median rent in in 2021:
| Millsmont: | $1,596 |
| Oakland: | $1,617 |
Male vs Females
| Males: | 3,684 |
| Females: | 3,433 |
Median age
| Males: | 39.4 years |
| Females: | 42.5 years |
Average estimated value of detached houses in 2021 (60.9% of all units):
| Millsmont: | $599,264 |
| Oakland: | $883,784 |
Most popular occupations of males: management occupations (except farmers) (20.6%); service occupations (13.3%); sales and office occupations (11.2%); production occupations (10.6%); transportation occupations (9.0%); construction, extraction, and maintenance occupations (8.7%); business and financial operations occupations (8.0%)
Most popular occupations of females: sales and office occupations (27.5%); education, training, and library occupations (12.8%); management occupations (except farmers) (10.6%); service occupations (9.5%); business and financial operations occupations (8.3%); architecture and engineering occupations (6.8%); community and social services occupations (6.1%)
Limited-access highways (interstate or state) in this neighborhood: I- 580.
Roads and streets: Outlook Ave; Macarthur Blvd; Delmont Ave; Sunnymere Ave; Hillmont Dr; Macarthur; Simson St; Buena Ventura Ave; Mokelumne Ave; Altamont Ave; Majestic Ave; 64th Ave; Oakdale Ave; 62nd Ave; Edwards Ave; 66th Ave; 65th Ave; Burckhalter Ave; 68th Ave; Edgemoor Pl; 73rd; 73rd Ave; Interstate 580 E; Monadnock Way; 72nd Ave; 69th Ave; Laird Ave; Lundholm Ave; Lacey Ave; 64th Avenue Pl; Bantry Ave; Sunkist Dr; Gardenia Pl; Edenvale Pl; Van Mourik Ave; Archmont Pl; Ney Ave; Edwards; 61st Ave; Nairobi Pl; Hillmont.
Millsmont neighborhood detailed profile
Montclair neighborhood in Oakland statistics: (Find on map)
Area: 0.892 square miles
Population: 4,338
Population density:
Median household income in 2021:
Median rent in in 2021:
Male vs Females
Median age
Average estimated value of detached houses in 2021 (90.0% of all units):
Most popular occupations of males: management occupations (except farmers) (19.9%); business and financial operations occupations (16.3%); sales and office occupations (15.1%); computer and mathematical occupations (13.1%); arts, design, entertainment, sports, and media occupations (7.1%); service occupations (4.8%); healthcare practitioners and technical occupations (4.4%)
Most popular occupations of females: sales and office occupations (22.1%); management occupations (except farmers) (20.7%); healthcare practitioners and technical occupations (11.8%); business and financial operations occupations (10.5%); service occupations (7.1%); legal occupations (6.2%); production occupations (4.7%)
Limited-access highways (interstate or state) in this neighborhood: State Hwy 13 (Warren Fwy).
Roads and streets: Colton Blvd; Lasalle Ave (Estates Dr); Snake Rd; Saroni Dr; Harbord Dr; la Salle Ave; Wood Dr; Pershing Dr; Trafalgar Pl; Hubbard St (Drake Dr); Magellan Dr; Bullard Dr; Cabot Dr; Heartwood Dr; Johnston Dr; Moraga Ave; Mazuela Dr; Liggett Dr; McAndrew Dr; Chambers Dr; Sims Dr; Hemlock St; Balboa Dr; Chambers Ln; Gaspar Dr; Mendoza Dr; Zinn Dr; Somerset Dr (Somerset Rd); Blair Ave; Asilomar Dr; Armour Dr; Rincon Dr; Marr Ave; Ridgewood Dr; Hemlock Ln; Bruns Ct; Cortereal Ave; Asilomar Cir; Lodge Ct; Wild Currant Way; Lane Ct; Dawes St; Mountain Blvd; Wood Ct; Alhambra Ave; Almaden Ln; Krohn Ln; Ridgewood Way; Morningstar Cir; Marsh Pl; Colton Pl; Cabrillo Pl; Drake Pl; Alhambra Ln; Diaz Pl; Homewood Dr; Thornhill Dr; Moyer Pl.
Montclair neighborhood detailed profile
Area: 0.892 square miles
Population: 4,338
Population density:
| Montclair: | 4,866 people per square mile |
| Oakland: | 7,739 people per square mile |
Median household income in 2021:
| Montclair: | $208,841 |
| Oakland: | $82,236 |
Median rent in in 2021:
| Montclair: | $2,459 |
| Oakland: | $1,617 |
Male vs Females
| Males: | 2,080 |
| Females: | 2,258 |
Median age
| Males: | 46.7 years |
| Females: | 45.6 years |
Average estimated value of detached houses in 2021 (90.0% of all units):
| Montclair: | $1,296,978 |
| Oakland: | $883,784 |
Most popular occupations of males: management occupations (except farmers) (19.9%); business and financial operations occupations (16.3%); sales and office occupations (15.1%); computer and mathematical occupations (13.1%); arts, design, entertainment, sports, and media occupations (7.1%); service occupations (4.8%); healthcare practitioners and technical occupations (4.4%)
Most popular occupations of females: sales and office occupations (22.1%); management occupations (except farmers) (20.7%); healthcare practitioners and technical occupations (11.8%); business and financial operations occupations (10.5%); service occupations (7.1%); legal occupations (6.2%); production occupations (4.7%)
Limited-access highways (interstate or state) in this neighborhood: State Hwy 13 (Warren Fwy).
Roads and streets: Colton Blvd; Lasalle Ave (Estates Dr); Snake Rd; Saroni Dr; Harbord Dr; la Salle Ave; Wood Dr; Pershing Dr; Trafalgar Pl; Hubbard St (Drake Dr); Magellan Dr; Bullard Dr; Cabot Dr; Heartwood Dr; Johnston Dr; Moraga Ave; Mazuela Dr; Liggett Dr; McAndrew Dr; Chambers Dr; Sims Dr; Hemlock St; Balboa Dr; Chambers Ln; Gaspar Dr; Mendoza Dr; Zinn Dr; Somerset Dr (Somerset Rd); Blair Ave; Asilomar Dr; Armour Dr; Rincon Dr; Marr Ave; Ridgewood Dr; Hemlock Ln; Bruns Ct; Cortereal Ave; Asilomar Cir; Lodge Ct; Wild Currant Way; Lane Ct; Dawes St; Mountain Blvd; Wood Ct; Alhambra Ave; Almaden Ln; Krohn Ln; Ridgewood Way; Morningstar Cir; Marsh Pl; Colton Pl; Cabrillo Pl; Drake Pl; Alhambra Ln; Diaz Pl; Homewood Dr; Thornhill Dr; Moyer Pl.
Montclair neighborhood detailed profile
Montclair Business neighborhood in Oakland statistics: (Find on map)
Area: 0.053 square miles
Population: 197
Population density:
Median household income in 2021:
Median rent in in 2021:
Male vs Females
Median age
Most popular occupations of males: sales and office occupations (36.8%); management occupations (except farmers) (23.6%); business and financial operations occupations (9.2%); computer and mathematical occupations (6.5%); healthcare practitioners and technical occupations (5.8%); construction, extraction, and maintenance occupations (5.3%); architecture and engineering occupations (5.2%)
Most popular occupations of females: management occupations (except farmers) (27.0%); sales and office occupations (20.8%); service occupations (11.9%); business and financial operations occupations (10.2%); arts, design, entertainment, sports, and media occupations (9.8%); legal occupations (9.1%); healthcare practitioners and technical occupations (6.6%)
Roads and streets: Moraga Ave; Mountain Blvd; la Salle Ave; Antioch Ct (Antioch St); Medau Pl; Lucas Ave; Merced Ave.
Montclair Business neighborhood detailed profile
Area: 0.053 square miles
Population: 197
Population density:
| Montclair Business: | 3,748 people per square mile |
| Oakland: | 7,739 people per square mile |
Median household income in 2021:
| Montclair Business: | $210,431 |
| Oakland: | $82,236 |
Median rent in in 2021:
| Montclair Business: | $2,261 |
| Oakland: | $1,617 |
Male vs Females
| Males: | 93 |
| Females: | 104 |
Median age
| Males: | 46.7 years |
| Females: | 48.7 years |
Most popular occupations of males: sales and office occupations (36.8%); management occupations (except farmers) (23.6%); business and financial operations occupations (9.2%); computer and mathematical occupations (6.5%); healthcare practitioners and technical occupations (5.8%); construction, extraction, and maintenance occupations (5.3%); architecture and engineering occupations (5.2%)
Most popular occupations of females: management occupations (except farmers) (27.0%); sales and office occupations (20.8%); service occupations (11.9%); business and financial operations occupations (10.2%); arts, design, entertainment, sports, and media occupations (9.8%); legal occupations (9.1%); healthcare practitioners and technical occupations (6.6%)
Roads and streets: Moraga Ave; Mountain Blvd; la Salle Ave; Antioch Ct (Antioch St); Medau Pl; Lucas Ave; Merced Ave.
Montclair Business neighborhood detailed profile
Mosswood neighborhood in Oakland statistics: (Find on map)
Area: 0.207 square miles
Population: 2,914
Population density:
Median household income in 2021:
Median rent in in 2021:
Male vs Females
Median age
Housing prices:
Average estimated value of detached houses in 2021 (32.6% of all units):
Average estimated value of townhouses or other attached units in 2021 (6.5% of all units):
Average estimated value of housing units in 2-unit structures in 2021 (6.3% of all units):
Average estimated '21 value of housing units in 3-to-4-unit structures (17.3% of all units):
Average estimated '21 value of housing units in 5-or-more-unit structures (13.7% of all units):
Most popular occupations of males: service occupations (20.0%); management occupations (except farmers) (18.8%); computer and mathematical occupations (12.7%); arts, design, entertainment, sports, and media occupations (9.6%); education, training, and library occupations (9.2%); sales and office occupations (5.5%); construction, extraction, and maintenance occupations (4.0%)
Most popular occupations of females: sales and office occupations (22.3%); management occupations (except farmers) (13.2%); service occupations (12.6%); computer and mathematical occupations (7.5%); community and social services occupations (7.0%); business and financial operations occupations (6.3%); healthcare practitioners and technical occupations (5.9%)
Limited-access highways (interstate or state) in this neighborhood: State Hwy 24 (Grove Shafter Fwy).
Roads and streets: 40th St; W Macarthur Blvd (Macarthur Blvd); 38th St; W Macarthur; 37th St; Webster St; Telegraph; Telegraph Ave; Ruby St; 40th; 36th St; Manila Ave; Shafter Ave; Clarke St; Opal St; Latimer Pl; Apgar St; 39th St.
Railroad features: Bay Area Rapid Transit RR.
Mosswood neighborhood detailed profile
Area: 0.207 square miles
Population: 2,914
Population density:
| Mosswood: | 14,087 people per square mile |
| Oakland: | 7,739 people per square mile |
Median household income in 2021:
| Mosswood: | $104,683 |
| Oakland: | $82,236 |
Median rent in in 2021:
| Mosswood: | $1,674 |
| Oakland: | $1,617 |
Male vs Females
| Males: | 1,509 |
| Females: | 1,404 |
Median age
| Males: | 34.6 years |
| Females: | 34.2 years |
Housing prices:
Average estimated value of detached houses in 2021 (32.6% of all units):
| Mosswood: | $842,471 |
| Oakland: | $883,784 |
Average estimated value of townhouses or other attached units in 2021 (6.5% of all units):
| This neighborhood: | $1,125,781 |
| city: | $744,263 |
Average estimated value of housing units in 2-unit structures in 2021 (6.3% of all units):
| This neighborhood: | $575,000 |
| Oakland: | $732,452 |
Average estimated '21 value of housing units in 3-to-4-unit structures (17.3% of all units):
| Mosswood: | $461,200 |
| city: | $699,145 |
Average estimated '21 value of housing units in 5-or-more-unit structures (13.7% of all units):
| Mosswood: | $304,588 |
| Oakland: | $622,418 |
Most popular occupations of males: service occupations (20.0%); management occupations (except farmers) (18.8%); computer and mathematical occupations (12.7%); arts, design, entertainment, sports, and media occupations (9.6%); education, training, and library occupations (9.2%); sales and office occupations (5.5%); construction, extraction, and maintenance occupations (4.0%)
Most popular occupations of females: sales and office occupations (22.3%); management occupations (except farmers) (13.2%); service occupations (12.6%); computer and mathematical occupations (7.5%); community and social services occupations (7.0%); business and financial operations occupations (6.3%); healthcare practitioners and technical occupations (5.9%)
Limited-access highways (interstate or state) in this neighborhood: State Hwy 24 (Grove Shafter Fwy).
Roads and streets: 40th St; W Macarthur Blvd (Macarthur Blvd); 38th St; W Macarthur; 37th St; Webster St; Telegraph; Telegraph Ave; Ruby St; 40th; 36th St; Manila Ave; Shafter Ave; Clarke St; Opal St; Latimer Pl; Apgar St; 39th St.
Railroad features: Bay Area Rapid Transit RR.
Mosswood neighborhood detailed profile
North Kennedy Tract neighborhood in Oakland statistics: (Find on map)
Area: 0.188 square miles
Population: 1,627
Population density:
Median household income in 2021:
Median rent in in 2021:
Male vs Females
Median age
Housing prices:
Average estimated value of detached houses in 2021 (17.1% of all units):
Average estimated value of townhouses or other attached units in 2021 (26.7% of all units):
Most popular occupations of males: construction, extraction, and maintenance occupations (39.7%); service occupations (23.0%); sales and office occupations (13.7%); computer and mathematical occupations (7.4%); management occupations (except farmers) (4.2%); business and financial operations occupations (1.9%); community and social services occupations (1.7%)
Most popular occupations of females: service occupations (33.0%); sales and office occupations (23.3%); business and financial operations occupations (14.4%); production occupations (6.5%); healthcare practitioners and technical occupations (6.3%); management occupations (except farmers) (4.7%); education, training, and library occupations (4.0%)
Limited-access highways (interstate or state) in this neighborhood: State Hwy 17 (Nimitz Fwy, I- 880).
Roads and streets: E 9th St; E 10th St; 23rd Ave; E 11th St; 29th Ave; 29th; 27th Ave; Interstate 880 N; 29th Ave Ovp; Fruitvale Ave; Lisbon Ave (28th Ave); 23rd Ave Ovp; 25th Ave; Fruitvale; Portwood Ave; 26th Ave; E 8th St; Miller Ave; Derby Ave; Miller Pl.
Railroad features: Union Pacific RR; Bay Area Rapid Transit RR.
North Kennedy Tract neighborhood detailed profile
Area: 0.188 square miles
Population: 1,627
Population density:
| North Kennedy Tract: | 8,646 people per square mile |
| Oakland: | 7,739 people per square mile |
Median household income in 2021:
| North Kennedy Tract: | $70,379 |
| Oakland: | $82,236 |
Median rent in in 2021:
| North Kennedy Tract: | $1,260 |
| Oakland: | $1,617 |
Male vs Females
| Males: | 977 |
| Females: | 650 |
Median age
| Males: | 38.3 years |
| Females: | 37.5 years |
Housing prices:
Average estimated value of detached houses in 2021 (17.1% of all units):
| North Kennedy Tract: | $658,373 |
| Oakland: | $883,784 |
Average estimated value of townhouses or other attached units in 2021 (26.7% of all units):
| This neighborhood: | $619,408 |
| city: | $744,263 |
Most popular occupations of males: construction, extraction, and maintenance occupations (39.7%); service occupations (23.0%); sales and office occupations (13.7%); computer and mathematical occupations (7.4%); management occupations (except farmers) (4.2%); business and financial operations occupations (1.9%); community and social services occupations (1.7%)
Most popular occupations of females: service occupations (33.0%); sales and office occupations (23.3%); business and financial operations occupations (14.4%); production occupations (6.5%); healthcare practitioners and technical occupations (6.3%); management occupations (except farmers) (4.7%); education, training, and library occupations (4.0%)
Limited-access highways (interstate or state) in this neighborhood: State Hwy 17 (Nimitz Fwy, I- 880).
Roads and streets: E 9th St; E 10th St; 23rd Ave; E 11th St; 29th Ave; 29th; 27th Ave; Interstate 880 N; 29th Ave Ovp; Fruitvale Ave; Lisbon Ave (28th Ave); 23rd Ave Ovp; 25th Ave; Fruitvale; Portwood Ave; 26th Ave; E 8th St; Miller Ave; Derby Ave; Miller Pl.
Railroad features: Union Pacific RR; Bay Area Rapid Transit RR.
North Kennedy Tract neighborhood detailed profile
North Stonehurst neighborhood in Oakland statistics: (Find on map)
Area: 0.309 square miles
Population: 4,487
Population density:
Median household income in 2021:
Median rent in in 2021:
Male vs Females
Median age
Housing prices:
Average estimated value of detached houses in 2021 (63.5% of all units):
Average estimated value of townhouses or other attached units in 2021 (16.6% of all units):
Most popular occupations of males: construction, extraction, and maintenance occupations (18.9%); service occupations (17.0%); sales and office occupations (13.6%); production occupations (11.2%); transportation occupations (10.5%); architecture and engineering occupations (4.8%); farming, fishing, and forestry occupations (4.5%)
Most popular occupations of females: service occupations (43.2%); sales and office occupations (21.5%); education, training, and library occupations (12.2%); healthcare practitioners and technical occupations (6.1%); production occupations (4.1%); transportation occupations (3.5%); material moving occupations (2.6%)
Roads and streets: San Leandro St; 107th Ave; 105th Ave; 106th Ave; 104th Ave; E St; Bristol Blvd; 102nd Ave; 100th Ave; 103rd Ave; 105th; Apricot St; Graffian St; 101st Ave; Royal Ann St; Town Square Pl; C St; Pontiac St; Russet; San Leandro; 99th Ave; A St; Blenheim St; Royal St; Russet St; Moorpark St; 99th Avenue Ct; International Blvd; Manuel Ct.
Railroad features: Bay Area Rapid Transit RR; Union Pacific RR.
North Stonehurst neighborhood detailed profile
Area: 0.309 square miles
Population: 4,487
Population density:
| North Stonehurst: | 14,503 people per square mile |
| Oakland: | 7,739 people per square mile |
Median household income in 2021:
| North Stonehurst: | $89,017 |
| Oakland: | $82,236 |
Median rent in in 2021:
| North Stonehurst: | $1,424 |
| Oakland: | $1,617 |
Male vs Females
| Males: | 2,105 |
| Females: | 2,382 |
Median age
| Males: | 40.3 years |
| Females: | 40.8 years |
Housing prices:
Average estimated value of detached houses in 2021 (63.5% of all units):
| North Stonehurst: | $497,624 |
| Oakland: | $883,784 |
Average estimated value of townhouses or other attached units in 2021 (16.6% of all units):
| This neighborhood: | $1,829,649 |
| city: | $744,263 |
Most popular occupations of males: construction, extraction, and maintenance occupations (18.9%); service occupations (17.0%); sales and office occupations (13.6%); production occupations (11.2%); transportation occupations (10.5%); architecture and engineering occupations (4.8%); farming, fishing, and forestry occupations (4.5%)
Most popular occupations of females: service occupations (43.2%); sales and office occupations (21.5%); education, training, and library occupations (12.2%); healthcare practitioners and technical occupations (6.1%); production occupations (4.1%); transportation occupations (3.5%); material moving occupations (2.6%)
Roads and streets: San Leandro St; 107th Ave; 105th Ave; 106th Ave; 104th Ave; E St; Bristol Blvd; 102nd Ave; 100th Ave; 103rd Ave; 105th; Apricot St; Graffian St; 101st Ave; Royal Ann St; Town Square Pl; C St; Pontiac St; Russet; San Leandro; 99th Ave; A St; Blenheim St; Royal St; Russet St; Moorpark St; 99th Avenue Ct; International Blvd; Manuel Ct.
Railroad features: Bay Area Rapid Transit RR; Union Pacific RR.
North Stonehurst neighborhood detailed profile
Northgate neighborhood in Oakland statistics: (Find on map)
Area: 0.148 square miles
Population: 2,518
Population density:
Median household income in 2021:
Median rent in in 2021:
Male vs Females
Median age
Most popular occupations of males: computer and mathematical occupations (16.4%); sales and office occupations (14.8%); management occupations (except farmers) (13.4%); construction, extraction, and maintenance occupations (10.6%); service occupations (10.2%); life, physical, and social science occupations (4.7%); community and social services occupations (4.7%)
Most popular occupations of females: management occupations (except farmers) (18.3%); sales and office occupations (14.9%); service occupations (11.8%); business and financial operations occupations (11.0%); education, training, and library occupations (10.2%); healthcare practitioners and technical occupations (8.8%); arts, design, entertainment, sports, and media occupations (8.4%)
Limited-access highways (interstate or state) in this neighborhood: I- 980 (Grove Shafter Fwy).
Roads and streets: Broadway; 23rd St; Bay Pl (27th St); 25th St; 24th St; Telegraph Ave; Northgate Ave; 26th St; Sycamore St; Valley St; Telegraph; Northgate; Martin Luther King Jr Way; 20th; 27th; 22nd St; W Grand Ave; Martin Luther King Jr; Interstate 980 E.
Railroad features: Bay Area Rapid Transit RR.
Northgate neighborhood detailed profile
Area: 0.148 square miles
Population: 2,518
Population density:
| Northgate: | 17,038 people per square mile |
| Oakland: | 7,739 people per square mile |
Median household income in 2021:
| Northgate: | $56,803 |
| Oakland: | $82,236 |
Median rent in in 2021:
| Northgate: | $1,584 |
| Oakland: | $1,617 |
Male vs Females
| Males: | 1,285 |
| Females: | 1,233 |
Median age
| Males: | 41.7 years |
| Females: | 34.8 years |
Most popular occupations of males: computer and mathematical occupations (16.4%); sales and office occupations (14.8%); management occupations (except farmers) (13.4%); construction, extraction, and maintenance occupations (10.6%); service occupations (10.2%); life, physical, and social science occupations (4.7%); community and social services occupations (4.7%)
Most popular occupations of females: management occupations (except farmers) (18.3%); sales and office occupations (14.9%); service occupations (11.8%); business and financial operations occupations (11.0%); education, training, and library occupations (10.2%); healthcare practitioners and technical occupations (8.8%); arts, design, entertainment, sports, and media occupations (8.4%)
Limited-access highways (interstate or state) in this neighborhood: I- 980 (Grove Shafter Fwy).
Roads and streets: Broadway; 23rd St; Bay Pl (27th St); 25th St; 24th St; Telegraph Ave; Northgate Ave; 26th St; Sycamore St; Valley St; Telegraph; Northgate; Martin Luther King Jr Way; 20th; 27th; 22nd St; W Grand Ave; Martin Luther King Jr; Interstate 980 E.
Railroad features: Bay Area Rapid Transit RR.
Northgate neighborhood detailed profile
Oak Center neighborhood in Oakland statistics: (Find on map)
Area: 0.304 square miles
Population: 6,724
Population density:
Median household income in 2021:
Median rent in in 2021:
Male vs Females
Median age
Average estimated value of detached houses in 2021 (19.2% of all units):
Most popular occupations of males: service occupations (19.1%); management occupations (except farmers) (14.1%); transportation occupations (12.0%); sales and office occupations (10.8%); computer and mathematical occupations (6.0%); arts, design, entertainment, sports, and media occupations (4.7%); farming, fishing, and forestry occupations (4.2%)
Most popular occupations of females: service occupations (26.5%); sales and office occupations (17.8%); management occupations (except farmers) (14.3%); education, training, and library occupations (12.8%); business and financial operations occupations (7.5%); healthcare practitioners and technical occupations (3.8%); community and social services occupations (3.4%)
Roads and streets: 12th St; 16th St; 14th St; 14th; 18th St; 16th; 18th; 12th; Market St; Brush St; Mandela Pkwy (Cypress St); Poplar St; Adeline; Adeline St; West St; Magnolia St; Union St; Linden St; Chestnut St; Filbert St; Myrtle St; 15th St; 17th St; 13th St; Kirkham Ct (Kirkham St); Kirkham St; Market; Kirkham.
Oak Center neighborhood detailed profile
Area: 0.304 square miles
Population: 6,724
Population density:
| Oak Center: | 22,085 people per square mile |
| Oakland: | 7,739 people per square mile |
Median household income in 2021:
| Oak Center: | $66,601 |
| Oakland: | $82,236 |
Median rent in in 2021:
| Oak Center: | $1,227 |
| Oakland: | $1,617 |
Male vs Females
| Males: | 2,911 |
| Females: | 3,813 |
Median age
| Males: | 33.0 years |
| Females: | 37.4 years |
Average estimated value of detached houses in 2021 (19.2% of all units):
| Oak Center: | $748,929 |
| Oakland: | $883,784 |
Most popular occupations of males: service occupations (19.1%); management occupations (except farmers) (14.1%); transportation occupations (12.0%); sales and office occupations (10.8%); computer and mathematical occupations (6.0%); arts, design, entertainment, sports, and media occupations (4.7%); farming, fishing, and forestry occupations (4.2%)
Most popular occupations of females: service occupations (26.5%); sales and office occupations (17.8%); management occupations (except farmers) (14.3%); education, training, and library occupations (12.8%); business and financial operations occupations (7.5%); healthcare practitioners and technical occupations (3.8%); community and social services occupations (3.4%)
Roads and streets: 12th St; 16th St; 14th St; 14th; 18th St; 16th; 18th; 12th; Market St; Brush St; Mandela Pkwy (Cypress St); Poplar St; Adeline; Adeline St; West St; Magnolia St; Union St; Linden St; Chestnut St; Filbert St; Myrtle St; 15th St; 17th St; 13th St; Kirkham Ct (Kirkham St); Kirkham St; Market; Kirkham.
Oak Center neighborhood detailed profile
Oak Tree neighborhood in Oakland statistics: (Find on map)
Area: 0.105 square miles
Population: 3,492
Population density:
Median household income in 2021:
Median rent in in 2021:
Male vs Females
Median age
Most popular occupations of males: service occupations (31.0%); construction, extraction, and maintenance occupations (12.1%); management occupations (except farmers) (11.8%); material moving occupations (10.9%); transportation occupations (8.4%); production occupations (6.6%); sales and office occupations (4.9%)
Most popular occupations of females: service occupations (29.0%); sales and office occupations (26.0%); education, training, and library occupations (8.3%); material moving occupations (5.4%); healthcare practitioners and technical occupations (4.8%); transportation occupations (4.7%); production occupations (4.4%)
Roads and streets: E 16th St; Foothill; 27th Ave; E 15th St; 25th Ave; 26th Ave; 24th Ave; Miller Ave; 28th Ave; E 17th St; Foothill Blvd.
Oak Tree neighborhood detailed profile
Area: 0.105 square miles
Population: 3,492
Population density:
| Oak Tree: | 33,158 people per square mile |
| Oakland: | 7,739 people per square mile |
Median household income in 2021:
| Oak Tree: | $45,705 |
| Oakland: | $82,236 |
Median rent in in 2021:
| Oak Tree: | $1,188 |
| Oakland: | $1,617 |
Male vs Females
| Males: | 1,948 |
| Females: | 1,544 |
Median age
| Males: | 28.8 years |
| Females: | 36.4 years |
Most popular occupations of males: service occupations (31.0%); construction, extraction, and maintenance occupations (12.1%); management occupations (except farmers) (11.8%); material moving occupations (10.9%); transportation occupations (8.4%); production occupations (6.6%); sales and office occupations (4.9%)
Most popular occupations of females: service occupations (29.0%); sales and office occupations (26.0%); education, training, and library occupations (8.3%); material moving occupations (5.4%); healthcare practitioners and technical occupations (4.8%); transportation occupations (4.7%); production occupations (4.4%)
Roads and streets: E 16th St; Foothill; 27th Ave; E 15th St; 25th Ave; 26th Ave; 24th Ave; Miller Ave; 28th Ave; E 17th St; Foothill Blvd.
Oak Tree neighborhood detailed profile
Oakmore neighborhood in Oakland statistics: (Find on map)
Area: 0.655 square miles
Population: 4,062
Population density:
Median household income in 2021:
Median rent in in 2021:
Male vs Females
Median age
Average estimated value of detached houses in 2021 (75.4% of all units):
Most popular occupations of males: management occupations (except farmers) (22.3%); business and financial operations occupations (10.3%); architecture and engineering occupations (9.4%); sales and office occupations (8.8%); computer and mathematical occupations (7.5%); education, training, and library occupations (6.7%); healthcare practitioners and technical occupations (6.7%)
Most popular occupations of females: sales and office occupations (18.6%); management occupations (except farmers) (13.0%); business and financial operations occupations (10.9%); education, training, and library occupations (9.8%); service occupations (9.5%); life, physical, and social science occupations (9.2%); arts, design, entertainment, sports, and media occupations (7.5%)
Roads and streets: Leimert Blvd; Warren Fwy; Monterey Blvd; Fruitvale Ave; Park Blvd; Whittle Ave; Melvin Rd; Lyman Rd; Clemens Rd; Bywood Dr; Tiffin Rd; Lincoln Ave; Oakmore Rd; Waterhouse Rd; Braemar Rd; Hoover Ave; Bridgeview Dr; Wrenn St; Arcadia Ave; Harding Way; Lincoln Way; Rosecrest Dr; Carter St; Oakview Dr; Brentwood Rd; Oakcrest Dr; Casterline Rd; Hanly Rd; Funston Pl; Arden Pl; Melvin Ct; Wilbur St; Edge Dr; Leimert Pl; Arden Way; Oakmore Pl; Brentwood Pl.
Other features: Sausal Crk.
Oakmore neighborhood detailed profile
Area: 0.655 square miles
Population: 4,062
Population density:
| Oakmore: | 6,203 people per square mile |
| Oakland: | 7,739 people per square mile |
Median household income in 2021:
| Oakmore: | $176,051 |
| Oakland: | $82,236 |
Median rent in in 2021:
| Oakmore: | $2,069 |
| Oakland: | $1,617 |
Male vs Females
| Males: | 1,987 |
| Females: | 2,074 |
Median age
| Males: | 43.9 years |
| Females: | 48.3 years |
Average estimated value of detached houses in 2021 (75.4% of all units):
| Oakmore: | $1,120,831 |
| Oakland: | $883,784 |
Most popular occupations of males: management occupations (except farmers) (22.3%); business and financial operations occupations (10.3%); architecture and engineering occupations (9.4%); sales and office occupations (8.8%); computer and mathematical occupations (7.5%); education, training, and library occupations (6.7%); healthcare practitioners and technical occupations (6.7%)
Most popular occupations of females: sales and office occupations (18.6%); management occupations (except farmers) (13.0%); business and financial operations occupations (10.9%); education, training, and library occupations (9.8%); service occupations (9.5%); life, physical, and social science occupations (9.2%); arts, design, entertainment, sports, and media occupations (7.5%)
Roads and streets: Leimert Blvd; Warren Fwy; Monterey Blvd; Fruitvale Ave; Park Blvd; Whittle Ave; Melvin Rd; Lyman Rd; Clemens Rd; Bywood Dr; Tiffin Rd; Lincoln Ave; Oakmore Rd; Waterhouse Rd; Braemar Rd; Hoover Ave; Bridgeview Dr; Wrenn St; Arcadia Ave; Harding Way; Lincoln Way; Rosecrest Dr; Carter St; Oakview Dr; Brentwood Rd; Oakcrest Dr; Casterline Rd; Hanly Rd; Funston Pl; Arden Pl; Melvin Ct; Wilbur St; Edge Dr; Leimert Pl; Arden Way; Oakmore Pl; Brentwood Pl.
Other features: Sausal Crk.
Oakmore neighborhood detailed profile
Old City neighborhood in Oakland statistics: (Find on map)
Area: 0.365 square miles
Population: 4,340
Population density:
Median household income in 2021:
Median rent in in 2021:
Male vs Females
Median age
Most popular occupations of males: sales and office occupations (19.9%); business and financial operations occupations (19.5%); management occupations (except farmers) (14.1%); computer and mathematical occupations (10.7%); service occupations (10.4%); transportation occupations (8.2%); healthcare practitioners and technical occupations (3.2%)
Most popular occupations of females: sales and office occupations (23.1%); service occupations (16.2%); business and financial operations occupations (15.4%); healthcare practitioners and technical occupations (14.4%); management occupations (except farmers) (7.6%); education, training, and library occupations (7.5%); legal occupations (5.0%)
Limited-access highways (interstate or state) in this neighborhood: I- 880 (State Hwy 17, Nimitz Fwy); I- 980 (Grove Shafter Fwy); Webster St Tube (Webster St, State Hwy 61).
Roads and streets: 4th St; 3rd St; 5th St; 2nd St; Embarcadero W (1st St); Castro St; Broadway; Washington St; Jefferson St; 6th St; Martin Luther King Jr Way; 8th St; Jack London Sq (Water St); 7th St; Clay St; 10th St; 6th; 9th St; Franklin St; Interstate 880 N; Posey Tube (State Rte 260, Harrison St); Brush St; Market St; Grove St (Martin Luther King Jr Way); Harrison St; Market; 11th St; 14th; 14th St; 12th St; Embarcadero (Grove St, Martin Luther King Jr Way); 5th; Interstate 980 E; 13th St (Preservation Park Way); Franklin; Webster Pl; Webster St; 7th.
Railroad features: Union Pacific RR; Bay Area Rapid Transit RR.
Old City neighborhood detailed profile
Area: 0.365 square miles
Population: 4,340
Population density:
| Old City: | 11,878 people per square mile |
| Oakland: | 7,739 people per square mile |
Median household income in 2021:
| Old City: | $55,864 |
| Oakland: | $82,236 |
Median rent in in 2021:
| Old City: | $1,803 |
| Oakland: | $1,617 |
Male vs Females
| Males: | 2,157 |
| Females: | 2,183 |
Median age
| Males: | 42.3 years |
| Females: | 45.7 years |
Most popular occupations of males: sales and office occupations (19.9%); business and financial operations occupations (19.5%); management occupations (except farmers) (14.1%); computer and mathematical occupations (10.7%); service occupations (10.4%); transportation occupations (8.2%); healthcare practitioners and technical occupations (3.2%)
Most popular occupations of females: sales and office occupations (23.1%); service occupations (16.2%); business and financial operations occupations (15.4%); healthcare practitioners and technical occupations (14.4%); management occupations (except farmers) (7.6%); education, training, and library occupations (7.5%); legal occupations (5.0%)
Limited-access highways (interstate or state) in this neighborhood: I- 880 (State Hwy 17, Nimitz Fwy); I- 980 (Grove Shafter Fwy); Webster St Tube (Webster St, State Hwy 61).
Roads and streets: 4th St; 3rd St; 5th St; 2nd St; Embarcadero W (1st St); Castro St; Broadway; Washington St; Jefferson St; 6th St; Martin Luther King Jr Way; 8th St; Jack London Sq (Water St); 7th St; Clay St; 10th St; 6th; 9th St; Franklin St; Interstate 880 N; Posey Tube (State Rte 260, Harrison St); Brush St; Market St; Grove St (Martin Luther King Jr Way); Harrison St; Market; 11th St; 14th; 14th St; 12th St; Embarcadero (Grove St, Martin Luther King Jr Way); 5th; Interstate 980 E; 13th St (Preservation Park Way); Franklin; Webster Pl; Webster St; 7th.
Railroad features: Union Pacific RR; Bay Area Rapid Transit RR.
Old City neighborhood detailed profile
Old Oakland neighborhood in Oakland statistics: (Find on map)
Area: 0.031 square miles
Population: 243
Population density:
Median household income in 2021:
Median rent in in 2021:
Male vs Females
Median age
Most popular occupations of males: business and financial operations occupations (30.4%); sales and office occupations (24.3%); management occupations (except farmers) (16.2%); computer and mathematical occupations (13.3%); arts, design, entertainment, sports, and media occupations (7.8%); service occupations (5.3%); healthcare practitioners and technical occupations (3.2%)
Most popular occupations of females: sales and office occupations (23.4%); business and financial operations occupations (21.9%); healthcare practitioners and technical occupations (15.7%); education, training, and library occupations (12.8%); service occupations (5.4%); legal occupations (4.5%); management occupations (except farmers) (4.2%)
Roads and streets: Broadway; 10th St; 9th St; Washington St; 8th St; Clay St; 7th St.
Old Oakland neighborhood detailed profile
Area: 0.031 square miles
Population: 243
Population density:
| Old Oakland: | 7,760 people per square mile |
| Oakland: | 7,739 people per square mile |
Median household income in 2021:
| Old Oakland: | $92,884 |
| Oakland: | $82,236 |
Median rent in in 2021:
| Old Oakland: | $2,740 |
| Oakland: | $1,617 |
Male vs Females
| Males: | 136 |
| Females: | 106 |
Median age
| Males: | 42.0 years |
| Females: | 47.4 years |
Most popular occupations of males: business and financial operations occupations (30.4%); sales and office occupations (24.3%); management occupations (except farmers) (16.2%); computer and mathematical occupations (13.3%); arts, design, entertainment, sports, and media occupations (7.8%); service occupations (5.3%); healthcare practitioners and technical occupations (3.2%)
Most popular occupations of females: sales and office occupations (23.4%); business and financial operations occupations (21.9%); healthcare practitioners and technical occupations (15.7%); education, training, and library occupations (12.8%); service occupations (5.4%); legal occupations (4.5%); management occupations (except farmers) (4.2%)
Roads and streets: Broadway; 10th St; 9th St; Washington St; 8th St; Clay St; 7th St.
Old Oakland neighborhood detailed profile
Patten neighborhood in Oakland statistics: (Find on map)
Area: 0.115 square miles
Population: 2,233
Population density:
Median household income in 2021:
Median rent in in 2021:
Male vs Females
Median age
Most popular occupations of males: sales and office occupations (27.3%); construction, extraction, and maintenance occupations (19.3%); service occupations (11.8%); life, physical, and social science occupations (8.0%); transportation occupations (6.0%); material moving occupations (5.8%); healthcare practitioners and technical occupations (3.9%)
Most popular occupations of females: service occupations (40.2%); sales and office occupations (23.3%); education, training, and library occupations (11.6%); management occupations (except farmers) (8.0%); healthcare practitioners and technical occupations (5.0%); business and financial operations occupations (4.1%); production occupations (3.2%)
Roads and streets: Coolidge Ave; Davis St; Lynde St; Sunset Ave; Prentiss St; Bona St; Atwell Ave; Hughes Ave; E 27th St; E 23rd St; E 22nd St; Prentiss Pl; Foothill Blvd; Galindo St.
Patten neighborhood detailed profile
Area: 0.115 square miles
Population: 2,233
Population density:
| Patten: | 19,443 people per square mile |
| Oakland: | 7,739 people per square mile |
Median household income in 2021:
| Patten: | $59,491 |
| Oakland: | $82,236 |
Median rent in in 2021:
| Patten: | $1,344 |
| Oakland: | $1,617 |
Male vs Females
| Males: | 1,034 |
| Females: | 1,198 |
Median age
| Males: | 34.8 years |
| Females: | 39.4 years |
Most popular occupations of males: sales and office occupations (27.3%); construction, extraction, and maintenance occupations (19.3%); service occupations (11.8%); life, physical, and social science occupations (8.0%); transportation occupations (6.0%); material moving occupations (5.8%); healthcare practitioners and technical occupations (3.9%)
Most popular occupations of females: service occupations (40.2%); sales and office occupations (23.3%); education, training, and library occupations (11.6%); management occupations (except farmers) (8.0%); healthcare practitioners and technical occupations (5.0%); business and financial operations occupations (4.1%); production occupations (3.2%)
Roads and streets: Coolidge Ave; Davis St; Lynde St; Sunset Ave; Prentiss St; Bona St; Atwell Ave; Hughes Ave; E 27th St; E 23rd St; E 22nd St; Prentiss Pl; Foothill Blvd; Galindo St.
Patten neighborhood detailed profile
Piedmont Avenue neighborhood in Oakland statistics: (Find on map)
Area: 0.445 square miles
Population: 5,656
Population density:
Median household income in 2021:
Median rent in in 2021:
Male vs Females
Median age
Housing prices:
Average estimated value of detached houses in 2021 (17.5% of all units):
Average estimated value of townhouses or other attached units in 2021 (4.4% of all units):
Average estimated value of housing units in 2-unit structures in 2021 (13.1% of all units):
Average estimated '21 value of housing units in 3-to-4-unit structures (15.5% of all units):
Average estimated '21 value of housing units in 5-or-more-unit structures (4.3% of all units):
Most popular occupations of males: computer and mathematical occupations (20.3%); healthcare practitioners and technical occupations (17.6%); service occupations (10.8%); management occupations (except farmers) (10.2%); business and financial operations occupations (9.5%); arts, design, entertainment, sports, and media occupations (5.2%); sales and office occupations (5.0%)
Most popular occupations of females: management occupations (except farmers) (21.1%); sales and office occupations (18.8%); service occupations (10.6%); business and financial operations occupations (10.3%); education, training, and library occupations (7.5%); community and social services occupations (7.0%); healthcare practitioners and technical occupations (5.8%)
Roads and streets: Broadway; Piedmont Ave; Howe St; Piedmont; Howe; Montgomery St; 41st St; Gilbert St; Mather St; Glen Ave; Ridgeway Ave; W Macarthur Blvd (Macarthur Blvd); Pleasant Valley Ave; Terrace St; Monte Vista Ave; Fairmount Ave; 40th St; John St; W Macarthur; el Dorado Ave; 40th Street Way; Brandon St; Rio Vista Ave; Yosemite Ave; Montell St; Moraga Ave; Whitmore St; Gleneden Ave; Linda Ave; Pleasant Valley; Entrada Ave; Monte Cresta Ave; Moss Way; Ramona Ave; Echo Ave; Pleasant Valley Ct S; Pleasant Valley Ct N; Cerrito Ave; 38th St; 40th; View St; Robley Ter; Arroyuelo Ave; Bayo Vista Ave; Glen; Kelton Ct; Panama Ct; Glenwood Ave; Entranda Ave; Wilda Ave; Ramona; Leighton; Pleasant Valley Ct; Ridgeway; 41st.
Piedmont Avenue neighborhood detailed profile
Area: 0.445 square miles
Population: 5,656
Population density:
| Piedmont Avenue: | 12,707 people per square mile |
| Oakland: | 7,739 people per square mile |
Median household income in 2021:
| Piedmont Avenue: | $117,949 |
| Oakland: | $82,236 |
Median rent in in 2021:
| Piedmont Avenue: | $1,819 |
| Oakland: | $1,617 |
Male vs Females
| Males: | 2,864 |
| Females: | 2,791 |
Median age
| Males: | 38.5 years |
| Females: | 37.6 years |
Housing prices:
Average estimated value of detached houses in 2021 (17.5% of all units):
| Piedmont Avenue: | $4,703,418 |
| Oakland: | $883,784 |
Average estimated value of townhouses or other attached units in 2021 (4.4% of all units):
| This neighborhood: | $442,308 |
| city: | $744,263 |
Average estimated value of housing units in 2-unit structures in 2021 (13.1% of all units):
| This neighborhood: | $552,500 |
| Oakland: | $732,452 |
Average estimated '21 value of housing units in 3-to-4-unit structures (15.5% of all units):
| Piedmont Avenue: | $4,443,839 |
| city: | $699,145 |
Average estimated '21 value of housing units in 5-or-more-unit structures (4.3% of all units):
| Piedmont Avenue: | $551,300 |
| Oakland: | $622,418 |
Most popular occupations of males: computer and mathematical occupations (20.3%); healthcare practitioners and technical occupations (17.6%); service occupations (10.8%); management occupations (except farmers) (10.2%); business and financial operations occupations (9.5%); arts, design, entertainment, sports, and media occupations (5.2%); sales and office occupations (5.0%)
Most popular occupations of females: management occupations (except farmers) (21.1%); sales and office occupations (18.8%); service occupations (10.6%); business and financial operations occupations (10.3%); education, training, and library occupations (7.5%); community and social services occupations (7.0%); healthcare practitioners and technical occupations (5.8%)
Roads and streets: Broadway; Piedmont Ave; Howe St; Piedmont; Howe; Montgomery St; 41st St; Gilbert St; Mather St; Glen Ave; Ridgeway Ave; W Macarthur Blvd (Macarthur Blvd); Pleasant Valley Ave; Terrace St; Monte Vista Ave; Fairmount Ave; 40th St; John St; W Macarthur; el Dorado Ave; 40th Street Way; Brandon St; Rio Vista Ave; Yosemite Ave; Montell St; Moraga Ave; Whitmore St; Gleneden Ave; Linda Ave; Pleasant Valley; Entrada Ave; Monte Cresta Ave; Moss Way; Ramona Ave; Echo Ave; Pleasant Valley Ct S; Pleasant Valley Ct N; Cerrito Ave; 38th St; 40th; View St; Robley Ter; Arroyuelo Ave; Bayo Vista Ave; Glen; Kelton Ct; Panama Ct; Glenwood Ave; Entranda Ave; Wilda Ave; Ramona; Leighton; Pleasant Valley Ct; Ridgeway; 41st.
Piedmont Avenue neighborhood detailed profile
Piedmont Pines neighborhood in Oakland statistics: (Find on map)
Area: 0.985 square miles
Population: 3,411
Population density:
Median household income in 2021:
Median rent in in 2021:
Male vs Females
Median age
Housing prices:
Average estimated value of detached houses in 2021 (89.9% of all units):
Average estimated value of townhouses or other attached units in 2021 (5.8% of all units):
Most popular occupations of males: management occupations (except farmers) (22.2%); arts, design, entertainment, sports, and media occupations (10.9%); sales and office occupations (9.9%); healthcare practitioners and technical occupations (9.2%); business and financial operations occupations (8.7%); architecture and engineering occupations (8.4%); material moving occupations (7.4%)
Most popular occupations of females: management occupations (except farmers) (30.2%); healthcare practitioners and technical occupations (11.6%); business and financial operations occupations (10.8%); computer and mathematical occupations (10.0%); sales and office occupations (8.4%); community and social services occupations (6.3%); education, training, and library occupations (6.1%)
Roads and streets: Ascot Dr; Chelton Dr (Chatsworth Ct); Girvin Dr; Castle Dr; Skyline Blvd; Chelsea Dr; Mountain Blvd; Mastlands Dr; Holyrood Dr; Melville Dr; Carisbrook Dr; Aitken Dr; Westover Dr; Exeter Dr; Longwalk Dr; Longcroft Dr; Larry Ln; Joaquin Miller Rd; Pelham Pl; Bagshotte Dr; Mountaingate Way (Mountain Gate Way); Camelford Pl; Haverhill Dr; Stockbridge Dr; Cam Lenada (Camino Lenada St); Darnby Dr; Clive Ave; Shirley Dr; Thackeray Dr; Wilton Dr; Burton Dr; Castle Park Way; Las Aromas (Las Aromas St); Beaconsfield Pl; el Caminito (el Caminito St); Dublin Ave; Kearney Ave; Werner Ct; Morley Dr; Joaquin Miller Ct; Melville Ln; Elderberry Dr; la Cuesta Ave; Woodminster Ln; Weybridge Ct; Mall Ct; Moraga Ave; Moore Dr; Camelford Ct; Pierpoint Ave; Ascot Ct; Totterdell St; Carisbrook Ln; Rydal Ct; Kimberley Ct; Castle Ln; Holyrood Mnr; el Patio St; Blachford Ct; Keswick Ct; Argyle St; Castle Ct; Pine Hills Dr; Chelsea Ct; Osborne Ct; Waldeck Ct; Cornwall Ct; Ascot Pl; Ascot Ln; Park Blvd.
Roads and streets: Pine Hills Dr; Wilton Dr.
Piedmont Pines neighborhood detailed profile
Area: 0.985 square miles
Population: 3,411
Population density:
| Piedmont Pines: | 3,462 people per square mile |
| Oakland: | 7,739 people per square mile |
Median household income in 2021:
| Piedmont Pines: | $187,099 |
| Oakland: | $82,236 |
Median rent in in 2021:
| Piedmont Pines: | $2,331 |
| Oakland: | $1,617 |
Male vs Females
| Males: | 1,594 |
| Females: | 1,817 |
Median age
| Males: | 48.4 years |
| Females: | 48.7 years |
Housing prices:
Average estimated value of detached houses in 2021 (89.9% of all units):
| Piedmont Pines: | $987,107 |
| Oakland: | $883,784 |
Average estimated value of townhouses or other attached units in 2021 (5.8% of all units):
| This neighborhood: | $665,882 |
| city: | $744,263 |
Most popular occupations of males: management occupations (except farmers) (22.2%); arts, design, entertainment, sports, and media occupations (10.9%); sales and office occupations (9.9%); healthcare practitioners and technical occupations (9.2%); business and financial operations occupations (8.7%); architecture and engineering occupations (8.4%); material moving occupations (7.4%)
Most popular occupations of females: management occupations (except farmers) (30.2%); healthcare practitioners and technical occupations (11.6%); business and financial operations occupations (10.8%); computer and mathematical occupations (10.0%); sales and office occupations (8.4%); community and social services occupations (6.3%); education, training, and library occupations (6.1%)
Roads and streets: Ascot Dr; Chelton Dr (Chatsworth Ct); Girvin Dr; Castle Dr; Skyline Blvd; Chelsea Dr; Mountain Blvd; Mastlands Dr; Holyrood Dr; Melville Dr; Carisbrook Dr; Aitken Dr; Westover Dr; Exeter Dr; Longwalk Dr; Longcroft Dr; Larry Ln; Joaquin Miller Rd; Pelham Pl; Bagshotte Dr; Mountaingate Way (Mountain Gate Way); Camelford Pl; Haverhill Dr; Stockbridge Dr; Cam Lenada (Camino Lenada St); Darnby Dr; Clive Ave; Shirley Dr; Thackeray Dr; Wilton Dr; Burton Dr; Castle Park Way; Las Aromas (Las Aromas St); Beaconsfield Pl; el Caminito (el Caminito St); Dublin Ave; Kearney Ave; Werner Ct; Morley Dr; Joaquin Miller Ct; Melville Ln; Elderberry Dr; la Cuesta Ave; Woodminster Ln; Weybridge Ct; Mall Ct; Moraga Ave; Moore Dr; Camelford Ct; Pierpoint Ave; Ascot Ct; Totterdell St; Carisbrook Ln; Rydal Ct; Kimberley Ct; Castle Ln; Holyrood Mnr; el Patio St; Blachford Ct; Keswick Ct; Argyle St; Castle Ct; Pine Hills Dr; Chelsea Ct; Osborne Ct; Waldeck Ct; Cornwall Ct; Ascot Pl; Ascot Ln; Park Blvd.
Roads and streets: Pine Hills Dr; Wilton Dr.
Piedmont Pines neighborhood detailed profile
Pill Hill neighborhood in Oakland statistics: (Find on map)
Area: 0.223 square miles
Population: 2,225
Population density:
Median household income in 2021:
Median rent in in 2021:
Male vs Females
Median age
Housing prices:
Average estimated value of detached houses in 2021 (10.8% of all units):
Average estimated value of townhouses or other attached units in 2021 (7.1% of all units):
Average estimated value of housing units in 2-unit structures in 2021 (3.4% of all units):
Average estimated '21 value of housing units in 3-to-4-unit structures (16.5% of all units):
Average estimated '21 value of housing units in 5-or-more-unit structures (26.6% of all units):
Most popular occupations of males: management occupations (except farmers) (14.7%); service occupations (13.0%); computer and mathematical occupations (12.8%); sales and office occupations (12.6%); production occupations (8.6%); arts, design, entertainment, sports, and media occupations (7.4%); architecture and engineering occupations (6.1%)
Most popular occupations of females: management occupations (except farmers) (24.7%); sales and office occupations (13.5%); service occupations (12.6%); business and financial operations occupations (11.9%); education, training, and library occupations (9.2%); healthcare practitioners and technical occupations (4.3%); production occupations (4.3%)
Limited-access highways (interstate or state) in this neighborhood: I- 580; I- 980 (Grove Shafter Fwy).
Roads and streets: 34th St; Telegraph Ave; Telegraph; 29th St; Webster St; 30th St; 28th St; Summit St; Hawthorne Ave; 31st St; Northgate; 33rd St; 32nd St; Merrimac St; Elm St; McClure St; Central Ave; Summit; Elm; Andover St.
Railroad features: Bay Area Rapid Transit RR.
Pill Hill neighborhood detailed profile
Area: 0.223 square miles
Population: 2,225
Population density:
| Pill Hill: | 9,971 people per square mile |
| Oakland: | 7,739 people per square mile |
Median household income in 2021:
| Pill Hill: | $91,237 |
| Oakland: | $82,236 |
Median rent in in 2021:
| Pill Hill: | $1,628 |
| Oakland: | $1,617 |
Male vs Females
| Males: | 1,073 |
| Females: | 1,151 |
Median age
| Males: | 37.4 years |
| Females: | 32.8 years |
Housing prices:
Average estimated value of detached houses in 2021 (10.8% of all units):
| Pill Hill: | $821,364 |
| Oakland: | $883,784 |
Average estimated value of townhouses or other attached units in 2021 (7.1% of all units):
| This neighborhood: | $442,308 |
| city: | $744,263 |
Average estimated value of housing units in 2-unit structures in 2021 (3.4% of all units):
| This neighborhood: | $575,000 |
| Oakland: | $732,452 |
Average estimated '21 value of housing units in 3-to-4-unit structures (16.5% of all units):
| Pill Hill: | $461,200 |
| city: | $699,145 |
Average estimated '21 value of housing units in 5-or-more-unit structures (26.6% of all units):
| Pill Hill: | $349,500 |
| Oakland: | $622,418 |
Most popular occupations of males: management occupations (except farmers) (14.7%); service occupations (13.0%); computer and mathematical occupations (12.8%); sales and office occupations (12.6%); production occupations (8.6%); arts, design, entertainment, sports, and media occupations (7.4%); architecture and engineering occupations (6.1%)
Most popular occupations of females: management occupations (except farmers) (24.7%); sales and office occupations (13.5%); service occupations (12.6%); business and financial operations occupations (11.9%); education, training, and library occupations (9.2%); healthcare practitioners and technical occupations (4.3%); production occupations (4.3%)
Limited-access highways (interstate or state) in this neighborhood: I- 580; I- 980 (Grove Shafter Fwy).
Roads and streets: 34th St; Telegraph Ave; Telegraph; 29th St; Webster St; 30th St; 28th St; Summit St; Hawthorne Ave; 31st St; Northgate; 33rd St; 32nd St; Merrimac St; Elm St; McClure St; Central Ave; Summit; Elm; Andover St.
Railroad features: Bay Area Rapid Transit RR.
Pill Hill neighborhood detailed profile
Prescott neighborhood in Oakland statistics: (Find on map)
Area: 2.184 square miles
Population: 4,997
Population density:
Median household income in 2021:
Median rent in in 2021:
Male vs Females
Median age
Housing prices:
Average estimated value of detached houses in 2021 (27.8% of all units):
Average estimated value of townhouses or other attached units in 2021 (10.7% of all units):
Average estimated value of housing units in 2-unit structures in 2021 (24.1% of all units):
Average estimated '21 value of housing units in 5-or-more-unit structures (11.4% of all units):
Most popular occupations of males: sales and office occupations (21.7%); management occupations (except farmers) (15.5%); service occupations (13.1%); education, training, and library occupations (8.0%); computer and mathematical occupations (7.2%); arts, design, entertainment, sports, and media occupations (6.4%); production occupations (5.1%)
Most popular occupations of females: service occupations (26.3%); management occupations (except farmers) (16.9%); sales and office occupations (15.2%); business and financial operations occupations (10.6%); arts, design, entertainment, sports, and media occupations (8.4%); education, training, and library occupations (4.7%); computer and mathematical occupations (4.5%)
Limited-access highways (interstate or state) in this neighborhood: I- 80; I- 880; I- 580.
Roads and streets: Maritime St; 14th St; 8th St; Burma Rd; 12th St; Larson St (10th St); Tulagi St; Mandela Pkwy (Cypress St); Wood St; 11th St (Andrew Way); Campbell St; Peralta St; Army Base; Terminal St; Murmansk St; 17th St; 15th St; Willow St; Wake Ave; W Grand Ave; Engineer Rd; 9th St; 14th; Tobruk St; Peralta; Center St; Warehouse Rd; 13th St; 12th; 16th St; Corregidor Ave; 21st St; Algiers St; 19th St; Pier St; Pine St; 20th St; 18th St; Midway St; Freight St; Petroleum St; Africa St; Ferry; W Grand; Ferry St; Bataan Ave; Cedar St; Chester St; Goss St; Alaska St; 8th; Urkraine St; Chase St; Campbell Village Ct; Buna St; Chungking St; Interstate 880 N; Attu St; 16th; Dolphin St; Motor Pool Way; 18th; Transit St; Interstate 880 S; Maritime; McElroy St; 7th St; Foot of Wood (Wood St); Tobruk; Baku St; Center; I- 80 E; Henry St; Shorey St; Orient St; 17th.
Railroad features: Union Pacific RR.
Prescott neighborhood detailed profile
Area: 2.184 square miles
Population: 4,997
Population density:
| Prescott: | 2,288 people per square mile |
| Oakland: | 7,739 people per square mile |
Median household income in 2021:
| Prescott: | $98,463 |
| Oakland: | $82,236 |
Median rent in in 2021:
| Prescott: | $1,651 |
| Oakland: | $1,617 |
Male vs Females
| Males: | 2,642 |
| Females: | 2,355 |
Median age
| Males: | 33.7 years |
| Females: | 35.3 years |
Housing prices:
Average estimated value of detached houses in 2021 (27.8% of all units):
| Prescott: | $748,929 |
| Oakland: | $883,784 |
Average estimated value of townhouses or other attached units in 2021 (10.7% of all units):
| This neighborhood: | $590,440 |
| city: | $744,263 |
Average estimated value of housing units in 2-unit structures in 2021 (24.1% of all units):
| This neighborhood: | $892,685 |
| Oakland: | $732,452 |
Average estimated '21 value of housing units in 5-or-more-unit structures (11.4% of all units):
| Prescott: | $291,522 |
| Oakland: | $622,418 |
Most popular occupations of males: sales and office occupations (21.7%); management occupations (except farmers) (15.5%); service occupations (13.1%); education, training, and library occupations (8.0%); computer and mathematical occupations (7.2%); arts, design, entertainment, sports, and media occupations (6.4%); production occupations (5.1%)
Most popular occupations of females: service occupations (26.3%); management occupations (except farmers) (16.9%); sales and office occupations (15.2%); business and financial operations occupations (10.6%); arts, design, entertainment, sports, and media occupations (8.4%); education, training, and library occupations (4.7%); computer and mathematical occupations (4.5%)
Limited-access highways (interstate or state) in this neighborhood: I- 80; I- 880; I- 580.
Roads and streets: Maritime St; 14th St; 8th St; Burma Rd; 12th St; Larson St (10th St); Tulagi St; Mandela Pkwy (Cypress St); Wood St; 11th St (Andrew Way); Campbell St; Peralta St; Army Base; Terminal St; Murmansk St; 17th St; 15th St; Willow St; Wake Ave; W Grand Ave; Engineer Rd; 9th St; 14th; Tobruk St; Peralta; Center St; Warehouse Rd; 13th St; 12th; 16th St; Corregidor Ave; 21st St; Algiers St; 19th St; Pier St; Pine St; 20th St; 18th St; Midway St; Freight St; Petroleum St; Africa St; Ferry; W Grand; Ferry St; Bataan Ave; Cedar St; Chester St; Goss St; Alaska St; 8th; Urkraine St; Chase St; Campbell Village Ct; Buna St; Chungking St; Interstate 880 N; Attu St; 16th; Dolphin St; Motor Pool Way; 18th; Transit St; Interstate 880 S; Maritime; McElroy St; 7th St; Foot of Wood (Wood St); Tobruk; Baku St; Center; I- 80 E; Henry St; Shorey St; Orient St; 17th.
Railroad features: Union Pacific RR.
Prescott neighborhood detailed profile
Produce and Waterfront neighborhood in Oakland statistics: (Find on map)
Area: 0.647 square miles
Population: 4,214
Population density:
Median household income in 2021:
Median rent in in 2021:
Male vs Females
Median age
Most popular occupations of males: sales and office occupations (19.1%); business and financial operations occupations (18.3%); management occupations (except farmers) (14.6%); computer and mathematical occupations (11.6%); service occupations (11.0%); transportation occupations (7.7%); healthcare practitioners and technical occupations (2.9%)
Most popular occupations of females: sales and office occupations (21.7%); service occupations (15.9%); business and financial operations occupations (14.3%); healthcare practitioners and technical occupations (14.3%); management occupations (except farmers) (9.0%); education, training, and library occupations (7.3%); legal occupations (4.6%)
Limited-access highways (interstate or state) in this neighborhood: I- 880 (State Hwy 17, Nimitz Fwy); I- 980 (Grove Shafter Fwy); Webster St Tube (Webster St, State Hwy 61).
Roads and streets: 4th St; Embarcadero W (1st St); 5th St; 2nd St; 3rd St; 6th St; Castro St; Broadway; Washington St; Jefferson St; Martin Luther King Jr Way; Embarcadero (Grove St, Martin Luther King Jr Way); 8th St; Jack London Sq (Water St); Interstate 880 N; 7th St; Alice St; Clay St; 10th St; 6th; 9th St; Jackson St; Franklin St; Oak St; Posey Tube (State Rte 260, Harrison St); Madison St; Brush St; Fallon St; Market St; Grove St (Martin Luther King Jr Way); Harrison St; Market; 11th St; 14th; 14th St; 12th St; 8th Ave; Victory Ct; 5th; Interstate 980 E; 13th St (Preservation Park Way); 5th Ave; Franklin; Webster Pl; Webster St; 7th.
Railroad features: Union Pacific RR; Bay Area Rapid Transit RR.
Other features: Merritt Chnnl.
Produce and Waterfront neighborhood detailed profile
Area: 0.647 square miles
Population: 4,214
Population density:
| Produce and Waterfront: | 6,509 people per square mile |
| Oakland: | 7,739 people per square mile |
Median household income in 2021:
| Produce and Waterfront: | $60,631 |
| Oakland: | $82,236 |
Median rent in in 2021:
| Produce and Waterfront: | $1,807 |
| Oakland: | $1,617 |
Male vs Females
| Males: | 2,102 |
| Females: | 2,111 |
Median age
| Males: | 42.1 years |
| Females: | 45.4 years |
Most popular occupations of males: sales and office occupations (19.1%); business and financial operations occupations (18.3%); management occupations (except farmers) (14.6%); computer and mathematical occupations (11.6%); service occupations (11.0%); transportation occupations (7.7%); healthcare practitioners and technical occupations (2.9%)
Most popular occupations of females: sales and office occupations (21.7%); service occupations (15.9%); business and financial operations occupations (14.3%); healthcare practitioners and technical occupations (14.3%); management occupations (except farmers) (9.0%); education, training, and library occupations (7.3%); legal occupations (4.6%)
Limited-access highways (interstate or state) in this neighborhood: I- 880 (State Hwy 17, Nimitz Fwy); I- 980 (Grove Shafter Fwy); Webster St Tube (Webster St, State Hwy 61).
Roads and streets: 4th St; Embarcadero W (1st St); 5th St; 2nd St; 3rd St; 6th St; Castro St; Broadway; Washington St; Jefferson St; Martin Luther King Jr Way; Embarcadero (Grove St, Martin Luther King Jr Way); 8th St; Jack London Sq (Water St); Interstate 880 N; 7th St; Alice St; Clay St; 10th St; 6th; 9th St; Jackson St; Franklin St; Oak St; Posey Tube (State Rte 260, Harrison St); Madison St; Brush St; Fallon St; Market St; Grove St (Martin Luther King Jr Way); Harrison St; Market; 11th St; 14th; 14th St; 12th St; 8th Ave; Victory Ct; 5th; Interstate 980 E; 13th St (Preservation Park Way); 5th Ave; Franklin; Webster Pl; Webster St; 7th.
Railroad features: Union Pacific RR; Bay Area Rapid Transit RR.
Other features: Merritt Chnnl.
Produce and Waterfront neighborhood detailed profile
Ralph Bunche neighborhood in Oakland statistics: (Find on map)
Area: 0.201 square miles
Population: 2,483
Population density:
Median household income in 2021:
Median rent in in 2021:
Male vs Females
Median age
Housing prices:
Average estimated value of detached houses in 2021 (31.4% of all units):
Average estimated value of townhouses or other attached units in 2021 (7.0% of all units):
Average estimated value of housing units in 2-unit structures in 2021 (18.2% of all units):
Average estimated '21 value of housing units in 5-or-more-unit structures (5.2% of all units):
Most popular occupations of males: management occupations (except farmers) (16.9%); service occupations (13.7%); sales and office occupations (11.2%); material moving occupations (7.8%); transportation occupations (7.6%); computer and mathematical occupations (7.1%); arts, design, entertainment, sports, and media occupations (6.7%)
Most popular occupations of females: management occupations (except farmers) (17.3%); sales and office occupations (12.9%); community and social services occupations (12.5%); service occupations (12.2%); business and financial operations occupations (9.8%); education, training, and library occupations (7.8%); legal occupations (5.2%)
Roads and streets: W Grand Ave; W Grand; 21st St; 19th St; 22nd St; Market St; 20th St; Brush St; West St; Market; Union St; 20th; Myrtle St; Adeline; Adeline St; Curtis St; Poplar; Poplar St; Mandela Pkwy (Cypress St); Chestnut St; Linden St; Filbert St; Grand.
Ralph Bunche neighborhood detailed profile
Area: 0.201 square miles
Population: 2,483
Population density:
| Ralph Bunche: | 12,368 people per square mile |
| Oakland: | 7,739 people per square mile |
Median household income in 2021:
| Ralph Bunche: | $69,841 |
| Oakland: | $82,236 |
Median rent in in 2021:
| Ralph Bunche: | $1,700 |
| Oakland: | $1,617 |
Male vs Females
| Males: | 1,019 |
| Females: | 1,463 |
Median age
| Males: | 32.5 years |
| Females: | 36.9 years |
Housing prices:
Average estimated value of detached houses in 2021 (31.4% of all units):
| Ralph Bunche: | $677,951 |
| Oakland: | $883,784 |
Average estimated value of townhouses or other attached units in 2021 (7.0% of all units):
| This neighborhood: | $477,917 |
| city: | $744,263 |
Average estimated value of housing units in 2-unit structures in 2021 (18.2% of all units):
| This neighborhood: | $722,562 |
| Oakland: | $732,452 |
Average estimated '21 value of housing units in 5-or-more-unit structures (5.2% of all units):
| Ralph Bunche: | $235,965 |
| Oakland: | $622,418 |
Most popular occupations of males: management occupations (except farmers) (16.9%); service occupations (13.7%); sales and office occupations (11.2%); material moving occupations (7.8%); transportation occupations (7.6%); computer and mathematical occupations (7.1%); arts, design, entertainment, sports, and media occupations (6.7%)
Most popular occupations of females: management occupations (except farmers) (17.3%); sales and office occupations (12.9%); community and social services occupations (12.5%); service occupations (12.2%); business and financial operations occupations (9.8%); education, training, and library occupations (7.8%); legal occupations (5.2%)
Roads and streets: W Grand Ave; W Grand; 21st St; 19th St; 22nd St; Market St; 20th St; Brush St; West St; Market; Union St; 20th; Myrtle St; Adeline; Adeline St; Curtis St; Poplar; Poplar St; Mandela Pkwy (Cypress St); Chestnut St; Linden St; Filbert St; Grand.
Ralph Bunche neighborhood detailed profile
Rancho San Antonio neighborhood in Oakland statistics: (Find on map)
Area: 0.282 square miles
Population: 4,850
Population density:
Median household income in 2021:
Median rent in in 2021:
Male vs Females
Median age
Most popular occupations of males: service occupations (42.6%); management occupations (except farmers) (13.1%); sales and office occupations (10.3%); construction, extraction, and maintenance occupations (7.9%); computer and mathematical occupations (7.3%); life, physical, and social science occupations (7.0%); material moving occupations (6.4%)
Most popular occupations of females: sales and office occupations (35.7%); service occupations (32.7%); education, training, and library occupations (10.7%); transportation occupations (7.7%); community and social services occupations (3.1%); life, physical, and social science occupations (2.0%); legal occupations (1.3%)
Roads and streets: E 19th St; E 15th St; E 20th St; Foothill; Foothill Blvd; Marin Way; E 21st; E 17th St; San Antonio Way; Sonoma Way; Gleason Way; 22nd Ave; Commerce Way; 21st Ave; 21st; 19th Ave; 16th Ave; 18th Ave; 20th Ave; Independence Way; 22nd; 17th Ave; 23rd Ave; 15th Ave; 23rd; Munson Way; E 21st St; 14th.
Rancho San Antonio neighborhood detailed profile
Area: 0.282 square miles
Population: 4,850
Population density:
| Rancho San Antonio: | 17,194 people per square mile |
| Oakland: | 7,739 people per square mile |
Median household income in 2021:
| Rancho San Antonio: | $60,592 |
| Oakland: | $82,236 |
Median rent in in 2021:
| Rancho San Antonio: | $1,101 |
| Oakland: | $1,617 |
Male vs Females
| Males: | 2,683 |
| Females: | 2,167 |
Median age
| Males: | 28.5 years |
| Females: | 41.5 years |
Most popular occupations of males: service occupations (42.6%); management occupations (except farmers) (13.1%); sales and office occupations (10.3%); construction, extraction, and maintenance occupations (7.9%); computer and mathematical occupations (7.3%); life, physical, and social science occupations (7.0%); material moving occupations (6.4%)
Most popular occupations of females: sales and office occupations (35.7%); service occupations (32.7%); education, training, and library occupations (10.7%); transportation occupations (7.7%); community and social services occupations (3.1%); life, physical, and social science occupations (2.0%); legal occupations (1.3%)
Roads and streets: E 19th St; E 15th St; E 20th St; Foothill; Foothill Blvd; Marin Way; E 21st; E 17th St; San Antonio Way; Sonoma Way; Gleason Way; 22nd Ave; Commerce Way; 21st Ave; 21st; 19th Ave; 16th Ave; 18th Ave; 20th Ave; Independence Way; 22nd; 17th Ave; 23rd Ave; 15th Ave; 23rd; Munson Way; E 21st St; 14th.
Rancho San Antonio neighborhood detailed profile
Redwood Heights neighborhood in Oakland statistics: (Find on map)
Area: 0.804 square miles
Population: 5,666
Population density:
Median household income in 2021:
Median rent in in 2021:
Male vs Females
Median age
Housing prices:
Average estimated value of detached houses in 2021 (84.9% of all units):
Average estimated value of townhouses or other attached units in 2021 (6.1% of all units):
Average estimated '21 value of housing units in 3-to-4-unit structures (18.4% of all units):
Average estimated '21 value of housing units in 5-or-more-unit structures (2.5% of all units):
Most popular occupations of males: management occupations (except farmers) (17.9%); sales and office occupations (13.4%); computer and mathematical occupations (12.5%); service occupations (10.8%); construction, extraction, and maintenance occupations (6.1%); community and social services occupations (5.7%); arts, design, entertainment, sports, and media occupations (5.3%)
Most popular occupations of females: management occupations (except farmers) (21.3%); education, training, and library occupations (17.8%); sales and office occupations (17.1%); business and financial operations occupations (11.3%); legal occupations (6.7%); community and social services occupations (5.9%); arts, design, entertainment, sports, and media occupations (5.1%)
Limited-access highways (interstate or state) in this neighborhood: I- 580; State Hwy 13.
Roads and streets: Warren Fwy; Reinhardt Dr; Mountain Blvd; Norton Ave; 39th Ave; Redwood Rd; Fair Ave; Davenport Ave; 35th Ave; Frontage Rd; Victor Ave; Aliso Ave; Wisconsin St; Harbor View Ave; Atlas Ave; Monterey Blvd; Carson St; Tompkins Ave; Jordan Rd; Guido St; Maybelle Ave; Detroit Ave; High St; Bayo St; Gregory St; Daisy St; Vale Ave; Midvale Ave; Anderson Ave; Cunningham St; Interstate 580 E; Kaphan Ave; Selkirk St; Huntington St; Herrier St; Elinora Ave; Virden Ave; Patterson Ave; Dunsmuir Ave; Bennett Pl; Shepherd St; Mattis Ct; Eastlake Ave; Brown Ave; Adelaide St; Loma Vista Ave; Kiwanis St; Magee Ave; Gregory Pl; Silverwood Ave; Oakleaf St; Willis Ct; Aspen Pl; Fieldbrook Rd; el Carmello Cir; Berneves Ct; Young Ave; Libby Ct; Arizona St; Toyon Pl; Kuhnle Ave; Madeline St.
Other features: Perlata Crk.
Redwood Heights neighborhood detailed profile
Area: 0.804 square miles
Population: 5,666
Population density:
| Redwood Heights: | 7,047 people per square mile |
| Oakland: | 7,739 people per square mile |
Median household income in 2021:
| Redwood Heights: | $124,231 |
| Oakland: | $82,236 |
Median rent in in 2021:
| Redwood Heights: | $2,431 |
| Oakland: | $1,617 |
Male vs Females
| Males: | 2,828 |
| Females: | 2,838 |
Median age
| Males: | 41.6 years |
| Females: | 44.2 years |
Housing prices:
Average estimated value of detached houses in 2021 (84.9% of all units):
| Redwood Heights: | $982,077 |
| Oakland: | $883,784 |
Average estimated value of townhouses or other attached units in 2021 (6.1% of all units):
| This neighborhood: | $592,465 |
| city: | $744,263 |
Average estimated '21 value of housing units in 3-to-4-unit structures (18.4% of all units):
| Redwood Heights: | $517,200 |
| city: | $699,145 |
Average estimated '21 value of housing units in 5-or-more-unit structures (2.5% of all units):
| Redwood Heights: | $493,534 |
| Oakland: | $622,418 |
Most popular occupations of males: management occupations (except farmers) (17.9%); sales and office occupations (13.4%); computer and mathematical occupations (12.5%); service occupations (10.8%); construction, extraction, and maintenance occupations (6.1%); community and social services occupations (5.7%); arts, design, entertainment, sports, and media occupations (5.3%)
Most popular occupations of females: management occupations (except farmers) (21.3%); education, training, and library occupations (17.8%); sales and office occupations (17.1%); business and financial operations occupations (11.3%); legal occupations (6.7%); community and social services occupations (5.9%); arts, design, entertainment, sports, and media occupations (5.1%)
Limited-access highways (interstate or state) in this neighborhood: I- 580; State Hwy 13.
Roads and streets: Warren Fwy; Reinhardt Dr; Mountain Blvd; Norton Ave; 39th Ave; Redwood Rd; Fair Ave; Davenport Ave; 35th Ave; Frontage Rd; Victor Ave; Aliso Ave; Wisconsin St; Harbor View Ave; Atlas Ave; Monterey Blvd; Carson St; Tompkins Ave; Jordan Rd; Guido St; Maybelle Ave; Detroit Ave; High St; Bayo St; Gregory St; Daisy St; Vale Ave; Midvale Ave; Anderson Ave; Cunningham St; Interstate 580 E; Kaphan Ave; Selkirk St; Huntington St; Herrier St; Elinora Ave; Virden Ave; Patterson Ave; Dunsmuir Ave; Bennett Pl; Shepherd St; Mattis Ct; Eastlake Ave; Brown Ave; Adelaide St; Loma Vista Ave; Kiwanis St; Magee Ave; Gregory Pl; Silverwood Ave; Oakleaf St; Willis Ct; Aspen Pl; Fieldbrook Rd; el Carmello Cir; Berneves Ct; Young Ave; Libby Ct; Arizona St; Toyon Pl; Kuhnle Ave; Madeline St.
Other features: Perlata Crk.
Redwood Heights neighborhood detailed profile
Rockridge neighborhood in Oakland statistics: (Find on map)
Area: 0.414 square miles
Population: 4,241
Population density:
Median household income in 2021:
Median rent in in 2021:
Male vs Females
Median age
Housing prices:
Average estimated value of detached houses in 2021 (58.7% of all units):
Average estimated '21 value of housing units in 5-or-more-unit structures (7.7% of all units):
Most popular occupations of males: sales and office occupations (15.3%); management occupations (except farmers) (14.8%); computer and mathematical occupations (13.0%); architecture and engineering occupations (10.4%); business and financial operations occupations (9.1%); education, training, and library occupations (7.4%); legal occupations (6.8%)
Most popular occupations of females: management occupations (except farmers) (22.3%); business and financial operations occupations (13.0%); sales and office occupations (10.2%); arts, design, entertainment, sports, and media occupations (10.0%); education, training, and library occupations (9.7%); life, physical, and social science occupations (8.0%); healthcare practitioners and technical occupations (7.2%)
Limited-access highways (interstate or state) in this neighborhood: State Hwy 24; State Hwy 24 (Grove Shafter Fwy).
Roads and streets: College Ave; Chabot Rd; Claremont Ave; Miles Ave; Broadway; College; Harwood Ave; Taft Ave; Keith Ave; Kales Ave; Florio St; Ross St; Lawton Ave; Oak Grove Ave; Manila Ave; Ocean View Dr; Bryant Ave; Mystic St; Auburn Ave; Presley Way; Eucalyptus Rd; Birch Ct; Ivanhoe Rd; Rockwell St; Ross Cir; Chabolyn Ter; Manor Crst; Armanino Ct; Pedestrian Way; McMillan St; Clover Dr; Chabot Crst; Chabot Ct; Roanoke Rd; Manoa St; Forest St; Ada St; Alcatraz Ave.
Railroad features: Bay Area Rapid Transit RR.
Rockridge neighborhood detailed profile
Area: 0.414 square miles
Population: 4,241
Population density:
| Rockridge: | 10,239 people per square mile |
| Oakland: | 7,739 people per square mile |
Median household income in 2021:
| Rockridge: | $181,727 |
| Oakland: | $82,236 |
Median rent in in 2021:
| Rockridge: | $2,274 |
| Oakland: | $1,617 |
Male vs Females
| Males: | 2,205 |
| Females: | 2,036 |
Median age
| Males: | 41.8 years |
| Females: | 43.7 years |
Housing prices:
Average estimated value of detached houses in 2021 (58.7% of all units):
| Rockridge: | $1,691,632 |
| Oakland: | $883,784 |
Average estimated '21 value of housing units in 5-or-more-unit structures (7.7% of all units):
| Rockridge: | $693,962 |
| Oakland: | $622,418 |
Most popular occupations of males: sales and office occupations (15.3%); management occupations (except farmers) (14.8%); computer and mathematical occupations (13.0%); architecture and engineering occupations (10.4%); business and financial operations occupations (9.1%); education, training, and library occupations (7.4%); legal occupations (6.8%)
Most popular occupations of females: management occupations (except farmers) (22.3%); business and financial operations occupations (13.0%); sales and office occupations (10.2%); arts, design, entertainment, sports, and media occupations (10.0%); education, training, and library occupations (9.7%); life, physical, and social science occupations (8.0%); healthcare practitioners and technical occupations (7.2%)
Limited-access highways (interstate or state) in this neighborhood: State Hwy 24; State Hwy 24 (Grove Shafter Fwy).
Roads and streets: College Ave; Chabot Rd; Claremont Ave; Miles Ave; Broadway; College; Harwood Ave; Taft Ave; Keith Ave; Kales Ave; Florio St; Ross St; Lawton Ave; Oak Grove Ave; Manila Ave; Ocean View Dr; Bryant Ave; Mystic St; Auburn Ave; Presley Way; Eucalyptus Rd; Birch Ct; Ivanhoe Rd; Rockwell St; Ross Cir; Chabolyn Ter; Manor Crst; Armanino Ct; Pedestrian Way; McMillan St; Clover Dr; Chabot Crst; Chabot Ct; Roanoke Rd; Manoa St; Forest St; Ada St; Alcatraz Ave.
Railroad features: Bay Area Rapid Transit RR.
Rockridge neighborhood detailed profile
San Pablo Gateway neighborhood in Oakland statistics: (Find on map)
Area: 0.135 square miles
Population: 1,579
Population density:
Median household income in 2021:
Median rent in in 2021:
Male vs Females
Median age
Most popular occupations of males: sales and office occupations (21.9%); management occupations (except farmers) (17.9%); construction, extraction, and maintenance occupations (14.3%); service occupations (12.9%); computer and mathematical occupations (11.7%); business and financial operations occupations (5.9%); healthcare practitioners and technical occupations (5.0%)
Most popular occupations of females: sales and office occupations (24.5%); business and financial operations occupations (19.3%); service occupations (17.5%); management occupations (except farmers) (11.2%); legal occupations (7.7%); healthcare practitioners and technical occupations (5.2%); community and social services occupations (4.5%)
Limited-access highways (interstate or state) in this neighborhood: I- 980 (Grove Shafter Fwy).
Roads and streets: Castro St; Martin Luther King Jr Way; San Pablo Ave; 18th St; 17th St; Jefferson St; 16th St; 15th St; 19th St; W Grand Ave; 20th St; San Pablo; 22nd St; W Grand; Northgate.
San Pablo Gateway neighborhood detailed profile
Area: 0.135 square miles
Population: 1,579
Population density:
| San Pablo Gateway: | 11,667 people per square mile |
| Oakland: | 7,739 people per square mile |
Median household income in 2021:
| San Pablo Gateway: | $51,350 |
| Oakland: | $82,236 |
Median rent in in 2021:
| San Pablo Gateway: | $1,377 |
| Oakland: | $1,617 |
Male vs Females
| Males: | 616 |
| Females: | 962 |
Median age
| Males: | 42.2 years |
| Females: | 35.7 years |
Most popular occupations of males: sales and office occupations (21.9%); management occupations (except farmers) (17.9%); construction, extraction, and maintenance occupations (14.3%); service occupations (12.9%); computer and mathematical occupations (11.7%); business and financial operations occupations (5.9%); healthcare practitioners and technical occupations (5.0%)
Most popular occupations of females: sales and office occupations (24.5%); business and financial operations occupations (19.3%); service occupations (17.5%); management occupations (except farmers) (11.2%); legal occupations (7.7%); healthcare practitioners and technical occupations (5.2%); community and social services occupations (4.5%)
Limited-access highways (interstate or state) in this neighborhood: I- 980 (Grove Shafter Fwy).
Roads and streets: Castro St; Martin Luther King Jr Way; San Pablo Ave; 18th St; 17th St; Jefferson St; 16th St; 15th St; 19th St; W Grand Ave; 20th St; San Pablo; 22nd St; W Grand; Northgate.
San Pablo Gateway neighborhood detailed profile
Sausal Creek neighborhood in Oakland statistics: (Find on map)
Area: 0.205 square miles
Population: 3,272
Population density:
Median household income in 2021:
Median rent in in 2021:
Male vs Females
Median age
Most popular occupations of males: sales and office occupations (16.3%); management occupations (except farmers) (15.9%); transportation occupations (14.2%); construction, extraction, and maintenance occupations (11.8%); service occupations (11.2%); arts, design, entertainment, sports, and media occupations (8.1%); production occupations (4.3%)
Most popular occupations of females: sales and office occupations (35.2%); service occupations (14.4%); education, training, and library occupations (13.8%); business and financial operations occupations (7.3%); management occupations (except farmers) (6.3%); healthcare practitioners and technical occupations (5.1%); architecture and engineering occupations (4.0%)
Roads and streets: Fruitvale Ave; Fruitvale; Brookdale Ave; Logan St; 26th Ave; E 27th St; E 22nd St; Woodbine Ave; McKillop Rd; Galindo St; Bellaire Pl; Cordova St; Hyde St; E 23rd St; Pleasant St; Blossom St; Castello St; Hickory St; Ashbrook Ct; School St; Nicol Ave; Bona St; Davis St; Barry Pl; Evelyn Ct; Lynde St; Peroly Ct; Garden St.
Other features: Sausal Crk.
Sausal Creek neighborhood detailed profile
Area: 0.205 square miles
Population: 3,272
Population density:
| Sausal Creek: | 15,923 people per square mile |
| Oakland: | 7,739 people per square mile |
Median household income in 2021:
| Sausal Creek: | $59,484 |
| Oakland: | $82,236 |
Median rent in in 2021:
| Sausal Creek: | $1,068 |
| Oakland: | $1,617 |
Male vs Females
| Males: | 1,626 |
| Females: | 1,646 |
Median age
| Males: | 38.5 years |
| Females: | 41.4 years |
Most popular occupations of males: sales and office occupations (16.3%); management occupations (except farmers) (15.9%); transportation occupations (14.2%); construction, extraction, and maintenance occupations (11.8%); service occupations (11.2%); arts, design, entertainment, sports, and media occupations (8.1%); production occupations (4.3%)
Most popular occupations of females: sales and office occupations (35.2%); service occupations (14.4%); education, training, and library occupations (13.8%); business and financial operations occupations (7.3%); management occupations (except farmers) (6.3%); healthcare practitioners and technical occupations (5.1%); architecture and engineering occupations (4.0%)
Roads and streets: Fruitvale Ave; Fruitvale; Brookdale Ave; Logan St; 26th Ave; E 27th St; E 22nd St; Woodbine Ave; McKillop Rd; Galindo St; Bellaire Pl; Cordova St; Hyde St; E 23rd St; Pleasant St; Blossom St; Castello St; Hickory St; Ashbrook Ct; School St; Nicol Ave; Bona St; Davis St; Barry Pl; Evelyn Ct; Lynde St; Peroly Ct; Garden St.
Other features: Sausal Crk.
Sausal Creek neighborhood detailed profile
School neighborhood in Oakland statistics: (Find on map)
Area: 0.101 square miles
Population: 1,324
Population density:
Median household income in 2021:
Median rent in in 2021:
Male vs Females
Median age
Most popular occupations of males: sales and office occupations (43.6%); service occupations (17.7%); material moving occupations (8.5%); construction, extraction, and maintenance occupations (6.9%); farming, fishing, and forestry occupations (6.7%); production occupations (6.2%); healthcare practitioners and technical occupations (4.7%)
Most popular occupations of females: service occupations (38.2%); healthcare practitioners and technical occupations (20.6%); production occupations (17.5%); business and financial operations occupations (14.3%); sales and office occupations (13.6%); management occupations (except farmers) (13.3%); community and social services occupations (8.4%)
Roads and streets: Coolidge Ave; Harold St; School St; Champion St; Nicol Ave; Cuthbert Ave; Capp St; Pleasant St; Boston Ave; Schyler St; Laguna Way; Wilson Pl.
School neighborhood detailed profile
Area: 0.101 square miles
Population: 1,324
Population density:
| School: | 13,077 people per square mile |
| Oakland: | 7,739 people per square mile |
Median household income in 2021:
| School: | $40,583 |
| Oakland: | $82,236 |
Median rent in in 2021:
| School: | $1,215 |
| Oakland: | $1,617 |
Male vs Females
| Males: | 691 |
| Females: | 633 |
Median age
| Males: | 35.2 years |
| Females: | 42.2 years |
Most popular occupations of males: sales and office occupations (43.6%); service occupations (17.7%); material moving occupations (8.5%); construction, extraction, and maintenance occupations (6.9%); farming, fishing, and forestry occupations (6.7%); production occupations (6.2%); healthcare practitioners and technical occupations (4.7%)
Most popular occupations of females: service occupations (38.2%); healthcare practitioners and technical occupations (20.6%); production occupations (17.5%); business and financial operations occupations (14.3%); sales and office occupations (13.6%); management occupations (except farmers) (13.3%); community and social services occupations (8.4%)
Roads and streets: Coolidge Ave; Harold St; School St; Champion St; Nicol Ave; Cuthbert Ave; Capp St; Pleasant St; Boston Ave; Schyler St; Laguna Way; Wilson Pl.
School neighborhood detailed profile
Seminary neighborhood in Oakland statistics: (Find on map)
Area: 0.279 square miles
Population: 4,812
Population density:
Median household income in 2021:
Median rent in in 2021:
Male vs Females
Median age
Average estimated value of detached houses in 2021 (41.4% of all units):
Most popular occupations of males: construction, extraction, and maintenance occupations (30.9%); service occupations (17.2%); material moving occupations (12.9%); sales and office occupations (6.3%); healthcare practitioners and technical occupations (5.4%); production occupations (3.5%); arts, design, entertainment, sports, and media occupations (3.4%)
Most popular occupations of females: sales and office occupations (41.7%); service occupations (27.8%); management occupations (except farmers) (13.2%); business and financial operations occupations (5.6%); education, training, and library occupations (3.9%); community and social services occupations (3.3%); architecture and engineering occupations (2.9%)
Highways in this neighborhood: State Hwy 185 (International Blvd, E 14th St).
Roads and streets: 57th Ave; Seminary Ave; International Blvd; 62nd Ave; E 16th St; 64th Ave; Hilton St; Harmon Ave; E 17th St; Hayes St; Bromley Ave; Bancroft Ave; 56th Ave; Holway St; 61st Ave; Trask St; Elizabeth St; E 15th St; Holway Ct; Seminary Ct; Avenal Ave; 58th Ave.
Seminary neighborhood detailed profile
Area: 0.279 square miles
Population: 4,812
Population density:
| Seminary: | 17,269 people per square mile |
| Oakland: | 7,739 people per square mile |
Median household income in 2021:
| Seminary: | $56,965 |
| Oakland: | $82,236 |
Median rent in in 2021:
| Seminary: | $1,255 |
| Oakland: | $1,617 |
Male vs Females
| Males: | 2,359 |
| Females: | 2,452 |
Median age
| Males: | 32.6 years |
| Females: | 36.6 years |
Average estimated value of detached houses in 2021 (41.4% of all units):
| Seminary: | $412,598 |
| Oakland: | $883,784 |
Most popular occupations of males: construction, extraction, and maintenance occupations (30.9%); service occupations (17.2%); material moving occupations (12.9%); sales and office occupations (6.3%); healthcare practitioners and technical occupations (5.4%); production occupations (3.5%); arts, design, entertainment, sports, and media occupations (3.4%)
Most popular occupations of females: sales and office occupations (41.7%); service occupations (27.8%); management occupations (except farmers) (13.2%); business and financial operations occupations (5.6%); education, training, and library occupations (3.9%); community and social services occupations (3.3%); architecture and engineering occupations (2.9%)
Highways in this neighborhood: State Hwy 185 (International Blvd, E 14th St).
Roads and streets: 57th Ave; Seminary Ave; International Blvd; 62nd Ave; E 16th St; 64th Ave; Hilton St; Harmon Ave; E 17th St; Hayes St; Bromley Ave; Bancroft Ave; 56th Ave; Holway St; 61st Ave; Trask St; Elizabeth St; E 15th St; Holway Ct; Seminary Ct; Avenal Ave; 58th Ave.
Seminary neighborhood detailed profile
Sequoyah neighborhood in Oakland statistics: (Find on map)
Area: 2.783 square miles
Population: 5,735
Population density:
Median household income in 2021:
Median rent in in 2021:
Male vs Females
Median age
Housing prices:
Average estimated value of detached houses in 2021 (76.7% of all units):
Average estimated value of townhouses or other attached units in 2021 (10.7% of all units):
Average estimated '21 value of housing units in 3-to-4-unit structures (11.3% of all units):
Average estimated '21 value of housing units in 5-or-more-unit structures (2.3% of all units):
Most popular occupations of males: management occupations (except farmers) (19.1%); sales and office occupations (13.3%); arts, design, entertainment, sports, and media occupations (12.9%); service occupations (10.1%); computer and mathematical occupations (9.2%); business and financial operations occupations (8.6%); legal occupations (7.0%)
Most popular occupations of females: sales and office occupations (19.5%); management occupations (except farmers) (15.9%); healthcare practitioners and technical occupations (14.2%); education, training, and library occupations (11.1%); community and social services occupations (11.0%); service occupations (6.4%); business and financial operations occupations (6.2%)
Limited-access highways (interstate or state) in this neighborhood: I- 580.
Roads and streets: Skyline Blvd; Keller Ave; Golf Links Rd; Keller; Mountain Blvd; Sequoyah Rd; Golf Links; Elysian Fields Dr; Oak Hill Rd; Mountain; Surrey Ln; Hansom Dr; Tank Farm; Johnson Rd; Sigourney Elysian Fields Dr; Canyon Oaks Dr; St Andrews Rd; Sequoyah View Dr; Pool; Williams St; Naval Hospital; Phaeton Dr; Heafey Rd; San Leandro St; Royal Oak Rd; Cheshire; Coach Dr; Skyline; Thousand Oaks (Thousand Oaks St); Fairway Ave; Campus Dr; Briar Cliff Rd; Johnson Cir; Skyline Cir; Donna Way; Alexander St; Campus; Shay Dr; Greenview Dr; Transportation; Calafia Ave; Sage Rd; Englewood Dr; Long; Hansom; Beeman; Greenridge Dr; O' Relly; San Leandro N; Rall; Shadow Mountain; Short Hill Rd; Barcelona St; Tajum; Sigourney Ave; Whitecliff Rd; Gateview Dr; Venetia Rd; Wil Kinson; Blackwood; Evans; Rigness; Dorisa Ave; Rilea Way; Mountain Valley (Mountain Valley St); Orinda Vista Dr; Ironwood; Graeagle (Graeagle St); Canyon Oaks; Mendenhall Rd; San Leandro S; Burgos; Sequoyah; Turnley Ave; Johnson; Twin Oaks Way; Pebble Beach Dr; Pinecrest Dr; Santa Cruz Rd; McGurrin Rd; Sequoyah View Ct; Turtle Creek St; Miles; Ridgemoor Rd; Crowley; Oak Hill Cir; Mission Hill (Mission Hills St); Heritage; Anza Ave; Chimney Rock; Fox Hills Ct; Fairhill Ct; Chariot Ln; Inverness Ct; Burgos Ave; Dickson Ct; Kentwood Ct; Shone Ave; Thunderbird Ct; Alexander; Seacor Ct; Whitecliff Ct; Quietwood; Riviera Ct; Camisa Cir; Silverado Ct; Ettrick St; Fontaine Ct; Elysian Pl; Tamarisk Dr; Kentwood.
Sequoyah neighborhood detailed profile
Area: 2.783 square miles
Population: 5,735
Population density:
| Sequoyah: | 2,061 people per square mile |
| Oakland: | 7,739 people per square mile |
Median household income in 2021:
| Sequoyah: | $126,929 |
| Oakland: | $82,236 |
Median rent in in 2021:
| Sequoyah: | $2,287 |
| Oakland: | $1,617 |
Male vs Females
| Males: | 2,661 |
| Females: | 3,073 |
Median age
| Males: | 45.3 years |
| Females: | 46.2 years |
Housing prices:
Average estimated value of detached houses in 2021 (76.7% of all units):
| Sequoyah: | $1,182,244 |
| Oakland: | $883,784 |
Average estimated value of townhouses or other attached units in 2021 (10.7% of all units):
| This neighborhood: | $746,493 |
| city: | $744,263 |
Average estimated '21 value of housing units in 3-to-4-unit structures (11.3% of all units):
| Sequoyah: | $582,989 |
| city: | $699,145 |
Average estimated '21 value of housing units in 5-or-more-unit structures (2.3% of all units):
| Sequoyah: | $1,059,719 |
| Oakland: | $622,418 |
Most popular occupations of males: management occupations (except farmers) (19.1%); sales and office occupations (13.3%); arts, design, entertainment, sports, and media occupations (12.9%); service occupations (10.1%); computer and mathematical occupations (9.2%); business and financial operations occupations (8.6%); legal occupations (7.0%)
Most popular occupations of females: sales and office occupations (19.5%); management occupations (except farmers) (15.9%); healthcare practitioners and technical occupations (14.2%); education, training, and library occupations (11.1%); community and social services occupations (11.0%); service occupations (6.4%); business and financial operations occupations (6.2%)
Limited-access highways (interstate or state) in this neighborhood: I- 580.
Roads and streets: Skyline Blvd; Keller Ave; Golf Links Rd; Keller; Mountain Blvd; Sequoyah Rd; Golf Links; Elysian Fields Dr; Oak Hill Rd; Mountain; Surrey Ln; Hansom Dr; Tank Farm; Johnson Rd; Sigourney Elysian Fields Dr; Canyon Oaks Dr; St Andrews Rd; Sequoyah View Dr; Pool; Williams St; Naval Hospital; Phaeton Dr; Heafey Rd; San Leandro St; Royal Oak Rd; Cheshire; Coach Dr; Skyline; Thousand Oaks (Thousand Oaks St); Fairway Ave; Campus Dr; Briar Cliff Rd; Johnson Cir; Skyline Cir; Donna Way; Alexander St; Campus; Shay Dr; Greenview Dr; Transportation; Calafia Ave; Sage Rd; Englewood Dr; Long; Hansom; Beeman; Greenridge Dr; O' Relly; San Leandro N; Rall; Shadow Mountain; Short Hill Rd; Barcelona St; Tajum; Sigourney Ave; Whitecliff Rd; Gateview Dr; Venetia Rd; Wil Kinson; Blackwood; Evans; Rigness; Dorisa Ave; Rilea Way; Mountain Valley (Mountain Valley St); Orinda Vista Dr; Ironwood; Graeagle (Graeagle St); Canyon Oaks; Mendenhall Rd; San Leandro S; Burgos; Sequoyah; Turnley Ave; Johnson; Twin Oaks Way; Pebble Beach Dr; Pinecrest Dr; Santa Cruz Rd; McGurrin Rd; Sequoyah View Ct; Turtle Creek St; Miles; Ridgemoor Rd; Crowley; Oak Hill Cir; Mission Hill (Mission Hills St); Heritage; Anza Ave; Chimney Rock; Fox Hills Ct; Fairhill Ct; Chariot Ln; Inverness Ct; Burgos Ave; Dickson Ct; Kentwood Ct; Shone Ave; Thunderbird Ct; Alexander; Seacor Ct; Whitecliff Ct; Quietwood; Riviera Ct; Camisa Cir; Silverado Ct; Ettrick St; Fontaine Ct; Elysian Pl; Tamarisk Dr; Kentwood.
Sequoyah neighborhood detailed profile
Shafter neighborhood in Oakland statistics: (Find on map)
Area: 0.294 square miles
Population: 3,765
Population density:
Median household income in 2021:
Median rent in in 2021:
Male vs Females
Median age
Housing prices:
Average estimated value of detached houses in 2021 (38.4% of all units):
Average estimated value of townhouses or other attached units in 2021 (6.1% of all units):
Most popular occupations of males: business and financial operations occupations (17.1%); management occupations (except farmers) (15.8%); sales and office occupations (13.6%); computer and mathematical occupations (9.9%); education, training, and library occupations (7.6%); architecture and engineering occupations (7.1%); healthcare practitioners and technical occupations (6.3%)
Most popular occupations of females: sales and office occupations (19.9%); management occupations (except farmers) (18.2%); healthcare practitioners and technical occupations (11.7%); arts, design, entertainment, sports, and media occupations (10.1%); business and financial operations occupations (7.7%); service occupations (7.5%); education, training, and library occupations (6.7%)
Limited-access highways (interstate or state) in this neighborhood: State Hwy 24 (Grove Shafter Fwy).
Roads and streets: Clifton St; Shafter Ave; Claremont Ave; Locksley Ave; Cavour St; Boyd Ave; Miles Ave; Hudson St; Telegraph Ave; Lawton Ave; James Ave; Claremont; 55th St; Vicente Way; Telegraph; Forest St; Manila Ave; Redondo Ave; Avon St; Glendale Ave; Desmond St; Hardy St; 54th St; 53rd St; Clarke St; 56th St.
Railroad features: Bay Area Rapid Transit RR.
Shafter neighborhood detailed profile
Area: 0.294 square miles
Population: 3,765
Population density:
| Shafter: | 12,804 people per square mile |
| Oakland: | 7,739 people per square mile |
Median household income in 2021:
| Shafter: | $139,366 |
| Oakland: | $82,236 |
Median rent in in 2021:
| Shafter: | $1,886 |
| Oakland: | $1,617 |
Male vs Females
| Males: | 1,801 |
| Females: | 1,964 |
Median age
| Males: | 37.5 years |
| Females: | 39.0 years |
Housing prices:
Average estimated value of detached houses in 2021 (38.4% of all units):
| Shafter: | $1,056,977 |
| Oakland: | $883,784 |
Average estimated value of townhouses or other attached units in 2021 (6.1% of all units):
| This neighborhood: | $1,125,781 |
| city: | $744,263 |
Most popular occupations of males: business and financial operations occupations (17.1%); management occupations (except farmers) (15.8%); sales and office occupations (13.6%); computer and mathematical occupations (9.9%); education, training, and library occupations (7.6%); architecture and engineering occupations (7.1%); healthcare practitioners and technical occupations (6.3%)
Most popular occupations of females: sales and office occupations (19.9%); management occupations (except farmers) (18.2%); healthcare practitioners and technical occupations (11.7%); arts, design, entertainment, sports, and media occupations (10.1%); business and financial operations occupations (7.7%); service occupations (7.5%); education, training, and library occupations (6.7%)
Limited-access highways (interstate or state) in this neighborhood: State Hwy 24 (Grove Shafter Fwy).
Roads and streets: Clifton St; Shafter Ave; Claremont Ave; Locksley Ave; Cavour St; Boyd Ave; Miles Ave; Hudson St; Telegraph Ave; Lawton Ave; James Ave; Claremont; 55th St; Vicente Way; Telegraph; Forest St; Manila Ave; Redondo Ave; Avon St; Glendale Ave; Desmond St; Hardy St; 54th St; 53rd St; Clarke St; 56th St.
Railroad features: Bay Area Rapid Transit RR.
Shafter neighborhood detailed profile
Sheffield Village neighborhood in Oakland statistics: (Find on map)
Area: 0.145 square miles
Population: 167
Population density:
Median household income in 2021:
Median rent in in 2021:
Male vs Females
Median age
Average estimated value of detached houses in 2021 (93.3% of all units):
Most popular occupations of males: management occupations (except farmers) (22.8%); service occupations (13.7%); sales and office occupations (11.9%); business and financial operations occupations (11.1%); architecture and engineering occupations (9.4%); computer and mathematical occupations (8.6%); arts, design, entertainment, sports, and media occupations (6.4%)
Most popular occupations of females: sales and office occupations (23.9%); education, training, and library occupations (19.5%); management occupations (except farmers) (17.5%); service occupations (14.8%); business and financial operations occupations (8.8%); healthcare practitioners and technical occupations (6.4%); arts, design, entertainment, sports, and media occupations (4.3%)
Limited-access highways (interstate or state) in this neighborhood: I- 580 (Macarthur Fwy).
Roads and streets: Revere Ave; Marlow Dr; Covington St; Roxbury Ave; Middleton St; Brookfield Ave; Foothill Blvd (Foothill Way); Danbury St; Macarthur Blvd.
Other features: San Leandro Crk.
Sheffield Village neighborhood detailed profile
Area: 0.145 square miles
Population: 167
Population density:
| Sheffield Village: | 1,154 people per square mile |
| Oakland: | 7,739 people per square mile |
Median household income in 2021:
| Sheffield Village: | $142,926 |
| Oakland: | $82,236 |
Median rent in in 2021:
| Sheffield Village: | $1,977 |
| Oakland: | $1,617 |
Male vs Females
| Males: | 76 |
| Females: | 90 |
Median age
| Males: | 43.6 years |
| Females: | 42.1 years |
Average estimated value of detached houses in 2021 (93.3% of all units):
| Sheffield Village: | $883,676 |
| Oakland: | $883,784 |
Most popular occupations of males: management occupations (except farmers) (22.8%); service occupations (13.7%); sales and office occupations (11.9%); business and financial operations occupations (11.1%); architecture and engineering occupations (9.4%); computer and mathematical occupations (8.6%); arts, design, entertainment, sports, and media occupations (6.4%)
Most popular occupations of females: sales and office occupations (23.9%); education, training, and library occupations (19.5%); management occupations (except farmers) (17.5%); service occupations (14.8%); business and financial operations occupations (8.8%); healthcare practitioners and technical occupations (6.4%); arts, design, entertainment, sports, and media occupations (4.3%)
Limited-access highways (interstate or state) in this neighborhood: I- 580 (Macarthur Fwy).
Roads and streets: Revere Ave; Marlow Dr; Covington St; Roxbury Ave; Middleton St; Brookfield Ave; Foothill Blvd (Foothill Way); Danbury St; Macarthur Blvd.
Other features: San Leandro Crk.
Sheffield Village neighborhood detailed profile
Shepherd Canyon neighborhood in Oakland statistics: (Find on map)
Area: 0.495 square miles
Population: 1,801
Population density:
Median household income in 2021:
Median rent in in 2021:
Male vs Females
Median age
Average estimated value of detached houses in 2021 (85.9% of all units):
Most popular occupations of males: management occupations (except farmers) (25.5%); sales and office occupations (15.8%); business and financial operations occupations (12.1%); healthcare practitioners and technical occupations (11.5%); computer and mathematical occupations (7.4%); construction, extraction, and maintenance occupations (4.8%); life, physical, and social science occupations (4.7%)
Most popular occupations of females: management occupations (except farmers) (25.0%); sales and office occupations (16.5%); business and financial operations occupations (9.9%); service occupations (8.7%); computer and mathematical occupations (8.3%); education, training, and library occupations (7.4%); healthcare practitioners and technical occupations (7.3%)
Roads and streets: Shepherd Canyon Rd; Gunn Dr; Woodrow Dr; Park Blvd; Balboa Dr; Sayre Dr; Moraga Ave; Moore Dr; Scarborough Dr; Saroni Dr; Mountain Blvd; Snake Rd; Warren Fwy; Evergreen Ave; Chelton Dr; Aitken Dr; Tiffany Ln; Chelton Ln; Shelterwood Dr; Paso Robles Dr; Las Flores Ct; Eastwood Ct; Asilomar Dr; Pine Hills Dr; Forestland Way; Manzanita Dr; White Ct; Pine Hills Ct; Andrews St; Banning Dr; Cortez Ct; West Cir; Chico Ct; Saroni Ct; Skyline Blvd; Azalea Ln; Scout Rd.
Shepherd Canyon neighborhood detailed profile
Area: 0.495 square miles
Population: 1,801
Population density:
| Shepherd Canyon: | 3,635 people per square mile |
| Oakland: | 7,739 people per square mile |
Median household income in 2021:
| Shepherd Canyon: | $198,481 |
| Oakland: | $82,236 |
Median rent in in 2021:
| Shepherd Canyon: | $2,075 |
| Oakland: | $1,617 |
Male vs Females
| Males: | 851 |
| Females: | 949 |
Median age
| Males: | 48.6 years |
| Females: | 49.8 years |
Average estimated value of detached houses in 2021 (85.9% of all units):
| Shepherd Canyon: | $1,089,355 |
| Oakland: | $883,784 |
Most popular occupations of males: management occupations (except farmers) (25.5%); sales and office occupations (15.8%); business and financial operations occupations (12.1%); healthcare practitioners and technical occupations (11.5%); computer and mathematical occupations (7.4%); construction, extraction, and maintenance occupations (4.8%); life, physical, and social science occupations (4.7%)
Most popular occupations of females: management occupations (except farmers) (25.0%); sales and office occupations (16.5%); business and financial operations occupations (9.9%); service occupations (8.7%); computer and mathematical occupations (8.3%); education, training, and library occupations (7.4%); healthcare practitioners and technical occupations (7.3%)
Roads and streets: Shepherd Canyon Rd; Gunn Dr; Woodrow Dr; Park Blvd; Balboa Dr; Sayre Dr; Moraga Ave; Moore Dr; Scarborough Dr; Saroni Dr; Mountain Blvd; Snake Rd; Warren Fwy; Evergreen Ave; Chelton Dr; Aitken Dr; Tiffany Ln; Chelton Ln; Shelterwood Dr; Paso Robles Dr; Las Flores Ct; Eastwood Ct; Asilomar Dr; Pine Hills Dr; Forestland Way; Manzanita Dr; White Ct; Pine Hills Ct; Andrews St; Banning Dr; Cortez Ct; West Cir; Chico Ct; Saroni Ct; Skyline Blvd; Azalea Ln; Scout Rd.
Shepherd Canyon neighborhood detailed profile
Skyline - Hillcrest Estates neighborhood in Oakland statistics: (Find on map)
Area: 0.979 square miles
Population: 383
Population density:
Median household income in 2021:
Median rent in in 2021:
Male vs Females
Median age
Housing prices:
Average estimated value of detached houses in 2021 (16.5% of all units):
Average estimated value of townhouses or other attached units in 2021 (25.0% of all units):
Average estimated '21 value of housing units in 3-to-4-unit structures (40.3% of all units):
Average estimated '21 value of housing units in 5-or-more-unit structures (8.5% of all units):
Most popular occupations of males: computer and mathematical occupations (17.9%); service occupations (16.7%); transportation occupations (14.9%); material moving occupations (14.9%); management occupations (except farmers) (11.2%); healthcare practitioners and technical occupations (6.3%); legal occupations (4.6%)
Most popular occupations of females: sales and office occupations (36.7%); arts, design, entertainment, sports, and media occupations (19.8%); computer and mathematical occupations (18.3%); management occupations (except farmers) (7.5%); service occupations (7.3%); architecture and engineering occupations (7.2%); production occupations (6.1%)
Roads and streets: Skyline Blvd; Brookpark Rd; Fernhoff Rd; Balmoral Dr; Bacon Rd; Saddle Brook Dr; Skyline; Hillcrest Ct; Old Redwood Rd (Redwood Rd); Weaver Pl; Parkridge Dr; Clairepointe Way; Blythen Way; Tartan Way; Parkhurst Dr; Denton Pl; Bell Waver Way; Colbourn Pl; Crestview Dr; Slopecrest Dr; Fernhoff Ct; Knoll Ridge Way; Lexford Pl; Cathy Ln; Shawnee Ct; Chappell Pl; Brandy Rock Way; Dreyer Pl; Saddle Brook Ct; Mott Pl; Skyway Ln; Graham Pl; Graham.
Skyline - Hillcrest Estates neighborhood detailed profile
Area: 0.979 square miles
Population: 383
Population density:
| Skyline - Hillcrest Estates: | 391 people per square mile |
| Oakland: | 7,739 people per square mile |
Median household income in 2021:
| Skyline - Hillcrest Estates: | $119,409 |
| Oakland: | $82,236 |
Median rent in in 2021:
| Skyline - Hillcrest Estates: | $1,943 |
| Oakland: | $1,617 |
Male vs Females
| Males: | 192 |
| Females: | 190 |
Median age
| Males: | 47.3 years |
| Females: | 41.3 years |
Housing prices:
Average estimated value of detached houses in 2021 (16.5% of all units):
| Skyline - Hillcrest Estates: | $987,107 |
| Oakland: | $883,784 |
Average estimated value of townhouses or other attached units in 2021 (25.0% of all units):
| This neighborhood: | $665,882 |
| city: | $744,263 |
Average estimated '21 value of housing units in 3-to-4-unit structures (40.3% of all units):
| Skyline - Hillcrest Estates: | $582,989 |
| city: | $699,145 |
Average estimated '21 value of housing units in 5-or-more-unit structures (8.5% of all units):
| Skyline - Hillcrest Estates: | $1,059,719 |
| Oakland: | $622,418 |
Most popular occupations of males: computer and mathematical occupations (17.9%); service occupations (16.7%); transportation occupations (14.9%); material moving occupations (14.9%); management occupations (except farmers) (11.2%); healthcare practitioners and technical occupations (6.3%); legal occupations (4.6%)
Most popular occupations of females: sales and office occupations (36.7%); arts, design, entertainment, sports, and media occupations (19.8%); computer and mathematical occupations (18.3%); management occupations (except farmers) (7.5%); service occupations (7.3%); architecture and engineering occupations (7.2%); production occupations (6.1%)
Roads and streets: Skyline Blvd; Brookpark Rd; Fernhoff Rd; Balmoral Dr; Bacon Rd; Saddle Brook Dr; Skyline; Hillcrest Ct; Old Redwood Rd (Redwood Rd); Weaver Pl; Parkridge Dr; Clairepointe Way; Blythen Way; Tartan Way; Parkhurst Dr; Denton Pl; Bell Waver Way; Colbourn Pl; Crestview Dr; Slopecrest Dr; Fernhoff Ct; Knoll Ridge Way; Lexford Pl; Cathy Ln; Shawnee Ct; Chappell Pl; Brandy Rock Way; Dreyer Pl; Saddle Brook Ct; Mott Pl; Skyway Ln; Graham Pl; Graham.
Skyline - Hillcrest Estates neighborhood detailed profile
Sobrante Park neighborhood in Oakland statistics: (Find on map)
Area: 0.263 square miles
Population: 1,927
Population density:
Median household income in 2021:
Median rent in in 2021:
Male vs Females
Median age
Housing prices:
Average estimated value of detached houses in 2021 (83.0% of all units):
Average estimated value of townhouses or other attached units in 2021 (4.5% of all units):
Most popular occupations of males: service occupations (18.2%); architecture and engineering occupations (14.8%); construction, extraction, and maintenance occupations (14.6%); transportation occupations (14.2%); sales and office occupations (8.7%); production occupations (7.2%); material moving occupations (4.9%)
Most popular occupations of females: sales and office occupations (39.3%); service occupations (30.1%); community and social services occupations (9.5%); production occupations (5.5%); healthcare practitioners and technical occupations (4.8%); education, training, and library occupations (3.4%); management occupations (except farmers) (3.0%)
Roads and streets: 105th Ave; Acalanes Dr; Catron Dr; Bergedo Dr; el Paseo Dr; Capistrano Dr; Estepa Dr; Edes Ave; Creekside Cir; Almanza Dr; Novelda Dr; Topanga Dr; Brookside Dr; Colorados Dr; Alder Creek Cir; Gramercy Pl; la Prenda Dr; Reposo Dr; Knight St; East; East Ct; West Ct; Nattress Way; June Ct; Black Pine Dr; Patricia Ct; Pueblo Dr.
Other features: San Leandro Crk.
Sobrante Park neighborhood detailed profile
Area: 0.263 square miles
Population: 1,927
Population density:
| Sobrante Park: | 7,316 people per square mile |
| Oakland: | 7,739 people per square mile |
Median household income in 2021:
| Sobrante Park: | $68,725 |
| Oakland: | $82,236 |
Median rent in in 2021:
| Sobrante Park: | $1,412 |
| Oakland: | $1,617 |
Male vs Females
| Males: | 919 |
| Females: | 1,007 |
Median age
| Males: | 35.8 years |
| Females: | 36.4 years |
Housing prices:
Average estimated value of detached houses in 2021 (83.0% of all units):
| Sobrante Park: | $409,887 |
| Oakland: | $883,784 |
Average estimated value of townhouses or other attached units in 2021 (4.5% of all units):
| This neighborhood: | $525,120 |
| city: | $744,263 |
Most popular occupations of males: service occupations (18.2%); architecture and engineering occupations (14.8%); construction, extraction, and maintenance occupations (14.6%); transportation occupations (14.2%); sales and office occupations (8.7%); production occupations (7.2%); material moving occupations (4.9%)
Most popular occupations of females: sales and office occupations (39.3%); service occupations (30.1%); community and social services occupations (9.5%); production occupations (5.5%); healthcare practitioners and technical occupations (4.8%); education, training, and library occupations (3.4%); management occupations (except farmers) (3.0%)
Roads and streets: 105th Ave; Acalanes Dr; Catron Dr; Bergedo Dr; el Paseo Dr; Capistrano Dr; Estepa Dr; Edes Ave; Creekside Cir; Almanza Dr; Novelda Dr; Topanga Dr; Brookside Dr; Colorados Dr; Alder Creek Cir; Gramercy Pl; la Prenda Dr; Reposo Dr; Knight St; East; East Ct; West Ct; Nattress Way; June Ct; Black Pine Dr; Patricia Ct; Pueblo Dr.
Other features: San Leandro Crk.
Sobrante Park neighborhood detailed profile
South Kennedy Tract neighborhood in Oakland statistics: (Find on map)
Area: 0.439 square miles
Population: 2,075
Population density:
Median household income in 2021:
Median rent in in 2021:
Male vs Females
Median age
Housing prices:
Average estimated value of detached houses in 2021 (21.5% of all units):
Average estimated value of townhouses or other attached units in 2021 (18.5% of all units):
Most popular occupations of males: sales and office occupations (22.0%); architecture and engineering occupations (8.9%); material moving occupations (8.7%); construction, extraction, and maintenance occupations (8.5%); education, training, and library occupations (8.0%); computer and mathematical occupations (6.7%); management occupations (except farmers) (6.4%)
Most popular occupations of females: sales and office occupations (18.0%); production occupations (17.3%); service occupations (17.1%); management occupations (except farmers) (14.1%); life, physical, and social science occupations (6.8%); business and financial operations occupations (6.7%); arts, design, entertainment, sports, and media occupations (5.7%)
Limited-access highways (interstate or state) in this neighborhood: State Hwy 17 (Nimitz Fwy, I- 880).
Roads and streets: High St; E 7th St; Alameda Ave; E 8th St; High; Chapman St; Ford St; Kennedy St; Glascock St (Glascock Street); Elmwood Ave; 23rd Ave; Fruitvale Ave; Derby Ave; Lancaster St; Diesel St; 29th Ave; Peterson St; Frederick St; 42nd Ave; 23rd Ave Ovp; E 7th; 29th Ave Ovp; 37th Ave; Wattling St; San Leandro; San Leandro St; 36th Ave; Boehmer St; Embarcadero; Fruitvale; Shasta Ave; 34th Ave.
Railroad features: Union Pacific RR; Bay Area Rapid Transit RR.
South Kennedy Tract neighborhood detailed profile
Area: 0.439 square miles
Population: 2,075
Population density:
| South Kennedy Tract: | 4,726 people per square mile |
| Oakland: | 7,739 people per square mile |
Median household income in 2021:
| South Kennedy Tract: | $70,360 |
| Oakland: | $82,236 |
Median rent in in 2021:
| South Kennedy Tract: | $1,819 |
| Oakland: | $1,617 |
Male vs Females
| Males: | 1,080 |
| Females: | 995 |
Median age
| Males: | 36.7 years |
| Females: | 36.2 years |
Housing prices:
Average estimated value of detached houses in 2021 (21.5% of all units):
| South Kennedy Tract: | $557,650 |
| Oakland: | $883,784 |
Average estimated value of townhouses or other attached units in 2021 (18.5% of all units):
| This neighborhood: | $619,408 |
| city: | $744,263 |
Most popular occupations of males: sales and office occupations (22.0%); architecture and engineering occupations (8.9%); material moving occupations (8.7%); construction, extraction, and maintenance occupations (8.5%); education, training, and library occupations (8.0%); computer and mathematical occupations (6.7%); management occupations (except farmers) (6.4%)
Most popular occupations of females: sales and office occupations (18.0%); production occupations (17.3%); service occupations (17.1%); management occupations (except farmers) (14.1%); life, physical, and social science occupations (6.8%); business and financial operations occupations (6.7%); arts, design, entertainment, sports, and media occupations (5.7%)
Limited-access highways (interstate or state) in this neighborhood: State Hwy 17 (Nimitz Fwy, I- 880).
Roads and streets: High St; E 7th St; Alameda Ave; E 8th St; High; Chapman St; Ford St; Kennedy St; Glascock St (Glascock Street); Elmwood Ave; 23rd Ave; Fruitvale Ave; Derby Ave; Lancaster St; Diesel St; 29th Ave; Peterson St; Frederick St; 42nd Ave; 23rd Ave Ovp; E 7th; 29th Ave Ovp; 37th Ave; Wattling St; San Leandro; San Leandro St; 36th Ave; Boehmer St; Embarcadero; Fruitvale; Shasta Ave; 34th Ave.
Railroad features: Union Pacific RR; Bay Area Rapid Transit RR.
South Kennedy Tract neighborhood detailed profile
South Prescott neighborhood in Oakland statistics: (Find on map)
Area: 0.201 square miles
Population: 2,435
Population density:
Median household income in 2021:
Median rent in in 2021:
Male vs Females
Median age
Average estimated value of detached houses in 2021 (32.4% of all units):
Most popular occupations of males: sales and office occupations (27.6%); management occupations (except farmers) (12.5%); service occupations (11.1%); material moving occupations (10.9%); production occupations (10.2%); architecture and engineering occupations (6.7%); construction, extraction, and maintenance occupations (5.2%)
Most popular occupations of females: management occupations (except farmers) (23.1%); service occupations (21.2%); sales and office occupations (11.3%); healthcare practitioners and technical occupations (9.8%); business and financial operations occupations (8.9%); arts, design, entertainment, sports, and media occupations (7.3%); production occupations (4.2%)
Limited-access highways (interstate or state) in this neighborhood: I- 880.
Roads and streets: 7th St (7th Street); 5th St; 3rd St; Peralta St; Chester St; Henry St; Lewis St; 7th; Wood St; Center St; Bay St; Cedar St; Pine St; Interstate 880 S.
Railroad features: Bay Area Rapid Transit RR; Union Pacific RR.
South Prescott neighborhood detailed profile
Area: 0.201 square miles
Population: 2,435
Population density:
| South Prescott: | 12,090 people per square mile |
| Oakland: | 7,739 people per square mile |
Median household income in 2021:
| South Prescott: | $98,568 |
| Oakland: | $82,236 |
Median rent in in 2021:
| South Prescott: | $847 |
| Oakland: | $1,617 |
Male vs Females
| Males: | 1,296 |
| Females: | 1,139 |
Median age
| Males: | 34.5 years |
| Females: | 36.0 years |
Average estimated value of detached houses in 2021 (32.4% of all units):
| South Prescott: | $748,929 |
| Oakland: | $883,784 |
Most popular occupations of males: sales and office occupations (27.6%); management occupations (except farmers) (12.5%); service occupations (11.1%); material moving occupations (10.9%); production occupations (10.2%); architecture and engineering occupations (6.7%); construction, extraction, and maintenance occupations (5.2%)
Most popular occupations of females: management occupations (except farmers) (23.1%); service occupations (21.2%); sales and office occupations (11.3%); healthcare practitioners and technical occupations (9.8%); business and financial operations occupations (8.9%); arts, design, entertainment, sports, and media occupations (7.3%); production occupations (4.2%)
Limited-access highways (interstate or state) in this neighborhood: I- 880.
Roads and streets: 7th St (7th Street); 5th St; 3rd St; Peralta St; Chester St; Henry St; Lewis St; 7th; Wood St; Center St; Bay St; Cedar St; Pine St; Interstate 880 S.
Railroad features: Bay Area Rapid Transit RR; Union Pacific RR.
South Prescott neighborhood detailed profile
South Stonehurst neighborhood in Oakland statistics: (Find on map)
Area: 0.106 square miles
Population: 685
Population density:
Median household income in 2021:
Median rent in in 2021:
Male vs Females
Median age
Housing prices:
Average estimated value of detached houses in 2021 (60.7% of all units):
Average estimated value of townhouses or other attached units in 2021 (20.2% of all units):
Most popular occupations of males: farming, fishing, and forestry occupations (16.5%); transportation occupations (14.0%); construction, extraction, and maintenance occupations (10.0%); material moving occupations (9.7%); production occupations (7.5%); management occupations (except farmers) (7.0%); service occupations (6.9%)
Most popular occupations of females: service occupations (36.9%); sales and office occupations (34.0%); healthcare practitioners and technical occupations (13.6%); education, training, and library occupations (3.7%); management occupations (except farmers) (3.1%); transportation occupations (2.9%); community and social services occupations (1.6%)
Roads and streets: Pearmain St; Pippin St; Russet St; 105th Ave; 107th Ave; Moorpark St; Gravenstein St; Apple St; Stone St; 100th Ave; Prune St; Blenheim St; 106th Ave; Tartarian St; Douglas Ave.
Railroad features: Union Pacific RR; Bay Area Rapid Transit RR.
South Stonehurst neighborhood detailed profile
Area: 0.106 square miles
Population: 685
Population density:
| South Stonehurst: | 6,462 people per square mile |
| Oakland: | 7,739 people per square mile |
Median household income in 2021:
| South Stonehurst: | $90,114 |
| Oakland: | $82,236 |
Median rent in in 2021:
| South Stonehurst: | $1,358 |
| Oakland: | $1,617 |
Male vs Females
| Males: | 423 |
| Females: | 261 |
Median age
| Males: | 41.3 years |
| Females: | 41.3 years |
Housing prices:
Average estimated value of detached houses in 2021 (60.7% of all units):
| South Stonehurst: | $474,271 |
| Oakland: | $883,784 |
Average estimated value of townhouses or other attached units in 2021 (20.2% of all units):
| This neighborhood: | $433,355 |
| city: | $744,263 |
Most popular occupations of males: farming, fishing, and forestry occupations (16.5%); transportation occupations (14.0%); construction, extraction, and maintenance occupations (10.0%); material moving occupations (9.7%); production occupations (7.5%); management occupations (except farmers) (7.0%); service occupations (6.9%)
Most popular occupations of females: service occupations (36.9%); sales and office occupations (34.0%); healthcare practitioners and technical occupations (13.6%); education, training, and library occupations (3.7%); management occupations (except farmers) (3.1%); transportation occupations (2.9%); community and social services occupations (1.6%)
Roads and streets: Pearmain St; Pippin St; Russet St; 105th Ave; 107th Ave; Moorpark St; Gravenstein St; Apple St; Stone St; 100th Ave; Prune St; Blenheim St; 106th Ave; Tartarian St; Douglas Ave.
Railroad features: Union Pacific RR; Bay Area Rapid Transit RR.
South Stonehurst neighborhood detailed profile
St. Elizabeth neighborhood in Oakland statistics: (Find on map)
Area: 0.250 square miles
Population: 6,211
Population density:
Median household income in 2021:
Median rent in in 2021:
Male vs Females
Median age
Average estimated value of detached houses in 2021 (34.2% of all units):
Most popular occupations of males: construction, extraction, and maintenance occupations (27.2%); sales and office occupations (18.2%); service occupations (15.8%); production occupations (8.2%); material moving occupations (6.7%); transportation occupations (4.4%); management occupations (except farmers) (3.8%)
Most popular occupations of females: service occupations (28.0%); sales and office occupations (23.7%); management occupations (except farmers) (17.2%); education, training, and library occupations (7.5%); material moving occupations (5.6%); community and social services occupations (3.4%); arts, design, entertainment, sports, and media occupations (3.3%)
Roads and streets: E 14th St (International Blvd); 34th Ave; 35th Ave; E 18th St; 33rd Ave; 36th Ave; E 16th St; E 17th St; 42nd Ave; 37th Ave; 38th Ave; 40th Ave; 39th Ave; 41st Ave; 42nd; Foothill; E 15th St; Bridge Ave; Rosedale Ave; Farnam St; 35th.
Other features: Perlata Crk.
St. Elizabeth neighborhood detailed profile
Area: 0.250 square miles
Population: 6,211
Population density:
| St. Elizabeth: | 24,890 people per square mile |
| Oakland: | 7,739 people per square mile |
Median household income in 2021:
| St. Elizabeth: | $53,872 |
| Oakland: | $82,236 |
Median rent in in 2021:
| St. Elizabeth: | $1,394 |
| Oakland: | $1,617 |
Male vs Females
| Males: | 3,034 |
| Females: | 3,176 |
Median age
| Males: | 35.0 years |
| Females: | 35.1 years |
Average estimated value of detached houses in 2021 (34.2% of all units):
| St. Elizabeth: | $635,963 |
| Oakland: | $883,784 |
Most popular occupations of males: construction, extraction, and maintenance occupations (27.2%); sales and office occupations (18.2%); service occupations (15.8%); production occupations (8.2%); material moving occupations (6.7%); transportation occupations (4.4%); management occupations (except farmers) (3.8%)
Most popular occupations of females: service occupations (28.0%); sales and office occupations (23.7%); management occupations (except farmers) (17.2%); education, training, and library occupations (7.5%); material moving occupations (5.6%); community and social services occupations (3.4%); arts, design, entertainment, sports, and media occupations (3.3%)
Roads and streets: E 14th St (International Blvd); 34th Ave; 35th Ave; E 18th St; 33rd Ave; 36th Ave; E 16th St; E 17th St; 42nd Ave; 37th Ave; 38th Ave; 40th Ave; 39th Ave; 41st Ave; 42nd; Foothill; E 15th St; Bridge Ave; Rosedale Ave; Farnam St; 35th.
Other features: Perlata Crk.
St. Elizabeth neighborhood detailed profile
Temescal neighborhood in Oakland statistics: (Find on map)
Area: 0.386 square miles
Population: 5,073
Population density:
Median household income in 2021:
Median rent in in 2021:
Male vs Females
Median age
Housing prices:
Average estimated value of detached houses in 2021 (30.7% of all units):
Average estimated value of townhouses or other attached units in 2021 (4.5% of all units):
Average estimated value of housing units in 2-unit structures in 2021 (6.8% of all units):
Average estimated '21 value of housing units in 3-to-4-unit structures (13.5% of all units):
Average estimated '21 value of housing units in 5-or-more-unit structures (13.1% of all units):
Most popular occupations of males: computer and mathematical occupations (17.7%); service occupations (9.9%); sales and office occupations (9.1%); management occupations (except farmers) (8.8%); education, training, and library occupations (8.5%); architecture and engineering occupations (7.4%); business and financial operations occupations (6.8%)
Most popular occupations of females: sales and office occupations (24.1%); management occupations (except farmers) (14.1%); service occupations (9.3%); business and financial operations occupations (8.4%); computer and mathematical occupations (7.9%); healthcare practitioners and technical occupations (5.8%); life, physical, and social science occupations (5.7%)
Limited-access highways (interstate or state) in this neighborhood: State Hwy 24 (Grove Shafter Fwy).
Roads and streets: 51st St; 42nd St; 45th St; 49th St; 41st St; 51st; 44th St; 43rd St; Shafter Ave; Webster St; Telegraph Ave; Telegraph; Shattuck Ave; 48th St; Manila Ave; 50th St; Lawton Ave; Rich St; Clarke St; 46th St; Shattuck; Opal St; 47th St; Desmond St; Coronado Ave; 52nd St; 52nd; Emerald St.
Railroad features: Bay Area Rapid Transit RR.
Temescal neighborhood detailed profile
Area: 0.386 square miles
Population: 5,073
Population density:
| Temescal: | 13,153 people per square mile |
| Oakland: | 7,739 people per square mile |
Median household income in 2021:
| Temescal: | $129,028 |
| Oakland: | $82,236 |
Median rent in in 2021:
| Temescal: | $2,364 |
| Oakland: | $1,617 |
Male vs Females
| Males: | 2,394 |
| Females: | 2,678 |
Median age
| Males: | 36.7 years |
| Females: | 38.0 years |
Housing prices:
Average estimated value of detached houses in 2021 (30.7% of all units):
| Temescal: | $967,915 |
| Oakland: | $883,784 |
Average estimated value of townhouses or other attached units in 2021 (4.5% of all units):
| This neighborhood: | $1,125,781 |
| city: | $744,263 |
Average estimated value of housing units in 2-unit structures in 2021 (6.8% of all units):
| This neighborhood: | $552,500 |
| Oakland: | $732,452 |
Average estimated '21 value of housing units in 3-to-4-unit structures (13.5% of all units):
| Temescal: | $461,200 |
| city: | $699,145 |
Average estimated '21 value of housing units in 5-or-more-unit structures (13.1% of all units):
| Temescal: | $726,923 |
| Oakland: | $622,418 |
Most popular occupations of males: computer and mathematical occupations (17.7%); service occupations (9.9%); sales and office occupations (9.1%); management occupations (except farmers) (8.8%); education, training, and library occupations (8.5%); architecture and engineering occupations (7.4%); business and financial operations occupations (6.8%)
Most popular occupations of females: sales and office occupations (24.1%); management occupations (except farmers) (14.1%); service occupations (9.3%); business and financial operations occupations (8.4%); computer and mathematical occupations (7.9%); healthcare practitioners and technical occupations (5.8%); life, physical, and social science occupations (5.7%)
Limited-access highways (interstate or state) in this neighborhood: State Hwy 24 (Grove Shafter Fwy).
Roads and streets: 51st St; 42nd St; 45th St; 49th St; 41st St; 51st; 44th St; 43rd St; Shafter Ave; Webster St; Telegraph Ave; Telegraph; Shattuck Ave; 48th St; Manila Ave; 50th St; Lawton Ave; Rich St; Clarke St; 46th St; Shattuck; Opal St; 47th St; Desmond St; Coronado Ave; 52nd St; 52nd; Emerald St.
Railroad features: Bay Area Rapid Transit RR.
Temescal neighborhood detailed profile
Toler Heights neighborhood in Oakland statistics: (Find on map)
Area: 0.410 square miles
Population: 3,636
Population density:
Median household income in 2021:
Median rent in in 2021:
Male vs Females
Median age
Housing prices:
Average estimated value of detached houses in 2021 (57.7% of all units):
Average estimated value of townhouses or other attached units in 2021 (6.7% of all units):
Most popular occupations of males: service occupations (18.9%); management occupations (except farmers) (15.5%); sales and office occupations (9.6%); transportation occupations (9.3%); construction, extraction, and maintenance occupations (9.2%); production occupations (8.3%); arts, design, entertainment, sports, and media occupations (6.5%)
Most popular occupations of females: sales and office occupations (26.6%); service occupations (21.1%); management occupations (except farmers) (11.4%); healthcare practitioners and technical occupations (8.5%); education, training, and library occupations (7.8%); community and social services occupations (5.8%); business and financial operations occupations (4.8%)
Roads and streets: Thermal St; Macarthur; Macarthur Blvd; Burr St; Lawlor St; 98th Ave; Stearns Ave; Anair Way; Seneca St; 98th; 99th Ave; Ec Reems Ct (Alvingroom Ct); Stanley Ave; Cherokee Ave; Thermal; 94th Ave; Taylor Ave; 90th Ave; Farrell St; Las Vegas Ave; Access Rd 23; Cherokee; 88th.
Toler Heights neighborhood detailed profile
Area: 0.410 square miles
Population: 3,636
Population density:
| Toler Heights: | 8,861 people per square mile |
| Oakland: | 7,739 people per square mile |
Median household income in 2021:
| Toler Heights: | $71,574 |
| Oakland: | $82,236 |
Median rent in in 2021:
| Toler Heights: | $1,576 |
| Oakland: | $1,617 |
Male vs Females
| Males: | 1,670 |
| Females: | 1,965 |
Median age
| Males: | 33.2 years |
| Females: | 35.1 years |
Housing prices:
Average estimated value of detached houses in 2021 (57.7% of all units):
| Toler Heights: | $539,699 |
| Oakland: | $883,784 |
Average estimated value of townhouses or other attached units in 2021 (6.7% of all units):
| This neighborhood: | $411,111 |
| city: | $744,263 |
Most popular occupations of males: service occupations (18.9%); management occupations (except farmers) (15.5%); sales and office occupations (9.6%); transportation occupations (9.3%); construction, extraction, and maintenance occupations (9.2%); production occupations (8.3%); arts, design, entertainment, sports, and media occupations (6.5%)
Most popular occupations of females: sales and office occupations (26.6%); service occupations (21.1%); management occupations (except farmers) (11.4%); healthcare practitioners and technical occupations (8.5%); education, training, and library occupations (7.8%); community and social services occupations (5.8%); business and financial operations occupations (4.8%)
Roads and streets: Thermal St; Macarthur; Macarthur Blvd; Burr St; Lawlor St; 98th Ave; Stearns Ave; Anair Way; Seneca St; 98th; 99th Ave; Ec Reems Ct (Alvingroom Ct); Stanley Ave; Cherokee Ave; Thermal; 94th Ave; Taylor Ave; 90th Ave; Farrell St; Las Vegas Ave; Access Rd 23; Cherokee; 88th.
Toler Heights neighborhood detailed profile
Trestle Glen neighborhood in Oakland statistics: (Find on map)
Area: 0.372 square miles
Population: 3,732
Population density:
Median household income in 2021:
Median rent in in 2021:
Male vs Females
Median age
Average estimated value of detached houses in 2021 (71.3% of all units):
Most popular occupations of males: management occupations (except farmers) (25.5%); business and financial operations occupations (12.7%); legal occupations (9.9%); education, training, and library occupations (9.1%); computer and mathematical occupations (8.2%); architecture and engineering occupations (7.4%); service occupations (5.6%)
Most popular occupations of females: management occupations (except farmers) (22.9%); healthcare practitioners and technical occupations (14.0%); service occupations (13.2%); business and financial operations occupations (11.8%); education, training, and library occupations (11.0%); arts, design, entertainment, sports, and media occupations (9.0%); legal occupations (5.1%)
Roads and streets: Trestle Glen Rd; Longridge Rd; Park Blvd; Holman Rd; Rosemount Rd; Grosvenor Pl; Sunnyhills Rd; Santa Ray Ave; Excelsior Ave; Calmar Ave; Greenwood Ave; Mandana Blvd; Hillcroft Cir; Lakeshore Ave; Bates Rd; Brookwood Rd; Alma Pl; Barrows Rd; Lakeshore; Northvale Rd; Park Blvd Way; Chatham Rd; Lake Park Ave; 13th Ave; Balfour Ave; Emerson St; Paloma Ave; Wesley Way; Creed Rd; Kingsley St; Larkspur; Larkspur Rd; Brighton Ave; Haddon Pl; Viona Ave; Brookwood Pl; Verrada Rd; Hampel St.
Trestle Glen neighborhood detailed profile
Area: 0.372 square miles
Population: 3,732
Population density:
| Trestle Glen: | 10,033 people per square mile |
| Oakland: | 7,739 people per square mile |
Median household income in 2021:
| Trestle Glen: | $157,284 |
| Oakland: | $82,236 |
Median rent in in 2021:
| Trestle Glen: | $1,631 |
| Oakland: | $1,617 |
Male vs Females
| Males: | 1,702 |
| Females: | 2,029 |
Median age
| Males: | 43.3 years |
| Females: | 42.9 years |
Average estimated value of detached houses in 2021 (71.3% of all units):
| Trestle Glen: | $1,482,869 |
| Oakland: | $883,784 |
Most popular occupations of males: management occupations (except farmers) (25.5%); business and financial operations occupations (12.7%); legal occupations (9.9%); education, training, and library occupations (9.1%); computer and mathematical occupations (8.2%); architecture and engineering occupations (7.4%); service occupations (5.6%)
Most popular occupations of females: management occupations (except farmers) (22.9%); healthcare practitioners and technical occupations (14.0%); service occupations (13.2%); business and financial operations occupations (11.8%); education, training, and library occupations (11.0%); arts, design, entertainment, sports, and media occupations (9.0%); legal occupations (5.1%)
Roads and streets: Trestle Glen Rd; Longridge Rd; Park Blvd; Holman Rd; Rosemount Rd; Grosvenor Pl; Sunnyhills Rd; Santa Ray Ave; Excelsior Ave; Calmar Ave; Greenwood Ave; Mandana Blvd; Hillcroft Cir; Lakeshore Ave; Bates Rd; Brookwood Rd; Alma Pl; Barrows Rd; Lakeshore; Northvale Rd; Park Blvd Way; Chatham Rd; Lake Park Ave; 13th Ave; Balfour Ave; Emerson St; Paloma Ave; Wesley Way; Creed Rd; Kingsley St; Larkspur; Larkspur Rd; Brighton Ave; Haddon Pl; Viona Ave; Brookwood Pl; Verrada Rd; Hampel St.
Trestle Glen neighborhood detailed profile
Tuxedo neighborhood in Oakland statistics: (Find on map)
Area: 0.124 square miles
Population: 2,396
Population density:
Median household income in 2021:
Median rent in in 2021:
Male vs Females
Median age
Average estimated value of detached houses in 2021 (21.2% of all units):
Most popular occupations of males: service occupations (36.7%); transportation occupations (16.6%); production occupations (9.5%); sales and office occupations (8.4%); material moving occupations (7.6%); construction, extraction, and maintenance occupations (6.6%); healthcare practitioners and technical occupations (3.7%)
Most popular occupations of females: service occupations (33.4%); sales and office occupations (19.6%); arts, design, entertainment, sports, and media occupations (7.3%); business and financial operations occupations (6.5%); education, training, and library occupations (6.3%); management occupations (except farmers) (6.2%); healthcare practitioners and technical occupations (6.0%)
Roads and streets: 22nd Ave; E 28th St; 23rd; 23rd Ave; E 29th St; E 27th St; 21st Ave; Wallace St; 19th Ave; E 30th St; E 32nd St; Ardley; Ardley Ave; E 31st St; E 33rd St; 21st; Randolph Ave; Palmer Ave; Hamline Ave; E 27th.
Tuxedo neighborhood detailed profile
Area: 0.124 square miles
Population: 2,396
Population density:
| Tuxedo: | 19,335 people per square mile |
| Oakland: | 7,739 people per square mile |
Median household income in 2021:
| Tuxedo: | $61,975 |
| Oakland: | $82,236 |
Median rent in in 2021:
| Tuxedo: | $1,345 |
| Oakland: | $1,617 |
Male vs Females
| Males: | 1,201 |
| Females: | 1,195 |
Median age
| Males: | 36.7 years |
| Females: | 34.9 years |
Average estimated value of detached houses in 2021 (21.2% of all units):
| Tuxedo: | $727,083 |
| Oakland: | $883,784 |
Most popular occupations of males: service occupations (36.7%); transportation occupations (16.6%); production occupations (9.5%); sales and office occupations (8.4%); material moving occupations (7.6%); construction, extraction, and maintenance occupations (6.6%); healthcare practitioners and technical occupations (3.7%)
Most popular occupations of females: service occupations (33.4%); sales and office occupations (19.6%); arts, design, entertainment, sports, and media occupations (7.3%); business and financial operations occupations (6.5%); education, training, and library occupations (6.3%); management occupations (except farmers) (6.2%); healthcare practitioners and technical occupations (6.0%)
Roads and streets: 22nd Ave; E 28th St; 23rd; 23rd Ave; E 29th St; E 27th St; 21st Ave; Wallace St; 19th Ave; E 30th St; E 32nd St; Ardley; Ardley Ave; E 31st St; E 33rd St; 21st; Randolph Ave; Palmer Ave; Hamline Ave; E 27th.
Tuxedo neighborhood detailed profile
Upper Dimond neighborhood in Oakland statistics: (Find on map)
Area: 0.300 square miles
Population: 3,741
Population density:
Median household income in 2021:
Median rent in in 2021:
Male vs Females
Median age
Average estimated value of detached houses in 2021 (56.2% of all units):
Most popular occupations of males: management occupations (except farmers) (20.8%); production occupations (18.6%); sales and office occupations (16.1%); arts, design, entertainment, sports, and media occupations (6.7%); service occupations (4.8%); healthcare practitioners and technical occupations (4.7%); business and financial operations occupations (3.8%)
Most popular occupations of females: service occupations (21.7%); management occupations (except farmers) (13.5%); sales and office occupations (11.9%); production occupations (9.8%); business and financial operations occupations (8.3%); community and social services occupations (7.2%); healthcare practitioners and technical occupations (7.1%)
Roads and streets: Macarthur Blvd; Madeline St; Damuth St; Laguna Ave; California St; Maple Ave; Lincoln Ave; Laurel Ave; Florida St; Rhoda Ave; Arizona St; Coolidge Ave; Coloma St; Scenic Ave; Dimond Ave; Hearst Ave; Fruitvale Ave; Kansas St; Boston Ave; Wilson Ave; Hillview St; Coolidge Ct; Whittle Ave; Whittle Ct; Hopkins Pl.
Upper Dimond neighborhood detailed profile
Area: 0.300 square miles
Population: 3,741
Population density:
| Upper Dimond: | 12,466 people per square mile |
| Oakland: | 7,739 people per square mile |
Median household income in 2021:
| Upper Dimond: | $117,482 |
| Oakland: | $82,236 |
Median rent in in 2021:
| Upper Dimond: | $1,402 |
| Oakland: | $1,617 |
Male vs Females
| Males: | 1,882 |
| Females: | 1,858 |
Median age
| Males: | 41.2 years |
| Females: | 49.8 years |
Average estimated value of detached houses in 2021 (56.2% of all units):
| Upper Dimond: | $974,402 |
| Oakland: | $883,784 |
Most popular occupations of males: management occupations (except farmers) (20.8%); production occupations (18.6%); sales and office occupations (16.1%); arts, design, entertainment, sports, and media occupations (6.7%); service occupations (4.8%); healthcare practitioners and technical occupations (4.7%); business and financial operations occupations (3.8%)
Most popular occupations of females: service occupations (21.7%); management occupations (except farmers) (13.5%); sales and office occupations (11.9%); production occupations (9.8%); business and financial operations occupations (8.3%); community and social services occupations (7.2%); healthcare practitioners and technical occupations (7.1%)
Roads and streets: Macarthur Blvd; Madeline St; Damuth St; Laguna Ave; California St; Maple Ave; Lincoln Ave; Laurel Ave; Florida St; Rhoda Ave; Arizona St; Coolidge Ave; Coloma St; Scenic Ave; Dimond Ave; Hearst Ave; Fruitvale Ave; Kansas St; Boston Ave; Wilson Ave; Hillview St; Coolidge Ct; Whittle Ave; Whittle Ct; Hopkins Pl.
Upper Dimond neighborhood detailed profile
Upper Laurel neighborhood in Oakland statistics: (Find on map)
Area: 0.387 square miles
Population: 5,276
Population density:
Median household income in 2021:
Median rent in in 2021:
Male vs Females
Median age
Housing prices:
Average estimated value of detached houses in 2021 (55.2% of all units):
Average estimated value of townhouses or other attached units in 2021 (5.9% of all units):
Average estimated '21 value of housing units in 3-to-4-unit structures (17.5% of all units):
Average estimated '21 value of housing units in 5-or-more-unit structures (5.1% of all units):
Most popular occupations of males: transportation occupations (15.5%); management occupations (except farmers) (13.2%); sales and office occupations (12.8%); business and financial operations occupations (10.6%); education, training, and library occupations (9.5%); computer and mathematical occupations (5.6%); material moving occupations (5.3%)
Most popular occupations of females: sales and office occupations (18.6%); management occupations (except farmers) (16.4%); business and financial operations occupations (11.6%); education, training, and library occupations (10.6%); service occupations (9.0%); healthcare practitioners and technical occupations (8.1%); life, physical, and social science occupations (7.4%)
Limited-access highways (interstate or state) in this neighborhood: I- 580.
Roads and streets: Macarthur Blvd; 35th Ave; Kansas St; Masterson St; Madrone Ave; California St; High St; Steele St; Midvale Ave; Patterson Ave; Tompkins Ave; Enos Ave; Loma Vista Ave; Magee Ave; Tulip Ave; 38th Ave; Brown Ave; Buell St; Pampas Ave; Calaveras Ave; Greenacre Rd (Green Acre Rd); Hyacinth Ave; Huntington St; Lily St; Albert St; Merrill Ave; Daisy St; McClelland St; Arizona St; Worden Way; Siesta Ct; Interstate 580 E; Maybelle Ave; Florida St; 39th Ave; Macarthur.
Other features: Perlata Crk.
Upper Laurel neighborhood detailed profile
Area: 0.387 square miles
Population: 5,276
Population density:
| Upper Laurel: | 13,642 people per square mile |
| Oakland: | 7,739 people per square mile |
Median household income in 2021:
| Upper Laurel: | $101,325 |
| Oakland: | $82,236 |
Median rent in in 2021:
| Upper Laurel: | $1,780 |
| Oakland: | $1,617 |
Male vs Females
| Males: | 2,617 |
| Females: | 2,659 |
Median age
| Males: | 39.1 years |
| Females: | 40.1 years |
Housing prices:
Average estimated value of detached houses in 2021 (55.2% of all units):
| Upper Laurel: | $463,609 |
| Oakland: | $883,784 |
Average estimated value of townhouses or other attached units in 2021 (5.9% of all units):
| This neighborhood: | $515,000 |
| city: | $744,263 |
Average estimated '21 value of housing units in 3-to-4-unit structures (17.5% of all units):
| Upper Laurel: | $517,200 |
| city: | $699,145 |
Average estimated '21 value of housing units in 5-or-more-unit structures (5.1% of all units):
| Upper Laurel: | $493,534 |
| Oakland: | $622,418 |
Most popular occupations of males: transportation occupations (15.5%); management occupations (except farmers) (13.2%); sales and office occupations (12.8%); business and financial operations occupations (10.6%); education, training, and library occupations (9.5%); computer and mathematical occupations (5.6%); material moving occupations (5.3%)
Most popular occupations of females: sales and office occupations (18.6%); management occupations (except farmers) (16.4%); business and financial operations occupations (11.6%); education, training, and library occupations (10.6%); service occupations (9.0%); healthcare practitioners and technical occupations (8.1%); life, physical, and social science occupations (7.4%)
Limited-access highways (interstate or state) in this neighborhood: I- 580.
Roads and streets: Macarthur Blvd; 35th Ave; Kansas St; Masterson St; Madrone Ave; California St; High St; Steele St; Midvale Ave; Patterson Ave; Tompkins Ave; Enos Ave; Loma Vista Ave; Magee Ave; Tulip Ave; 38th Ave; Brown Ave; Buell St; Pampas Ave; Calaveras Ave; Greenacre Rd (Green Acre Rd); Hyacinth Ave; Huntington St; Lily St; Albert St; Merrill Ave; Daisy St; McClelland St; Arizona St; Worden Way; Siesta Ct; Interstate 580 E; Maybelle Ave; Florida St; 39th Ave; Macarthur.
Other features: Perlata Crk.
Upper Laurel neighborhood detailed profile
Upper Peralta Creek neighborhood in Oakland statistics: (Find on map)
Area: 0.190 square miles
Population: 4,567
Population density:
Median household income in 2021:
Median rent in in 2021:
Male vs Females
Median age
Average estimated value of detached houses in 2021 (34.7% of all units):
Most popular occupations of males: service occupations (26.6%); sales and office occupations (25.3%); construction, extraction, and maintenance occupations (9.0%); healthcare practitioners and technical occupations (6.1%); material moving occupations (5.8%); production occupations (5.4%); education, training, and library occupations (3.7%)
Most popular occupations of females: service occupations (25.4%); sales and office occupations (17.6%); education, training, and library occupations (11.5%); business and financial operations occupations (8.5%); management occupations (except farmers) (7.7%); healthcare practitioners and technical occupations (6.6%); computer and mathematical occupations (4.9%)
Limited-access highways (interstate or state) in this neighborhood: I- 580.
Roads and streets: 35th Ave; Suter St; School St; Maple Ave; Humboldt Ave; Bartlett St; Pleitner Ave; Curran Ave; Interstate 580 E; Arkansas St; Berlin Way; Nicol Ave; Brookdale Ave; Texas St; Laurel Ave; Penniman Ave; 35th; Ward Ln; Arkansas; Curran.
Other features: Perlata Crk.
Upper Peralta Creek neighborhood detailed profile
Area: 0.190 square miles
Population: 4,567
Population density:
| Upper Peralta Creek: | 24,058 people per square mile |
| Oakland: | 7,739 people per square mile |
Median household income in 2021:
| Upper Peralta Creek: | $80,547 |
| Oakland: | $82,236 |
Median rent in in 2021:
| Upper Peralta Creek: | $1,561 |
| Oakland: | $1,617 |
Male vs Females
| Males: | 2,191 |
| Females: | 2,375 |
Median age
| Males: | 36.5 years |
| Females: | 33.2 years |
Average estimated value of detached houses in 2021 (34.7% of all units):
| Upper Peralta Creek: | $439,512 |
| Oakland: | $883,784 |
Most popular occupations of males: service occupations (26.6%); sales and office occupations (25.3%); construction, extraction, and maintenance occupations (9.0%); healthcare practitioners and technical occupations (6.1%); material moving occupations (5.8%); production occupations (5.4%); education, training, and library occupations (3.7%)
Most popular occupations of females: service occupations (25.4%); sales and office occupations (17.6%); education, training, and library occupations (11.5%); business and financial operations occupations (8.5%); management occupations (except farmers) (7.7%); healthcare practitioners and technical occupations (6.6%); computer and mathematical occupations (4.9%)
Limited-access highways (interstate or state) in this neighborhood: I- 580.
Roads and streets: 35th Ave; Suter St; School St; Maple Ave; Humboldt Ave; Bartlett St; Pleitner Ave; Curran Ave; Interstate 580 E; Arkansas St; Berlin Way; Nicol Ave; Brookdale Ave; Texas St; Laurel Ave; Penniman Ave; 35th; Ward Ln; Arkansas; Curran.
Other features: Perlata Crk.
Upper Peralta Creek neighborhood detailed profile
Upper Rockridge neighborhood in Oakland statistics: (Find on map)
Area: 1.129 square miles
Population: 6,301
Population density:
Median household income in 2021:
Median rent in in 2021:
Male vs Females
Median age
Housing prices:
Average estimated value of detached houses in 2021 (86.9% of all units):
Average estimated '21 value of housing units in 5-or-more-unit structures (2.6% of all units):
Most popular occupations of males: management occupations (except farmers) (26.9%); business and financial operations occupations (12.6%); sales and office occupations (12.5%); computer and mathematical occupations (8.9%); legal occupations (8.2%); healthcare practitioners and technical occupations (7.8%); architecture and engineering occupations (4.5%)
Most popular occupations of females: management occupations (except farmers) (25.1%); business and financial operations occupations (16.1%); healthcare practitioners and technical occupations (13.7%); sales and office occupations (10.8%); education, training, and library occupations (10.6%); service occupations (4.6%); life, physical, and social science occupations (4.5%)
Limited-access highways (interstate or state) in this neighborhood: State Hwy 13 (Warren Fwy); State Hwy 24 (Grove Shafter Fwy); State Hwy 24.
Highways in this neighborhood: Tunnel Rd (State Hwy 13).
Roads and streets: Broadway Ter; Harbord Dr; Broadway; Golden Gate Ave; Florence Ave; Buena Vista Ave; Proctor Ave; Margarido Dr; Acacia Ave; Ocean View Dr; Contra Costa Rd; Chabot Rd; Sheridan Rd; Masonic Ave; Estates Dr; Romany Rd; Brookside Ave; Hermosa Ave; Beechwood Dr; Cochrane Ave; Mandalay Rd; Amy Dr; Buckeye Ave; Modoc Ave; Hilltop Cres; Cross Rd; Sonia St; Monroe Ave; Manchester Dr; Country Club Dr; Manila Ave; Agnes St; Roble Rd; Mendocino Ave; Rockridge Blvd S; Wilding Ln; Westminster Dr; Morpeth St; Maxwelton Rd; Alta Rd; Ostrander Rd; Thomas Ave; Clarewood Dr; Bowling Dr; Rockridge Blvd; Lincolnshire Dr; St Paul Ct; Mathieu Ave; Prospect Steps; Heron Dr; Clarewood Ln; Dulwich; Hill Rd; Glenbrook Dr; N Rockridge Blvd; Jacobus Ave; Templar Pl; Alpine Ter; Contra Costa; Chaumont Path; Elrod Ave; Belgrave Pl; Templar; Locarno Path; Lawton Ave; Stark Knoll Pl; Belap Path; Morrill Ct; Eustice Ave; Carlton St; East Ln; Dulwich Rd; Verona Path; Marguerite Dr; Yorkshire Dr; West Ln; Reata Pl; Norman Ln; Erba Path; Arbon Path; Pine Ln; Julia St; Novara Rd; Harbord Ct; Buena Vista Ave (Doyle St); Biehs Ct; Napa St; Masonic Pl; Rotundo Path; Buena Vista Pl; Contra Costa Pl; Andeer Path; Golden Gate Way; Canyon View Ln; Taft Ave; Rockridge Pl; Marie Way; Morrell Ln; Gonda (Hill Rd).
Railroad features: Bay Area Rapid Transit RR.
Upper Rockridge neighborhood detailed profile
Area: 1.129 square miles
Population: 6,301
Population density:
| Upper Rockridge: | 5,580 people per square mile |
| Oakland: | 7,739 people per square mile |
Median household income in 2021:
| Upper Rockridge: | $211,113 |
| Oakland: | $82,236 |
Median rent in in 2021:
| Upper Rockridge: | $3,169 |
| Oakland: | $1,617 |
Male vs Females
| Males: | 3,147 |
| Females: | 3,154 |
Median age
| Males: | 45.7 years |
| Females: | 47.1 years |
Housing prices:
Average estimated value of detached houses in 2021 (86.9% of all units):
| Upper Rockridge: | $1,487,211 |
| Oakland: | $883,784 |
Average estimated '21 value of housing units in 5-or-more-unit structures (2.6% of all units):
| Upper Rockridge: | $693,962 |
| Oakland: | $622,418 |
Most popular occupations of males: management occupations (except farmers) (26.9%); business and financial operations occupations (12.6%); sales and office occupations (12.5%); computer and mathematical occupations (8.9%); legal occupations (8.2%); healthcare practitioners and technical occupations (7.8%); architecture and engineering occupations (4.5%)
Most popular occupations of females: management occupations (except farmers) (25.1%); business and financial operations occupations (16.1%); healthcare practitioners and technical occupations (13.7%); sales and office occupations (10.8%); education, training, and library occupations (10.6%); service occupations (4.6%); life, physical, and social science occupations (4.5%)
Limited-access highways (interstate or state) in this neighborhood: State Hwy 13 (Warren Fwy); State Hwy 24 (Grove Shafter Fwy); State Hwy 24.
Highways in this neighborhood: Tunnel Rd (State Hwy 13).
Roads and streets: Broadway Ter; Harbord Dr; Broadway; Golden Gate Ave; Florence Ave; Buena Vista Ave; Proctor Ave; Margarido Dr; Acacia Ave; Ocean View Dr; Contra Costa Rd; Chabot Rd; Sheridan Rd; Masonic Ave; Estates Dr; Romany Rd; Brookside Ave; Hermosa Ave; Beechwood Dr; Cochrane Ave; Mandalay Rd; Amy Dr; Buckeye Ave; Modoc Ave; Hilltop Cres; Cross Rd; Sonia St; Monroe Ave; Manchester Dr; Country Club Dr; Manila Ave; Agnes St; Roble Rd; Mendocino Ave; Rockridge Blvd S; Wilding Ln; Westminster Dr; Morpeth St; Maxwelton Rd; Alta Rd; Ostrander Rd; Thomas Ave; Clarewood Dr; Bowling Dr; Rockridge Blvd; Lincolnshire Dr; St Paul Ct; Mathieu Ave; Prospect Steps; Heron Dr; Clarewood Ln; Dulwich; Hill Rd; Glenbrook Dr; N Rockridge Blvd; Jacobus Ave; Templar Pl; Alpine Ter; Contra Costa; Chaumont Path; Elrod Ave; Belgrave Pl; Templar; Locarno Path; Lawton Ave; Stark Knoll Pl; Belap Path; Morrill Ct; Eustice Ave; Carlton St; East Ln; Dulwich Rd; Verona Path; Marguerite Dr; Yorkshire Dr; West Ln; Reata Pl; Norman Ln; Erba Path; Arbon Path; Pine Ln; Julia St; Novara Rd; Harbord Ct; Buena Vista Ave (Doyle St); Biehs Ct; Napa St; Masonic Pl; Rotundo Path; Buena Vista Pl; Contra Costa Pl; Andeer Path; Golden Gate Way; Canyon View Ln; Taft Ave; Rockridge Pl; Marie Way; Morrell Ln; Gonda (Hill Rd).
Railroad features: Bay Area Rapid Transit RR.
Upper Rockridge neighborhood detailed profile
Uptown neighborhood in Oakland statistics: (Find on map)
Area: 0.037 square miles
Roads and streets: Telegraph Ave; Telegraph; 20th St.
Uptown neighborhood detailed profile
Area: 0.037 square miles
Roads and streets: Telegraph Ave; Telegraph; 20th St.
Uptown neighborhood detailed profile
Waterfront Warehouse District neighborhood in Oakland statistics: (Find on map)
Area: 0.066 square miles
Limited-access highways (interstate or state) in this neighborhood: Webster St Tube (State Hwy 61).
Roads and streets: 4th St; 2nd St; 5th St; 3rd St; Alice St; Posey Tube (State Rte 260, Harrison St); Franklin St; Harrison St.
Railroad features: Union Pacific RR.
Waterfront Warehouse District neighborhood detailed profile
Waverly neighborhood in Oakland statistics: (Find on map)
Area: 0.061 square miles
Population: 1,076
Population density:
Median household income in 2021:
Median rent in in 2021:
Male vs Females
Median age
Most popular occupations of males: sales and office occupations (23.8%); management occupations (except farmers) (18.1%); computer and mathematical occupations (15.3%); service occupations (8.7%); arts, design, entertainment, sports, and media occupations (8.3%); business and financial operations occupations (4.8%); construction, extraction, and maintenance occupations (4.4%)
Most popular occupations of females: management occupations (except farmers) (27.4%); sales and office occupations (16.8%); service occupations (16.4%); business and financial operations occupations (15.7%); education, training, and library occupations (7.7%); computer and mathematical occupations (5.1%); life, physical, and social science occupations (3.6%)
Roads and streets: Broadway; 23rd St; 24th St; Kaiser Plz (Valdez St); Webster St; Harrison St; 26th St; Waverly St; 25th St; Harrison.
Waverly neighborhood detailed profile
Area: 0.061 square miles
Population: 1,076
Population density:
| Waverly: | 17,635 people per square mile |
| Oakland: | 7,739 people per square mile |
Median household income in 2021:
| Waverly: | $115,313 |
| Oakland: | $82,236 |
Median rent in in 2021:
| Waverly: | $1,746 |
| Oakland: | $1,617 |
Male vs Females
| Males: | 538 |
| Females: | 538 |
Median age
| Males: | 36.1 years |
| Females: | 33.6 years |
Most popular occupations of males: sales and office occupations (23.8%); management occupations (except farmers) (18.1%); computer and mathematical occupations (15.3%); service occupations (8.7%); arts, design, entertainment, sports, and media occupations (8.3%); business and financial operations occupations (4.8%); construction, extraction, and maintenance occupations (4.4%)
Most popular occupations of females: management occupations (except farmers) (27.4%); sales and office occupations (16.8%); service occupations (16.4%); business and financial operations occupations (15.7%); education, training, and library occupations (7.7%); computer and mathematical occupations (5.1%); life, physical, and social science occupations (3.6%)
Roads and streets: Broadway; 23rd St; 24th St; Kaiser Plz (Valdez St); Webster St; Harrison St; 26th St; Waverly St; 25th St; Harrison.
Waverly neighborhood detailed profile
Webster neighborhood in Oakland statistics: (Find on map)
Area: 0.274 square miles
Population: 4,530
Population density:
Median household income in 2021:
Median rent in in 2021:
Male vs Females
Median age
Average estimated value of detached houses in 2021 (46.5% of all units):
Most popular occupations of males: construction, extraction, and maintenance occupations (24.2%); transportation occupations (20.4%); service occupations (13.1%); sales and office occupations (12.1%); computer and mathematical occupations (7.3%); production occupations (6.5%); material moving occupations (4.1%)
Most popular occupations of females: service occupations (49.7%); sales and office occupations (21.2%); management occupations (except farmers) (6.8%); production occupations (5.5%); arts, design, entertainment, sports, and media occupations (3.0%); healthcare practitioners and technical occupations (3.0%); business and financial operations occupations (2.7%)
Highways in this neighborhood: State Hwy 185 (International Blvd, E 14th St).
Roads and streets: 83rd Ave; 89th Ave; 87th Ave; 88th Ave; 85th Ave; 84th Ave; 86th Ave; Auseon Ave; Holly St; Birch St; International Blvd; Olive St; 90th Ave; Plymouth St; 90th; Holly.
Webster neighborhood detailed profile
Area: 0.274 square miles
Population: 4,530
Population density:
| Webster: | 16,508 people per square mile |
| Oakland: | 7,739 people per square mile |
Median household income in 2021:
| Webster: | $44,697 |
| Oakland: | $82,236 |
Median rent in in 2021:
| Webster: | $1,239 |
| Oakland: | $1,617 |
Male vs Females
| Males: | 2,272 |
| Females: | 2,257 |
Median age
| Males: | 32.0 years |
| Females: | 32.8 years |
Average estimated value of detached houses in 2021 (46.5% of all units):
| Webster: | $427,312 |
| Oakland: | $883,784 |
Most popular occupations of males: construction, extraction, and maintenance occupations (24.2%); transportation occupations (20.4%); service occupations (13.1%); sales and office occupations (12.1%); computer and mathematical occupations (7.3%); production occupations (6.5%); material moving occupations (4.1%)
Most popular occupations of females: service occupations (49.7%); sales and office occupations (21.2%); management occupations (except farmers) (6.8%); production occupations (5.5%); arts, design, entertainment, sports, and media occupations (3.0%); healthcare practitioners and technical occupations (3.0%); business and financial operations occupations (2.7%)
Highways in this neighborhood: State Hwy 185 (International Blvd, E 14th St).
Roads and streets: 83rd Ave; 89th Ave; 87th Ave; 88th Ave; 85th Ave; 84th Ave; 86th Ave; Auseon Ave; Holly St; Birch St; International Blvd; Olive St; 90th Ave; Plymouth St; 90th; Holly.
Webster neighborhood detailed profile
West Oakland neighborhood in Oakland statistics: (Find on map)
Area: 6.497 square miles
Population: 45,086
Population density:
Median household income in 2021:
Median rent in in 2021:
Male vs Females
Median age
Housing prices:
Average estimated value of detached houses in 2021 (23.4% of all units):
Average estimated value of townhouses or other attached units in 2021 (8.8% of all units):
Average estimated value of housing units in 2-unit structures in 2021 (14.8% of all units):
Average estimated '21 value of housing units in 5-or-more-unit structures (17.4% of all units):
Most popular occupations of males: sales and office occupations (15.9%); service occupations (14.4%); management occupations (except farmers) (12.7%); transportation occupations (7.6%); computer and mathematical occupations (7.3%); arts, design, entertainment, sports, and media occupations (6.9%); construction, extraction, and maintenance occupations (6.3%)
Most popular occupations of females: service occupations (22.3%); sales and office occupations (17.2%); management occupations (except farmers) (15.9%); business and financial operations occupations (9.3%); education, training, and library occupations (8.0%); arts, design, entertainment, sports, and media occupations (5.1%); healthcare practitioners and technical occupations (4.8%)
Limited-access highways (interstate or state) in this neighborhood: I- 880; I- 980 (Grove Shafter Fwy); I- 580; I- 80.
Roads and streets: 7th St; Middle Harbor; Mandela Pkwy (Cypress St); Market St; 14th St; W Grand Ave; Peralta St; 12th St; Larson St (10th St); Adeline St; Middle Harbor Rd; Martin Luther King Jr Way; 8th St; 5th St; Adeline; 3rd St; 7th; Maritime St; Wood St; Union St; 34th St; 16th St; Chestnut St; 18th St; Filbert St; 14th; West St; 32nd St; Castro St; 21st St; Campbell St; Magnolia St; Brush St; 17th St; 26th St; Linden St (Embarcadero); Embarcadero W (1st St); W Grand; 28th St; San Pablo Ave; Market; Myrtle St (Embarcadero); Terminal St; 30th St; 11th St (Andrew Way); Poplar St; Burma Rd; 12th; Willow St; 24th St; 4th St; 15th St; Tulagi St; Gang Way; San Pablo; 16th; 8th; Army Base; Peralta; 35th St; Murmansk St; Destroyer Way; 19th St; 15th; 1st St; Commodore Way; 18th; 20th St; Wake Ave; 13th St; Ferry St; Interstate 880 N; Center St; Boatswain Way; Executive Way; 31st St; Bay Pl (27th St); 29th St; 2nd St; 6th St; Kirkham St; Poplar; Engineer Rd; (Interstate 580); 9th; 9th St; Moorship Ave; Shellmound St; Tobruk St; Chester St; 33rd St; Brockhurst St; Hull Way; Inventory Ave; Keel Way; Logistics Ln; Warehouse Rd; Pine St; Corregidor Ave; Village Cir; Embarcadero (Magnolia St); 11th; Algiers St; Pier St; 3rd; E H; 10th; Ettie St; West; Northgate; Hannah St; 23rd St; Fleet Way; Cedar St; Anchor St (Anchor Way); Midway St; 22nd St; Ferro St; Martin Luther King Jr; Freight St; Henry St; Northgate Ave; Helen St; Petroleum St; Ferry; Africa St; 27th; Sycamore St; Grove St (Martin Luther King Jr Way); Telegraph Ave; Bataan Ave; Yerba Buena Ave; Louise St; Athens Ave; Terminal; Mead Ave; Jefferson St; Goss St; Hollis St; 6th; E E; Alaska St; Mandela Pkwy; Isabella St; Beach St; Lewis St; 25th St; 20th; Navy Roadway; Halleck St; Urkraine St; Chase St; 36th St; Inventory; Campbell Village Ct; Milton St; Curtis St; 13th; Buna St; Chungking St; 5th; Poplar Ct (Poplar Way); Kirkham Ct (Kirkham St); Attu St; Haven St; Chestnut Ct (Chestnut St); Dolphin St; Covent Ln; 26th; Motor Pool Way; Horton St; Interstate 880 S; Alicia St; Bay St; Moss Ln; Fitzgerald St; Ambler Ln; Transit St; Maritime; McElroy St; Foot of Wood (Wood St); Ealing Ln; Interstate 980 E; Tobruk; 40th; Baku St; Center; Harlan St; Park Ave; I- 80 E; 4th; Shorey St; Orient St; Surryhne St; Hubbard St; Cypress; Palm Ct; Merrimac St; 17th; 30th.
Railroad features: Union Pacific RR; Bay Area Rapid Transit RR.
West Oakland neighborhood detailed profile
Area: 6.497 square miles
Population: 45,086
Population density:
| West Oakland: | 6,939 people per square mile |
| Oakland: | 7,739 people per square mile |
Median household income in 2021:
| West Oakland: | $83,164 |
| Oakland: | $82,236 |
Median rent in in 2021:
| West Oakland: | $1,512 |
| Oakland: | $1,617 |
Male vs Females
| Males: | 22,566 |
| Females: | 22,519 |
Median age
| Males: | 34.3 years |
| Females: | 34.8 years |
Housing prices:
Average estimated value of detached houses in 2021 (23.4% of all units):
| West Oakland: | $811,649 |
| Oakland: | $883,784 |
Average estimated value of townhouses or other attached units in 2021 (8.8% of all units):
| This neighborhood: | $696,809 |
| city: | $744,263 |
Average estimated value of housing units in 2-unit structures in 2021 (14.8% of all units):
| This neighborhood: | $575,000 |
| Oakland: | $732,452 |
Average estimated '21 value of housing units in 5-or-more-unit structures (17.4% of all units):
| West Oakland: | $349,500 |
| Oakland: | $622,418 |
Most popular occupations of males: sales and office occupations (15.9%); service occupations (14.4%); management occupations (except farmers) (12.7%); transportation occupations (7.6%); computer and mathematical occupations (7.3%); arts, design, entertainment, sports, and media occupations (6.9%); construction, extraction, and maintenance occupations (6.3%)
Most popular occupations of females: service occupations (22.3%); sales and office occupations (17.2%); management occupations (except farmers) (15.9%); business and financial operations occupations (9.3%); education, training, and library occupations (8.0%); arts, design, entertainment, sports, and media occupations (5.1%); healthcare practitioners and technical occupations (4.8%)
Limited-access highways (interstate or state) in this neighborhood: I- 880; I- 980 (Grove Shafter Fwy); I- 580; I- 80.
Roads and streets: 7th St; Middle Harbor; Mandela Pkwy (Cypress St); Market St; 14th St; W Grand Ave; Peralta St; 12th St; Larson St (10th St); Adeline St; Middle Harbor Rd; Martin Luther King Jr Way; 8th St; 5th St; Adeline; 3rd St; 7th; Maritime St; Wood St; Union St; 34th St; 16th St; Chestnut St; 18th St; Filbert St; 14th; West St; 32nd St; Castro St; 21st St; Campbell St; Magnolia St; Brush St; 17th St; 26th St; Linden St (Embarcadero); Embarcadero W (1st St); W Grand; 28th St; San Pablo Ave; Market; Myrtle St (Embarcadero); Terminal St; 30th St; 11th St (Andrew Way); Poplar St; Burma Rd; 12th; Willow St; 24th St; 4th St; 15th St; Tulagi St; Gang Way; San Pablo; 16th; 8th; Army Base; Peralta; 35th St; Murmansk St; Destroyer Way; 19th St; 15th; 1st St; Commodore Way; 18th; 20th St; Wake Ave; 13th St; Ferry St; Interstate 880 N; Center St; Boatswain Way; Executive Way; 31st St; Bay Pl (27th St); 29th St; 2nd St; 6th St; Kirkham St; Poplar; Engineer Rd; (Interstate 580); 9th; 9th St; Moorship Ave; Shellmound St; Tobruk St; Chester St; 33rd St; Brockhurst St; Hull Way; Inventory Ave; Keel Way; Logistics Ln; Warehouse Rd; Pine St; Corregidor Ave; Village Cir; Embarcadero (Magnolia St); 11th; Algiers St; Pier St; 3rd; E H; 10th; Ettie St; West; Northgate; Hannah St; 23rd St; Fleet Way; Cedar St; Anchor St (Anchor Way); Midway St; 22nd St; Ferro St; Martin Luther King Jr; Freight St; Henry St; Northgate Ave; Helen St; Petroleum St; Ferry; Africa St; 27th; Sycamore St; Grove St (Martin Luther King Jr Way); Telegraph Ave; Bataan Ave; Yerba Buena Ave; Louise St; Athens Ave; Terminal; Mead Ave; Jefferson St; Goss St; Hollis St; 6th; E E; Alaska St; Mandela Pkwy; Isabella St; Beach St; Lewis St; 25th St; 20th; Navy Roadway; Halleck St; Urkraine St; Chase St; 36th St; Inventory; Campbell Village Ct; Milton St; Curtis St; 13th; Buna St; Chungking St; 5th; Poplar Ct (Poplar Way); Kirkham Ct (Kirkham St); Attu St; Haven St; Chestnut Ct (Chestnut St); Dolphin St; Covent Ln; 26th; Motor Pool Way; Horton St; Interstate 880 S; Alicia St; Bay St; Moss Ln; Fitzgerald St; Ambler Ln; Transit St; Maritime; McElroy St; Foot of Wood (Wood St); Ealing Ln; Interstate 980 E; Tobruk; 40th; Baku St; Center; Harlan St; Park Ave; I- 80 E; 4th; Shorey St; Orient St; Surryhne St; Hubbard St; Cypress; Palm Ct; Merrimac St; 17th; 30th.
Railroad features: Union Pacific RR; Bay Area Rapid Transit RR.
West Oakland neighborhood detailed profile
Woodland neighborhood in Oakland statistics: (Find on map)
Area: 0.205 square miles
Population: 2,558
Population density:
Median household income in 2021:
Median rent in in 2021:
Male vs Females
Median age
Average estimated value of detached houses in 2021 (69.6% of all units):
Most popular occupations of males: service occupations (23.9%); construction, extraction, and maintenance occupations (21.6%); sales and office occupations (11.0%); management occupations (except farmers) (9.9%); production occupations (9.4%); transportation occupations (6.5%); healthcare practitioners and technical occupations (5.2%)
Most popular occupations of females: service occupations (34.4%); sales and office occupations (23.1%); community and social services occupations (13.5%); healthcare practitioners and technical occupations (6.8%); material moving occupations (6.0%); production occupations (4.5%); management occupations (except farmers) (3.9%)
Roads and streets: 85th Ave; 83rd Ave; 84th Ave; 85th; G St; Amelia St; E St; B St; D St; A St.
Railroad features: Bay Area Rapid Transit RR.
Woodland neighborhood detailed profile
Area: 0.205 square miles
Population: 2,558
Population density:
| Woodland: | 12,457 people per square mile |
| Oakland: | 7,739 people per square mile |
Median household income in 2021:
| Woodland: | $60,403 |
| Oakland: | $82,236 |
Median rent in in 2021:
| Woodland: | $1,518 |
| Oakland: | $1,617 |
Male vs Females
| Males: | 1,349 |
| Females: | 1,208 |
Median age
| Males: | 29.7 years |
| Females: | 30.2 years |
Average estimated value of detached houses in 2021 (69.6% of all units):
| Woodland: | $356,613 |
| Oakland: | $883,784 |
Most popular occupations of males: service occupations (23.9%); construction, extraction, and maintenance occupations (21.6%); sales and office occupations (11.0%); management occupations (except farmers) (9.9%); production occupations (9.4%); transportation occupations (6.5%); healthcare practitioners and technical occupations (5.2%)
Most popular occupations of females: service occupations (34.4%); sales and office occupations (23.1%); community and social services occupations (13.5%); healthcare practitioners and technical occupations (6.8%); material moving occupations (6.0%); production occupations (4.5%); management occupations (except farmers) (3.9%)
Roads and streets: 85th Ave; 83rd Ave; 84th Ave; 85th; G St; Amelia St; E St; B St; D St; A St.
Railroad features: Bay Area Rapid Transit RR.
Woodland neighborhood detailed profile
Woodminster neighborhood in Oakland statistics: (Find on map)
Area: 0.438 square miles
Population: 1,697
Population density:
Median household income in 2021:
Median rent in in 2021:
Male vs Females
Median age
Housing prices:
Average estimated value of detached houses in 2021 (91.7% of all units):
Average estimated value of townhouses or other attached units in 2021 (8.6% of all units):
Most popular occupations of males: management occupations (except farmers) (19.2%); sales and office occupations (15.2%); business and financial operations occupations (11.8%); education, training, and library occupations (11.8%); construction, extraction, and maintenance occupations (10.8%); computer and mathematical occupations (7.1%); arts, design, entertainment, sports, and media occupations (3.7%)
Most popular occupations of females: sales and office occupations (20.5%); education, training, and library occupations (14.5%); management occupations (except farmers) (10.9%); service occupations (10.7%); architecture and engineering occupations (9.8%); legal occupations (8.3%); healthcare practitioners and technical occupations (8.1%)
Limited-access highways (interstate or state) in this neighborhood: State Hwy 13 (Warren Fwy).
Roads and streets: Butters Dr; Burdeck Dr; Brunell Dr; Rubin Dr; Trinidad Ave; Klamath St; Noyo St; Robinson Dr; Crestmont Dr; Brunell Pl; Hedge Ct; Burdeck Ct; Buckley Ct; Skyline Blvd; Hedge Ln; Joaquin Miller Rd.
Woodminster neighborhood detailed profile
Area: 0.438 square miles
Population: 1,697
Population density:
| Woodminster: | 3,872 people per square mile |
| Oakland: | 7,739 people per square mile |
Median household income in 2021:
| Woodminster: | $161,032 |
| Oakland: | $82,236 |
Median rent in in 2021:
| Woodminster: | $3,490 |
| Oakland: | $1,617 |
Male vs Females
| Males: | 795 |
| Females: | 901 |
Median age
| Males: | 45.2 years |
| Females: | 47.8 years |
Housing prices:
Average estimated value of detached houses in 2021 (91.7% of all units):
| Woodminster: | $987,107 |
| Oakland: | $883,784 |
Average estimated value of townhouses or other attached units in 2021 (8.6% of all units):
| This neighborhood: | $665,882 |
| city: | $744,263 |
Most popular occupations of males: management occupations (except farmers) (19.2%); sales and office occupations (15.2%); business and financial operations occupations (11.8%); education, training, and library occupations (11.8%); construction, extraction, and maintenance occupations (10.8%); computer and mathematical occupations (7.1%); arts, design, entertainment, sports, and media occupations (3.7%)
Most popular occupations of females: sales and office occupations (20.5%); education, training, and library occupations (14.5%); management occupations (except farmers) (10.9%); service occupations (10.7%); architecture and engineering occupations (9.8%); legal occupations (8.3%); healthcare practitioners and technical occupations (8.1%)
Limited-access highways (interstate or state) in this neighborhood: State Hwy 13 (Warren Fwy).
Roads and streets: Butters Dr; Burdeck Dr; Brunell Dr; Rubin Dr; Trinidad Ave; Klamath St; Noyo St; Robinson Dr; Crestmont Dr; Brunell Pl; Hedge Ct; Burdeck Ct; Buckley Ct; Skyline Blvd; Hedge Ln; Joaquin Miller Rd.
Woodminster neighborhood detailed profile