Fitchburg neighborhood in Oakland, California (CA), 94621 detailed profile
Settings
X

Business Search - 14 Million verified businesses
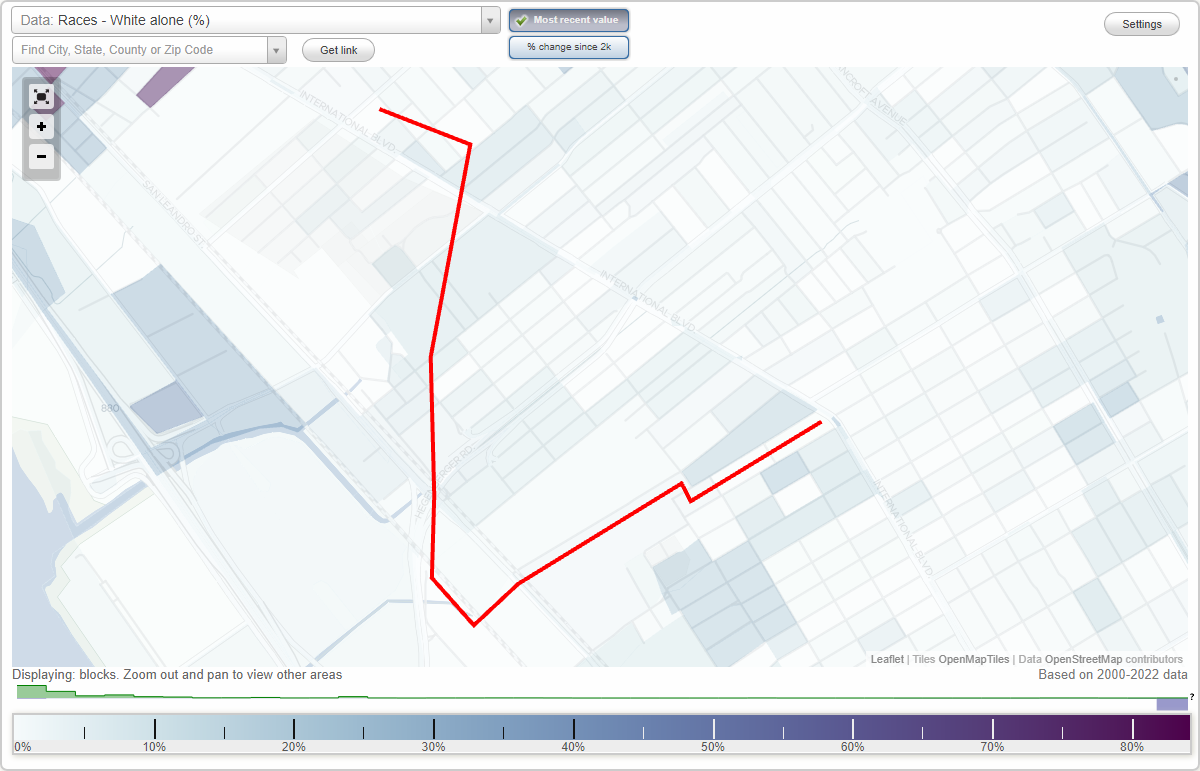
Area: 0.288 square miles
Population: 4,281
Population density:
| Fitchburg: | 14,884 people per square mile |
| Oakland: | 7,680 people per square mile |

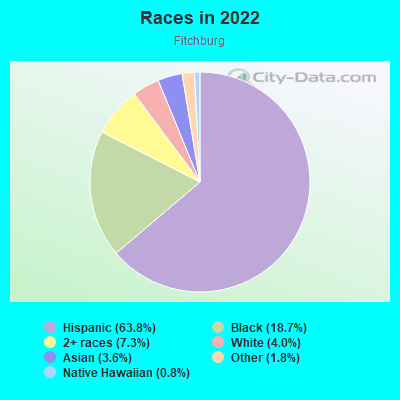
- 2,95563.8%Hispanic or Latino
- 86618.7%Black
- 3397.3%Two or more races
- 1874.0%White
- 1663.6%Asian
- 851.8%Some other race
- 350.8%Native Hawaiian and Other
Pacific Islander
Median household income in 2022:
| Fitchburg: | $63,916 |
| Oakland: | $93,146 |
Distribution of median household income
![Distribution of median household income]()
- 70Less than $10,000
- 221$10,000 to $19,999
- 198$20,000 to $29,999
- 131$30,000 to $39,999
- 75$40,000 to $49,999
- 65$50,000 to $59,999
- 94$60,000 to $74,999
- 115$75,000 to $99,999
- 120$100,000 to $124,999
- 76$125,000 to $149,999
- 35$150,000 to $199,999
- 57$200,000 or more

Distribution of owner-occupied house/condo value
![Distribution of owner-occupied house/condo value]()
- 104Less than $50,000
- 36$50,000 to $99,999
- 45$100,000 to $149,999
- 15$150,000 to $199,999
- 22$200,000 to $249,999
- 34$250,000 to $299,999
- 26$300,000 to $399,999
- 126$400,000 to $499,999
- 148$500,000 to $749,999
- 37$750,000 to $999,999
- 21$1,000,000 or more

Distribution of rent paid by renters
![Distribution of rent paid by renters]()
- 72Less than $100
- 30$100 to $199
- 220$200 to $299
- 93$300 to $399
- 81$400 to $499
- 59$500 to $599
- 35$600 to $699
- 86$700 to $799
- 66$800 to $899
- 68$900 to $999
- 61$1,000 to $1,249
- 105$1,250 to $1,499
- 115$1,500 to $1,999
- 401$2,000 or more

Median rent in 2022:
| Fitchburg: | $1,237 |
| Oakland: | $1,741 |
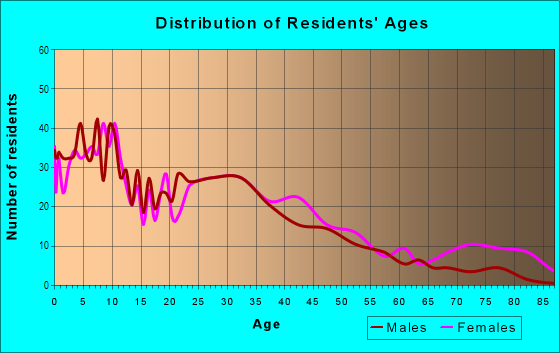
| Males: | 2,157 |
| Females: | 2,123 |
Males:
| This neighborhood: | 31.9 years |
| Whole city: | 38.3 years |
| This neighborhood: | 31.9 years |
| Whole city: | 39.1 years |
Average household size:
| Fitchburg: | 9.0 people |
| Oakland: | 2.4 people |
Percentage of family households:
| Fitchburg: | 56.2% |
| Oakland: | 37.1% |
| Here: | 35.4% |
| Oakland: | 34.9% |
Percentage of married-couple families with children (among all households):
| Fitchburg: | 18.6% |
| Oakland: | 28.3% |
Percentage of single-mother households (among all households):
| Fitchburg: | 7.6% |
| Oakland: | 9.9% |
Percentage of never married males 15 years old and over:
Percentage of never married females 15 years old and over:
| Fitchburg: | 29.0% |
| Oakland: | 24.6% |
Percentage of never married females 15 years old and over:
| Fitchburg: | 24.3% |
| city: | 21.9% |
Percentage of people that speak English not well or not at all:
| Fitchburg: | 8.0% |
| Oakland: | 10.6% |
Percentage of people born in this state:
Percentage of people born in another U.S. state:
Percentage of native residents but born outside the U.S.:
Percentage of foreign born residents:
| Here: | 52.2% |
| Oakland: | 49.9% |
Percentage of people born in another U.S. state:
| Fitchburg: | 9.4% |
| Oakland: | 22.3% |
Percentage of native residents but born outside the U.S.:
| Here: | 0.8% |
| city: | 1.6% |
Percentage of foreign born residents:
| Here: | 37.6% |
| Oakland: | 26.2% |
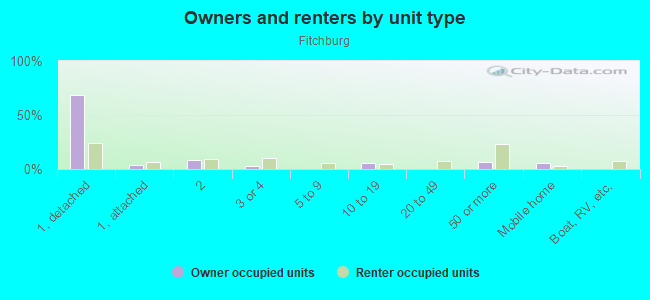
Owner-occupied
Renter-occupied

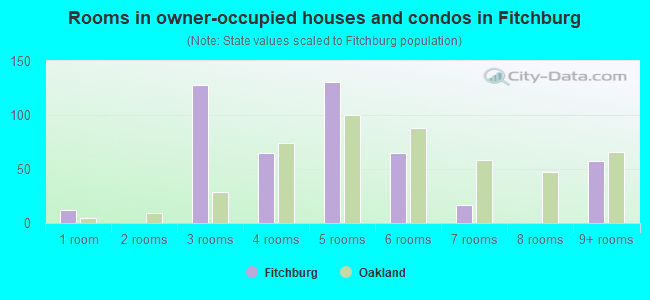
- Rooms in owner-occupied houses and condos in Fitchburg
- 121 room
- 02 rooms
- 1283 rooms
- 654 rooms
- 1315 rooms
- 656 rooms
- 177 rooms
- 08 rooms
- 579+ rooms
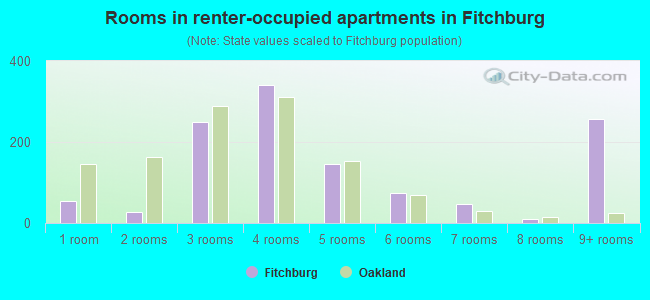
- Rooms in renter-occupied apartments in Fitchburg
- 551 room
- 272 rooms
- 2493 rooms
- 3414 rooms
- 1465 rooms
- 756 rooms
- 467 rooms
- 98 rooms
- 2569+ rooms
Owner-occupied
Renter-occupied
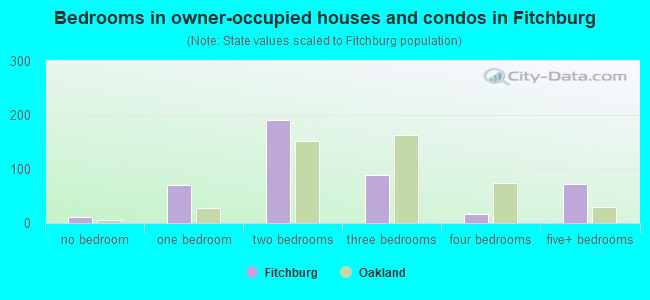
- Bedrooms in owner-occupied houses and condos in Fitchburg
- 12no bedroom
- 711 bedroom
- 1912 bedrooms
- 893 bedrooms
- 164 bedrooms
- 725+ bedrooms
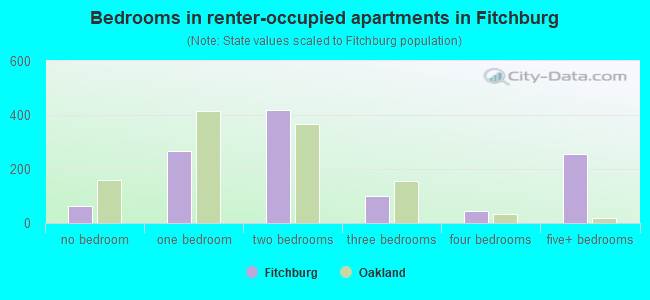
- Bedrooms in renter-occupied apartments in Fitchburg
- 64no bedroom
- 2661 bedroom
- 4192 bedrooms
- 1013 bedrooms
- 464 bedrooms
- 2565+ bedrooms
Average number of cars or other vehicles available in houses/condos:
Average number of cars or other vehicles available in apartments:
| This neighborhood: | 2.3 |
| Oakland: | 1.8 |
Average number of cars or other vehicles available in apartments:
| Here: | 1.5 |
| city: | 1.1 |
Percentage of units with a mortgage:
| Fitchburg: | 82.6% |
| Oakland: | 71.2% |
Average estimated value of detached houses in 2022 (42.7% of all units):
| Fitchburg: | $345,972 |
| Oakland: | $1,000,874 |
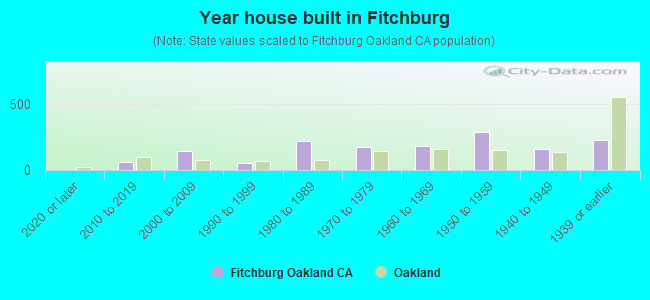
- Year house built in Fitchburg
- 02020 or later
- 592010 to 2019
- 1412000 to 2009
- 521990 to 1999
- 2221980 to 1989
- 1741970 to 1979
- 1781960 to 1969
- 2851950 to 1959
- 1561940 to 1949
- 2281939 or earlier
City-data.com crime index for city in 2020 (higher means more crime):
| City: | 691.6 |
| U.S. average: | 219.5 |
Travel time to work (commute)
![Travel time to work (commute)]()
- 28Less than 5 minutes
- 185 to 9 minutes
- 23310 to 14 minutes
- 15315 to 19 minutes
- 16520 to 24 minutes
- 3425 to 29 minutes
- 39330 to 34 minutes
- 5635 to 39 minutes
- 25840 to 44 minutes
- 16645 to 59 minutes
- 22060 to 89 minutes
- 9790 or more minutes

Means of transportation to work
![Means of transportation to work]()
- 65.8%1,171Drove a car alone
- 11.2%200Carpooled
- 4.5%80Bus
- 8.3%148Subway or elevated rail
- 0.7%12Long-distance train or commuter rail
- 2.9%52Taxi
- 4.4%79Bicycle
- 1.2%22Walked
- 18.5%329Other means
- 8.0%142Worked at home

Time leaving home to go to work
![Time leaving home to go to work]()
- 7512:00 a.m. to 4:59 a.m.
- 1895:00 a.m. to 5:29 a.m.
- 1205:30 a.m. to 5:59 a.m.
- 2636:00 a.m. to 6:29 a.m.
- 736:30 a.m. to 6:59 a.m.
- 2977:00 a.m. to 7:29 a.m.
- 527:30 a.m. to 7:59 a.m.
- 2698:00 a.m. to 8:29 a.m.
- 618:30 a.m. to 8:59 a.m.
- 1209:00 a.m. to 9:59 a.m.
- 7610:00 a.m. to 10:59 a.m.
- 211:00 a.m. to 11:59 a.m.
- 11912:00 p.m. to 3:59 p.m.
- 1384:00 p.m. to 11:59 p.m.

Occupations of males:
- Percentage of males in management occupations (except farmers):
Here: 5.1% city: 13.5%
- Percentage of males in community and social services occupations:
Here: 1.7% city: 1.5%
- Percentage of males in education, training, and library occupations:
Here: 3.5% city: 4.6%
- Percentage of males in healthcare practitioners and technical occupations:
Here: 1.7% city: 2.8%
- Percentage of males in service occupations:
Here: 9.6% city: 12.9%
- Percentage of males in sales and office occupations:
Here: 11.5% city: 13.4%
- Percentage of males in construction, extraction, and maintenance occupations:
Here: 40.6% city: 8.3%
- Percentage of males in production occupations:
Here: 6.0% city: 4.2%
- Percentage of males in transportation occupations:
Here: 7.6% city: 5.6%
- Percentage of males in material moving occupations:
Here: 7.2% city: 4.5%
Occupations of females:
- Percentage of females in management occupations (except farmers):
Here: 3.3% city: 15.1%
- Percentage of females in computer and mathematical occupations:
Here: 2.2% city: 3.0%
- Percentage of females in community and social services occupations:
Here: 3.1% city: 3.7%
- Percentage of females in education, training, and library occupations:
Here: 3.7% city: 8.4%
- Percentage of females in service occupations:
Here: 43.5% city: 17.8%
- Percentage of females in sales and office occupations:
Here: 27.6% city: 20.0%
- Percentage of females in construction, extraction, and maintenance occupations:
Here: 2.0% city: 0.3%
- Percentage of females in production occupations:
Here: 3.5% city: 2.4%
- Percentage of females in transportation occupations:
Here: 3.3% city: 1.2%
- Percentage of females in material moving occupations:
Here: 7.4% city: 1.7%
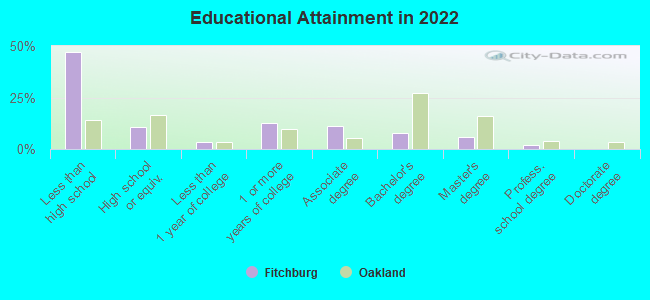
Education in this neighborhood (subdivision or community):
- Percentage of people 3 years and older in K-12 schools:
Fitchburg: 20.2% Oakland: 13.0%
- Percentage of people 3 years and older in undergraduate colleges:
Fitchburg: 4.8% Oakland: 4.3%
- Percentage of people 3 years and older in grad. or professional schools:
Fitchburg: 2.6% Oakland: 1.8%
- Percentage of students K-12 enrolled in private schools:
Fitchburg: 18.0% Oakland: 15.8%
Percentage of population below poverty level:
| Fitchburg: | 28.2% |
| Oakland: | 13.9% |
Median year owner moved in (as recorded in 2022):
Median year renter moved in (as recorded in 2022):
| Fitchburg: | 2004 |
| Oakland: | 2010 |
Median year renter moved in (as recorded in 2022):
| Fitchburg: | 2014 |
| Oakland: | 2018 |
Percentage of married-couple families with both working:
| Fitchburg: | 28.8% |
| Oakland: | 73.2% |
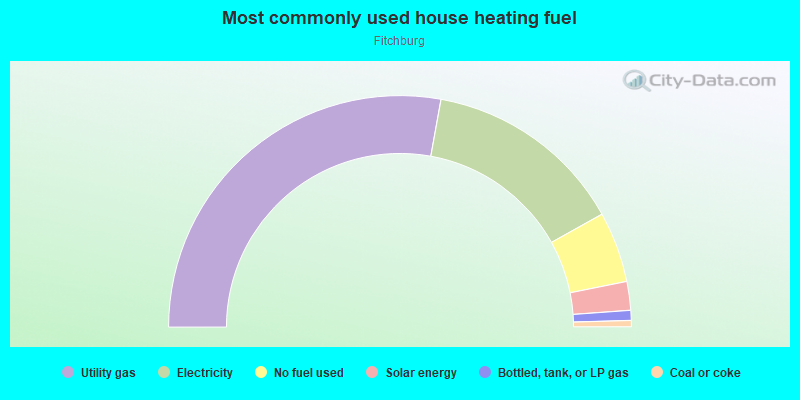
- 55.7%Utility gas
- 28.1%Electricity
- 9.9%No fuel used
- 4.0%Solar energy
- 1.4%Bottled, tank, or LP gas
- 0.9%Coal or coke
Roads and streets:
81st Ave
Length: 0.83 miles
Direction: SW-NE
Address range: 700 to 1299
Direction: SW-NE
Address range: 700 to 1299
77th Ave
Length: 0.63 miles
Direction: SW-NE
Address range: 700 to 1199
Direction: SW-NE
Address range: 700 to 1199
75th Ave
Length: 0.62 miles
Direction: SW-NE
Address range: 800 to 1199
Direction: SW-NE
Address range: 800 to 1199
76th Ave
Length: 0.45 miles
Direction: SW-NE
Address range: 900 to 1199
Direction: SW-NE
Address range: 900 to 1199
Rudsdale St
Length: 0.38 miles
Direction: SE-NW
Address range: 7500 to 8199
Direction: SE-NW
Address range: 7500 to 8199
79th Ave
Length: 0.36 miles
Directions: SE-NW, SW-NE
Address range: 1100 to 1399
Directions: SE-NW, SW-NE
Address range: 1100 to 1399
San Leandro
Length: 0.30 miles
Direction: SE-NW
Direction: SE-NW
San Leandro St
Length: 0.26 miles
Direction: SE-NW
Address range: 7500 to 7999
Direction: SE-NW
Address range: 7500 to 7999
82nd Ave
Length: 0.24 miles
Direction: SW-NE
Address range: 1001 to 1249
Direction: SW-NE
Address range: 1001 to 1249
80th Ave
Length: 0.17 miles
Direction: SW-NE
Address range: 1000 to 1299
Direction: SW-NE
Address range: 1000 to 1299
Hawley St
Length: 0.10 miles
Direction: SE-NW
Address range: 7500 to 7699
Direction: SE-NW
Address range: 7500 to 7699
Spencer St
Length: 0.10 miles
Direction: SE-NW
Address range: 7500 to 7699
Direction: SE-NW
Address range: 7500 to 7699
Hamilton St
Length: 0.10 miles
Direction: SE-NW
Address range: 7500 to 7699
Direction: SE-NW
Address range: 7500 to 7699
B St
Length: 0.08 miles
Direction: SE-NW
Address range: 8000 to 8099
Direction: SE-NW
Address range: 8000 to 8099
78th Ave
Length: 0.07 miles
Direction: SW-NE
Address range: 1100 to 1199
Direction: SW-NE
Address range: 1100 to 1199
Railroad features:
Union Pacific RR
Length: 0.31 miles
Direction: SE-NW
Direction: SE-NW
Bay Area Rapid Transit RR
Length: 0.27 miles
Direction: SE-NW
Direction: SE-NW