Coliseum neighborhood in Oakland, California (CA), 94621 detailed profile
Settings
X

Business Search - 14 Million verified businesses
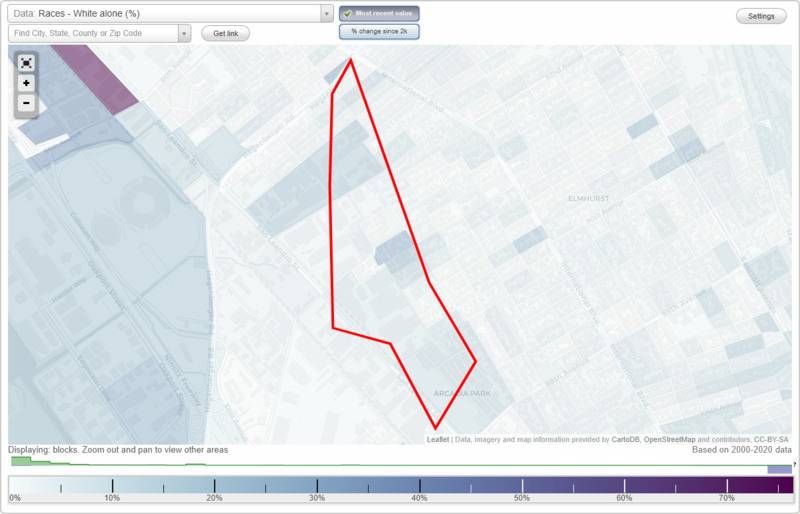
Area: 0.251 square miles
Population: 4,741
Population density:
| Coliseum: | 18,906 people per square mile |
| Oakland: | 7,680 people per square mile |

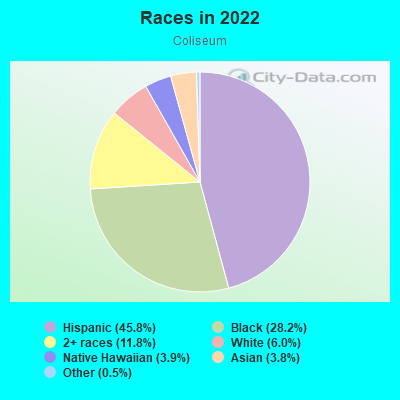
- 2,22145.8%Hispanic or Latino
- 1,36628.2%Black
- 57211.8%Two or more races
- 2926.0%White
- 1883.9%Native Hawaiian and Other
Pacific Islander - 1863.8%Asian
- 250.5%Some other race
Median household income in 2022:
| Coliseum: | $54,558 |
| Oakland: | $93,146 |
Distribution of median household income
![Distribution of median household income]()
- 142Less than $10,000
- 277$10,000 to $19,999
- 293$20,000 to $29,999
- 152$30,000 to $39,999
- 110$40,000 to $49,999
- 85$50,000 to $59,999
- 102$60,000 to $74,999
- 135$75,000 to $99,999
- 196$100,000 to $124,999
- 90$125,000 to $149,999
- 86$150,000 to $199,999
- 184$200,000 or more

Distribution of owner-occupied house/condo value
![Distribution of owner-occupied house/condo value]()
- 121Less than $50,000
- 19$200,000 to $249,999
- 30$250,000 to $299,999
- 97$300,000 to $399,999
- 75$400,000 to $499,999
- 127$500,000 to $749,999
- 4$750,000 to $999,999
- 30$1,000,000 or more

Distribution of rent paid by renters
![Distribution of rent paid by renters]()
- 136Less than $100
- 56$100 to $199
- 204$200 to $299
- 194$300 to $399
- 115$400 to $499
- 405$500 to $599
- 31$600 to $699
- 111$700 to $799
- 67$800 to $899
- 144$900 to $999
- 92$1,000 to $1,249
- 294$1,250 to $1,499
- 85$1,500 to $1,999
- 376$2,000 or more

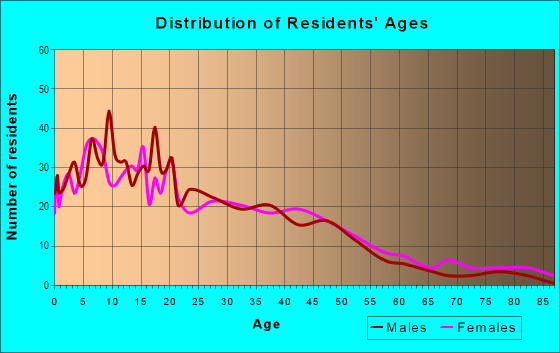
| Males: | 2,310 |
| Females: | 2,430 |
Males:
| This neighborhood: | 30.2 years |
| Whole city: | 38.3 years |
| This neighborhood: | 31.4 years |
| Whole city: | 39.1 years |
Average household size:
| Coliseum: | 10.2 people |
| Oakland: | 2.4 people |
Percentage of family households:
| Coliseum: | 59.3% |
| Oakland: | 37.1% |
| Here: | 36.5% |
| Oakland: | 34.9% |
Percentage of married-couple families with children (among all households):
| Coliseum: | 21.9% |
| Oakland: | 28.3% |
Percentage of single-mother households (among all households):
| Coliseum: | 7.5% |
| Oakland: | 9.9% |
Percentage of never married males 15 years old and over:
Percentage of never married females 15 years old and over:
| Coliseum: | 28.0% |
| Oakland: | 24.6% |
Percentage of never married females 15 years old and over:
| Coliseum: | 24.7% |
| city: | 21.9% |
Percentage of people that speak English not well or not at all:
| Coliseum: | 9.6% |
| Oakland: | 10.6% |
Percentage of people born in this state:
Percentage of people born in another U.S. state:
Percentage of native residents but born outside the U.S.:
Percentage of foreign born residents:
| Here: | 56.4% |
| Oakland: | 49.9% |
Percentage of people born in another U.S. state:
| Coliseum: | 6.0% |
| Oakland: | 22.3% |
Percentage of native residents but born outside the U.S.:
| Here: | 2.0% |
| city: | 1.6% |
Percentage of foreign born residents:
| Here: | 35.6% |
| Oakland: | 26.2% |
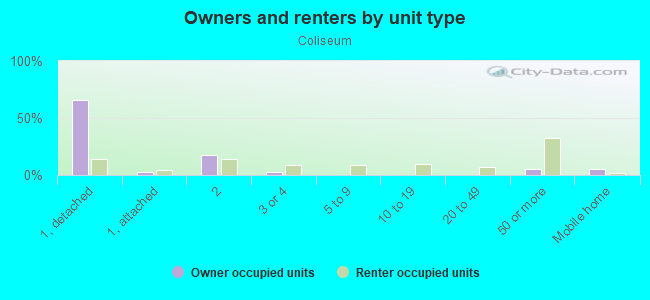
Owner-occupied
Renter-occupied

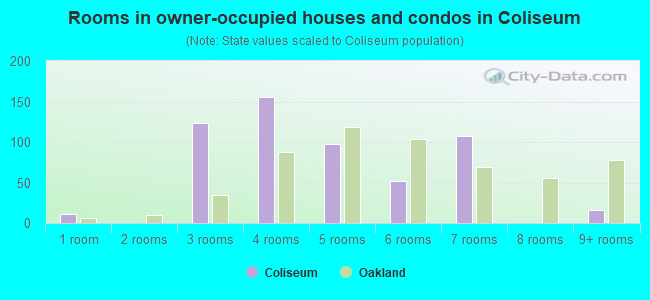
- Rooms in owner-occupied houses and condos in Coliseum
- 111 room
- 02 rooms
- 1243 rooms
- 1554 rooms
- 985 rooms
- 526 rooms
- 1087 rooms
- 08 rooms
- 169+ rooms
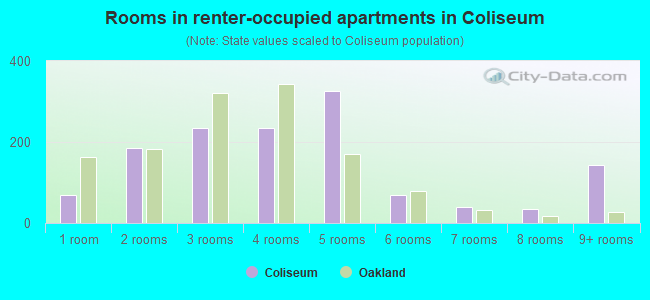
- Rooms in renter-occupied apartments in Coliseum
- 701 room
- 1842 rooms
- 2353 rooms
- 2354 rooms
- 3265 rooms
- 686 rooms
- 397 rooms
- 348 rooms
- 1439+ rooms
Owner-occupied
Renter-occupied
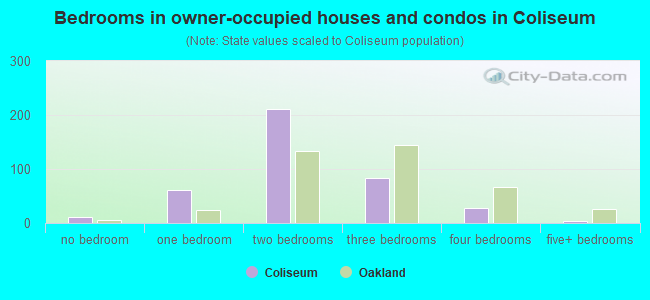
- Bedrooms in owner-occupied houses and condos in Coliseum
- 11no bedroom
- 621 bedroom
- 2122 bedrooms
- 833 bedrooms
- 274 bedrooms
- 35+ bedrooms
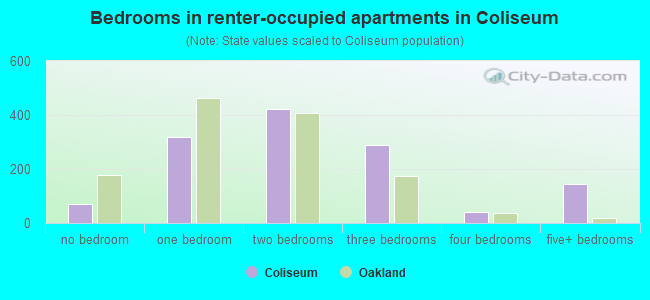
- Bedrooms in renter-occupied apartments in Coliseum
- 70no bedroom
- 3181 bedroom
- 4212 bedrooms
- 2903 bedrooms
- 394 bedrooms
- 1435+ bedrooms
Average number of cars or other vehicles available in houses/condos:
Average number of cars or other vehicles available in apartments:
| This neighborhood: | 3.1 |
| Oakland: | 1.8 |
Average number of cars or other vehicles available in apartments:
| Here: | 1.1 |
| city: | 1.1 |
Percentage of units with a mortgage:
| Coliseum: | 87.8% |
| Oakland: | 71.2% |
Average estimated value of detached houses in 2022 (29.6% of all units):
| Coliseum: | $415,357 |
| Oakland: | $1,000,874 |
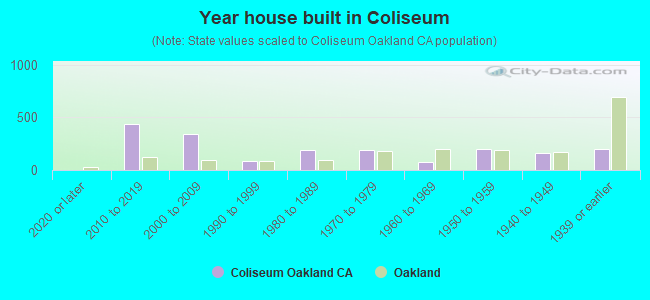
- Year house built in Coliseum
- 02020 or later
- 4362010 to 2019
- 3392000 to 2009
- 881990 to 1999
- 1881980 to 1989
- 1861970 to 1979
- 781960 to 1969
- 2031950 to 1959
- 1571940 to 1949
- 1951939 or earlier
City-data.com crime index for city in 2020 (higher means more crime):
| City: | 691.6 |
| U.S. average: | 219.5 |
Travel time to work (commute)
![Travel time to work (commute)]()
- 18Less than 5 minutes
- 725 to 9 minutes
- 29710 to 14 minutes
- 23915 to 19 minutes
- 27520 to 24 minutes
- 8925 to 29 minutes
- 51630 to 34 minutes
- 5635 to 39 minutes
- 16040 to 44 minutes
- 29245 to 59 minutes
- 19160 to 89 minutes
- 1690 or more minutes

Means of transportation to work
![Means of transportation to work]()
- 51.8%975Drove a car alone
- 12.8%242Carpooled
- 3.8%72Bus
- 10.4%196Subway or elevated rail
- 0.6%11Long-distance train or commuter rail
- 23.4%440Taxi
- 6.3%118Bicycle
- 2.6%49Walked
- 7.2%135Other means
- 5.3%99Worked at home

Time leaving home to go to work
![Time leaving home to go to work]()
- 20412:00 a.m. to 4:59 a.m.
- 1065:00 a.m. to 5:29 a.m.
- 1245:30 a.m. to 5:59 a.m.
- 1326:00 a.m. to 6:29 a.m.
- 986:30 a.m. to 6:59 a.m.
- 2367:00 a.m. to 7:29 a.m.
- 1187:30 a.m. to 7:59 a.m.
- 4008:00 a.m. to 8:29 a.m.
- 1148:30 a.m. to 8:59 a.m.
- 729:00 a.m. to 9:59 a.m.
- 5310:00 a.m. to 10:59 a.m.
- 14612:00 p.m. to 3:59 p.m.
- 1714:00 p.m. to 11:59 p.m.

Occupations of males:
- Percentage of males in management occupations (except farmers):
Here: 3.0% city: 13.5%
- Percentage of males in computer and mathematical occupations:
Here: 1.0% city: 7.3%
- Percentage of males in life, physical, and social science occupations:
Here: 1.0% city: 2.0%
- Percentage of males in service occupations:
Here: 12.1% city: 12.9%
- Percentage of males in sales and office occupations:
Here: 25.6% city: 13.4%
- Percentage of males in construction, extraction, and maintenance occupations:
Here: 23.1% city: 8.3%
- Percentage of males in production occupations:
Here: 2.4% city: 4.2%
- Percentage of males in transportation occupations:
Here: 14.2% city: 5.6%
- Percentage of males in material moving occupations:
Here: 9.8% city: 4.5%
Occupations of females:
- Percentage of females in management occupations (except farmers):
Here: 10.9% city: 15.1%
- Percentage of females in community and social services occupations:
Here: 5.0% city: 3.7%
- Percentage of females in education, training, and library occupations:
Here: 3.3% city: 8.4%
- Percentage of females in arts, design, entertainment, sports, and media occupations:
Here: 1.8% city: 4.8%
- Percentage of females in healthcare practitioners and technical occupations:
Here: 2.9% city: 6.7%
- Percentage of females in service occupations:
Here: 40.8% city: 17.8%
- Percentage of females in sales and office occupations:
Here: 17.1% city: 20.0%
- Percentage of females in production occupations:
Here: 5.4% city: 2.4%
- Percentage of females in transportation occupations:
Here: 8.5% city: 1.2%
- Percentage of females in material moving occupations:
Here: 3.5% city: 1.7%
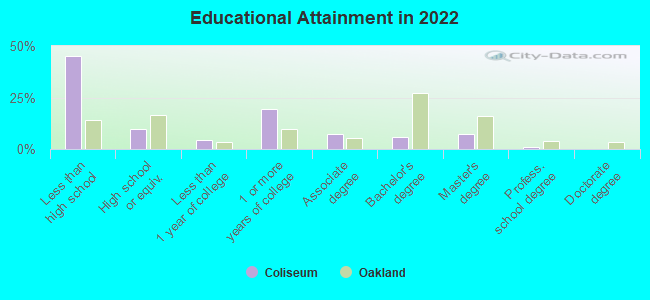
Education in this neighborhood (subdivision or community):
- Percentage of people 3 years and older in K-12 schools:
Coliseum: 35.3% Oakland: 13.0%
- Percentage of people 3 years and older in undergraduate colleges:
Coliseum: 5.1% Oakland: 4.3%
- Percentage of people 3 years and older in grad. or professional schools:
Coliseum: 2.9% Oakland: 1.8%
- Percentage of students K-12 enrolled in private schools:
Coliseum: 27.9% Oakland: 15.8%
Percentage of population below poverty level:
| Coliseum: | 21.4% |
| Oakland: | 13.9% |
Median year renter moved in (as recorded in 2022):
| Coliseum: | 2015 |
| Oakland: | 2018 |
Percentage of married-couple families with both working:
| Coliseum: | 72.7% |
| Oakland: | 73.2% |
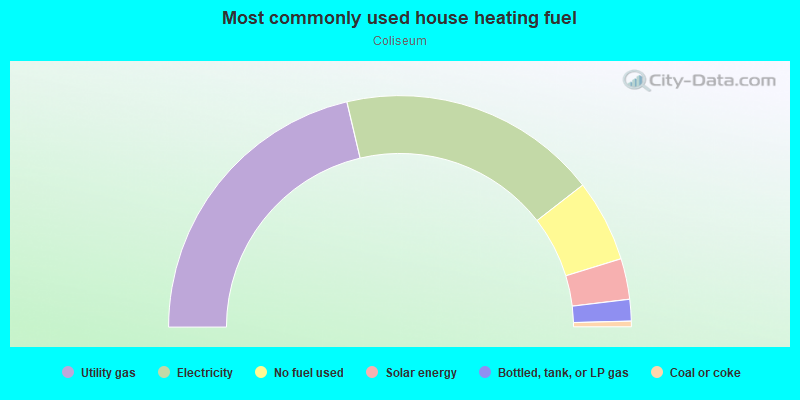
- 42.6%Utility gas
- 36.3%Electricity
- 11.5%No fuel used
- 5.7%Solar energy
- 3.0%Bottled, tank, or LP gas
- 0.8%Coal or coke
Roads and streets:
69th Ave
Length: 0.64 miles
Direction: SW-NE
Address range: 700 to 1198
Direction: SW-NE
Address range: 700 to 1198
71st Ave
Length: 0.58 miles
Direction: SW-NE
Address range: 800 to 1199
Direction: SW-NE
Address range: 800 to 1199
70th Ave
Length: 0.58 miles
Direction: SW-NE
Address range: 800 to 1199
Direction: SW-NE
Address range: 800 to 1199
73rd Ave
Length: 0.54 miles
Direction: SW-NE
Address range: 900 to 1399
Direction: SW-NE
Address range: 900 to 1399
72nd Ave
Length: 0.44 miles
Direction: SW-NE
Address range: 900 to 1199
Direction: SW-NE
Address range: 900 to 1199
Hegenberger Expy
Length: 0.38 miles
Direction: SW-NE
Direction: SW-NE
Hegenberger
Length: 0.34 miles
Direction: SW-NE
Direction: SW-NE
Hamilton St
Length: 0.31 miles
Direction: SE-NW
Address range: 6800 to 7433
Direction: SE-NW
Address range: 6800 to 7433
Hawley St
Length: 0.29 miles
Directions: E-W, SE-NW
Address range: 6900 to 7399
Directions: E-W, SE-NW
Address range: 6900 to 7399
Rudsdale St
Length: 0.27 miles
Direction: SE-NW
Address range: 6900 to 7433
Direction: SE-NW
Address range: 6900 to 7433
Spencer St
Length: 0.27 miles
Direction: SE-NW
Address range: 6900 to 7431
Direction: SE-NW
Address range: 6900 to 7431
San Leandro St
Length: 0.21 miles
Direction: SE-NW
Address range: 6800 to 7299
Direction: SE-NW
Address range: 6800 to 7299
Brentford St
Length: 0.17 miles
Directions: N-S, SE-NW, SW-NE
Address range: 6700 to 6899
Directions: N-S, SE-NW, SW-NE
Address range: 6700 to 6899
Olmstead St
Length: 0.13 miles
Directions: N-S, SE-NW, SW-NE
Address range: 6701 to 6899
Directions: N-S, SE-NW, SW-NE
Address range: 6701 to 6899
Snell St
Length: 0.12 miles
Direction: SE-NW
Address range: 6800 to 7099
Direction: SE-NW
Address range: 6800 to 7099
San Leandro
Length: 0.08 miles
Direction: SE-NW
Direction: SE-NW