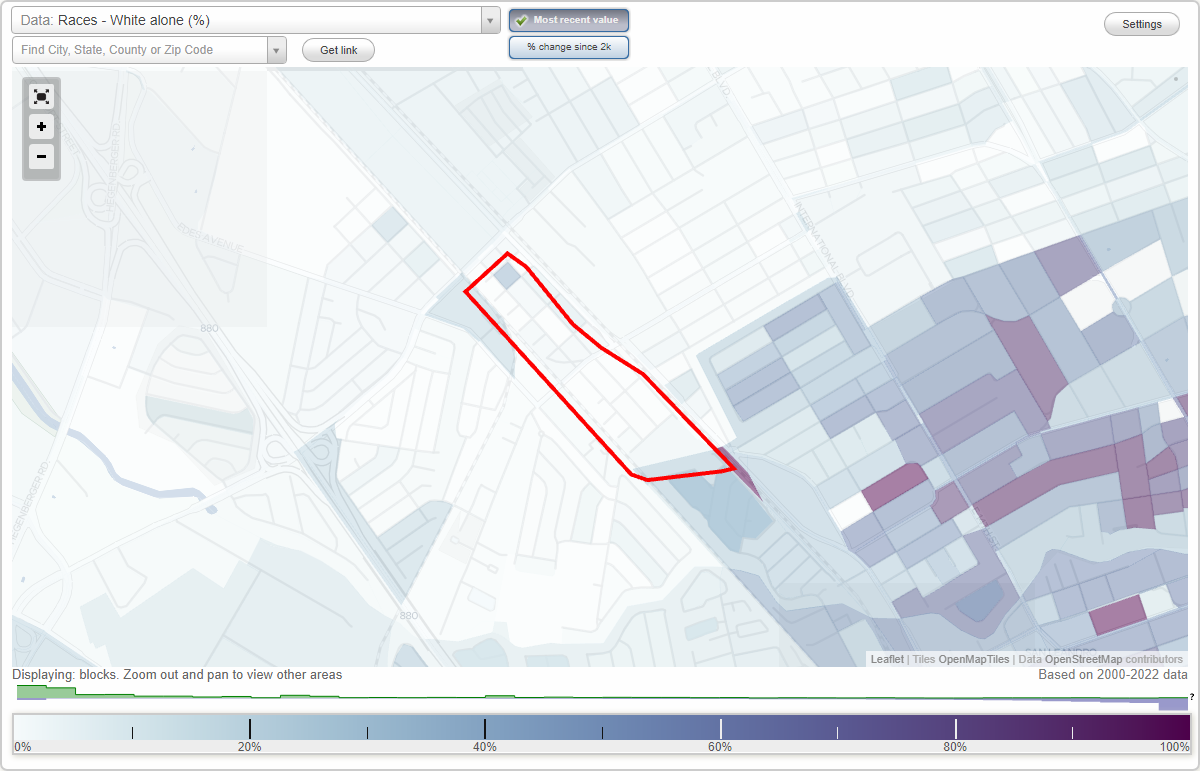
South Stonehurst neighborhood in Oakland, California (CA), 94603 detailed profile
Settings
X

Business Search - 14 Million verified businesses
Area: 0.106 square miles
Population: 975
Population density:
| South Stonehurst: | 9,198 people per square mile |
| Oakland: | 7,680 people per square mile |

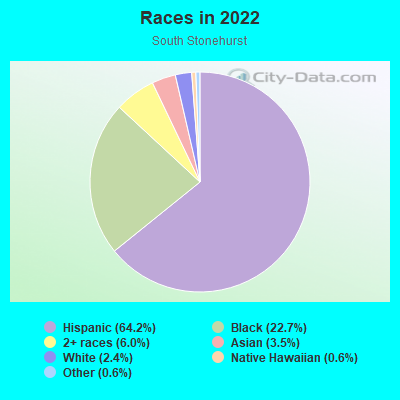
- 63264.2%Hispanic or Latino
- 22422.7%Black
- 596.0%Two or more races
- 343.5%Asian
- 242.4%White
- 60.6%Native Hawaiian and Other
Pacific Islander - 60.6%Some other race

Median household income in 2022:
| South Stonehurst: | $99,596 |
| Oakland: | $93,146 |
Distribution of median household income
![Distribution of median household income]()
- 8Less than $10,000
- 40$10,000 to $19,999
- 47$20,000 to $29,999
- 18$30,000 to $39,999
- 25$40,000 to $49,999
- 58$50,000 to $59,999
- 67$60,000 to $74,999
- 68$75,000 to $99,999
- 19$100,000 to $124,999
- 17$125,000 to $149,999
- 42$150,000 to $199,999
- 11$200,000 or more

Distribution of owner-occupied house/condo value
![Distribution of owner-occupied house/condo value]()
- 11Less than $50,000
- 1$50,000 to $99,999
- 2$100,000 to $149,999
- 35$200,000 to $249,999
- 7$250,000 to $299,999
- 24$300,000 to $399,999
- 19$400,000 to $499,999
- 84$500,000 to $749,999
- 22$750,000 to $999,999
- 16$1,000,000 or more

Distribution of rent paid by renters
![Distribution of rent paid by renters]()
- 25Less than $100
- 7$200 to $299
- 22$300 to $399
- 14$500 to $599
- 10$600 to $699
- 29$800 to $899
- 38$900 to $999
- 36$1,000 to $1,249
- 31$1,250 to $1,499
- 22$1,500 to $1,999
- 41$2,000 or more

| Males: | 564 |
| Females: | 410 |
Males:
| This neighborhood: | 40.6 years |
| Whole city: | 38.3 years |
| This neighborhood: | 39.3 years |
| Whole city: | 39.1 years |
Average household size:
| South Stonehurst: | 3.2 people |
| Oakland: | 2.4 people |
Percentage of family households:
| South Stonehurst: | 58.0% |
| Oakland: | 37.1% |
| Here: | 46.8% |
| Oakland: | 34.9% |
Percentage of married-couple families with children (among all households):
| South Stonehurst: | 23.9% |
| Oakland: | 28.3% |
Percentage of single-mother households (among all households):
| South Stonehurst: | 4.4% |
| Oakland: | 9.9% |
Percentage of never married males 15 years old and over:
Percentage of never married females 15 years old and over:
| South Stonehurst: | 28.1% |
| Oakland: | 24.6% |
Percentage of never married females 15 years old and over:
| South Stonehurst: | 20.4% |
| city: | 21.9% |
Percentage of people that speak English not well or not at all:
| South Stonehurst: | 7.7% |
| Oakland: | 10.6% |
Percentage of people born in this state:
Percentage of people born in another U.S. state:
Percentage of native residents but born outside the U.S.:
Percentage of foreign born residents:
| Here: | 56.2% |
| Oakland: | 49.9% |
Percentage of people born in another U.S. state:
| South Stonehurst: | 6.9% |
| Oakland: | 22.3% |
Percentage of native residents but born outside the U.S.:
| Here: | 2.0% |
| city: | 1.6% |
Percentage of foreign born residents:
| Here: | 36.7% |
| Oakland: | 26.2% |
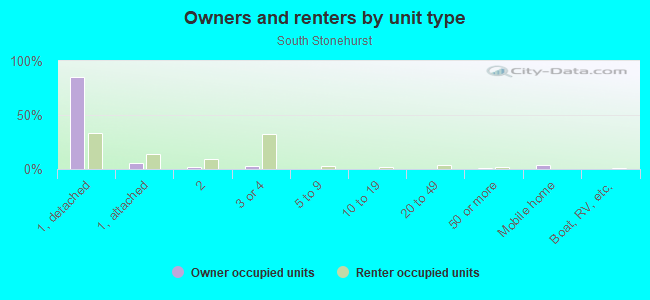
Owner-occupied
Renter-occupied

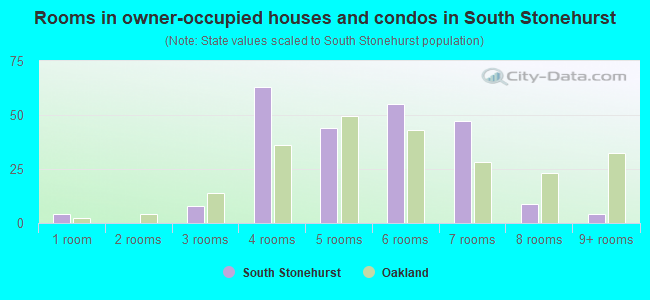
- Rooms in owner-occupied houses and condos in South Stonehurst
- 41 room
- 02 rooms
- 83 rooms
- 634 rooms
- 445 rooms
- 556 rooms
- 477 rooms
- 98 rooms
- 49+ rooms
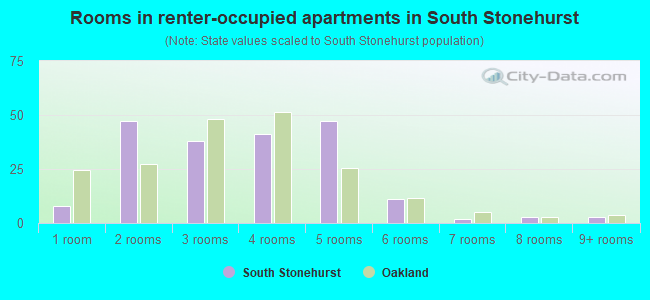
- Rooms in renter-occupied apartments in South Stonehurst
- 81 room
- 472 rooms
- 383 rooms
- 414 rooms
- 475 rooms
- 116 rooms
- 27 rooms
- 38 rooms
- 39+ rooms
Owner-occupied
Renter-occupied
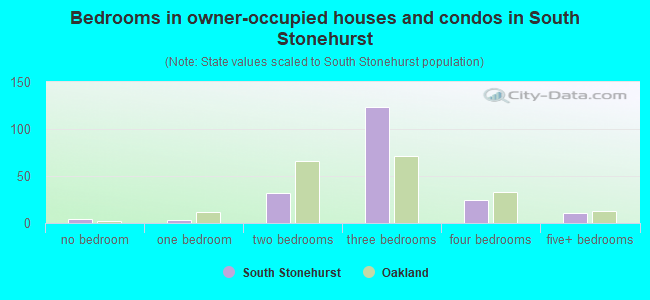
- Bedrooms in owner-occupied houses and condos in South Stonehurst
- 4no bedroom
- 31 bedroom
- 322 bedrooms
- 1233 bedrooms
- 244 bedrooms
- 115+ bedrooms
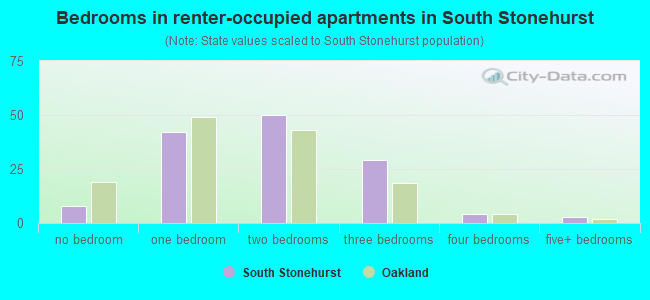
- Bedrooms in renter-occupied apartments in South Stonehurst
- 8no bedroom
- 421 bedroom
- 502 bedrooms
- 293 bedrooms
- 44 bedrooms
- 35+ bedrooms
Average number of cars or other vehicles available in houses/condos:
Average number of cars or other vehicles available in apartments:
| This neighborhood: | 1.8 |
| Oakland: | 1.8 |
Average number of cars or other vehicles available in apartments:
| Here: | 2.0 |
| city: | 1.1 |
Percentage of units with a mortgage:
| South Stonehurst: | 73.3% |
| Oakland: | 71.2% |
Average estimated value of detached houses in 2022 (68.9% of all units):
| South Stonehurst: | $419,653 |
| Oakland: | $1,000,874 |
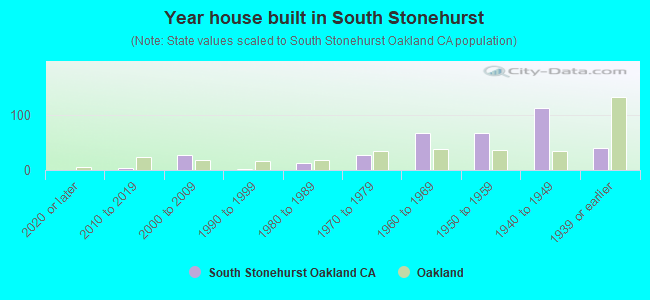
- Year house built in South Stonehurst
- 02020 or later
- 42010 to 2019
- 272000 to 2009
- 21990 to 1999
- 121980 to 1989
- 281970 to 1979
- 671960 to 1969
- 671950 to 1959
- 1121940 to 1949
- 401939 or earlier
City-data.com crime index for city in 2020 (higher means more crime):
| City: | 691.6 |
| U.S. average: | 219.5 |
Travel time to work (commute)
![Travel time to work (commute)]()
- 18Less than 5 minutes
- 215 to 9 minutes
- 4710 to 14 minutes
- 7715 to 19 minutes
- 13320 to 24 minutes
- 2525 to 29 minutes
- 8230 to 34 minutes
- 3235 to 39 minutes
- 1440 to 44 minutes
- 1345 to 59 minutes
- 1960 to 89 minutes
- 1190 or more minutes

Means of transportation to work
![Means of transportation to work]()
- 75.9%318Drove a car alone
- 16.5%69Carpooled
- 6.7%28Bus
- 8.8%37Subway or elevated rail
- 7.6%32Long-distance train or commuter rail
- 2.9%12Light rail, streetcar or trolley
- 1.2%5Taxi
- 1.0%4Motorcycle
- 4.1%17Bicycle
- 1.7%7Walked
- 2.9%12Other means
- 6.2%26Worked at home

Time leaving home to go to work
![Time leaving home to go to work]()
- 2512:00 a.m. to 4:59 a.m.
- 545:00 a.m. to 5:29 a.m.
- 175:30 a.m. to 5:59 a.m.
- 436:00 a.m. to 6:29 a.m.
- 226:30 a.m. to 6:59 a.m.
- 617:00 a.m. to 7:29 a.m.
- 337:30 a.m. to 7:59 a.m.
- 838:00 a.m. to 8:29 a.m.
- 258:30 a.m. to 8:59 a.m.
- 279:00 a.m. to 9:59 a.m.
- 2810:00 a.m. to 10:59 a.m.
- 1011:00 a.m. to 11:59 a.m.
- 4612:00 p.m. to 3:59 p.m.
- 314:00 p.m. to 11:59 p.m.

Occupations of males:
- Percentage of males in management occupations (except farmers):
Here: 3.0% city: 13.5%
- Percentage of males in architecture and engineering occupations:
Here: 10.7% city: 3.8%
- Percentage of males in service occupations:
Here: 6.7% city: 12.9%
- Percentage of males in sales and office occupations:
Here: 2.3% city: 13.4%
- Percentage of males in farming, fishing, and forestry occupations:
Here: 12.1% city: 0.4%
- Percentage of males in construction, extraction, and maintenance occupations:
Here: 22.6% city: 8.3%
- Percentage of males in production occupations:
Here: 7.1% city: 4.2%
- Percentage of males in transportation occupations:
Here: 17.0% city: 5.6%
Occupations of females:
- Percentage of females in management occupations (except farmers):
Here: 20.4% city: 15.1%
- Percentage of females in community and social services occupations:
Here: 21.7% city: 3.7%
- Percentage of females in education, training, and library occupations:
Here: 2.7% city: 8.4%
- Percentage of females in healthcare practitioners and technical occupations:
Here: 14.9% city: 6.7%
- Percentage of females in service occupations:
Here: 16.2% city: 17.8%
- Percentage of females in sales and office occupations:
Here: 21.2% city: 20.0%
- Percentage of females in transportation occupations:
Here: 1.1% city: 1.2%
Percentage of people 16-64 in Armed Forces:
| South Stonehurst: | 0.0% |
| Oakland: | 0.2% |
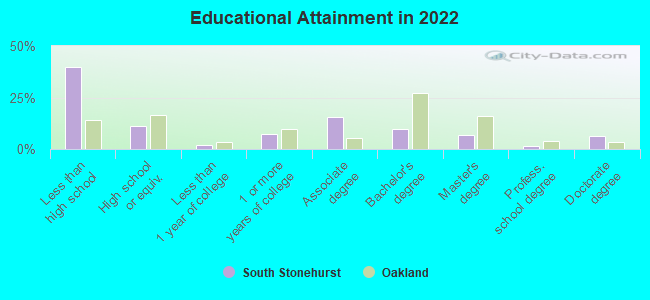
Education in this neighborhood (subdivision or community):
- Percentage of people 3 years and older in K-12 schools:
South Stonehurst: 19.4% Oakland: 13.0%
- Percentage of people 3 years and older in undergraduate colleges:
South Stonehurst: 10.1% Oakland: 4.3%
- Percentage of people 3 years and older in grad. or professional schools:
South Stonehurst: 2.0% Oakland: 1.8%
- Percentage of students K-12 enrolled in private schools:
South Stonehurst: 40.4% Oakland: 15.8%
Percentage of population below poverty level:
| South Stonehurst: | 17.6% |
| Oakland: | 13.9% |
Median year owner moved in (as recorded in 2022):
| South Stonehurst: | 2009 |
| Oakland: | 2010 |
Percentage of married-couple families with both working:
| South Stonehurst: | 88.9% |
| Oakland: | 73.2% |
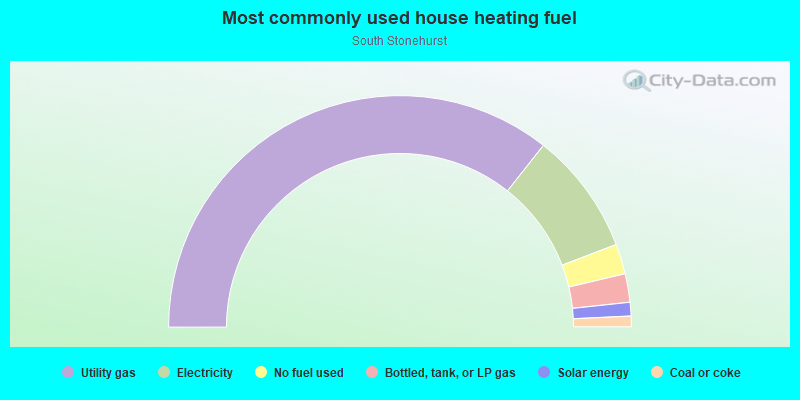
- 71.3%Utility gas
- 17.1%Electricity
- 4.2%No fuel used
- 4.0%Bottled, tank, or LP gas
- 1.9%Solar energy
- 1.5%Coal or coke
Roads and streets:
Pearmain St
Length: 0.60 miles
Directions: SE-NW, SW-NE
Address range: 9900 to 10899
Directions: SE-NW, SW-NE
Address range: 9900 to 10899
Pippin St
Length: 0.59 miles
Directions: N-S, SE-NW
Address range: 9826 to 10799
Directions: N-S, SE-NW
Address range: 9826 to 10799
Russet St
Length: 0.38 miles
Direction: SE-NW
Address range: 10500 to 10999
Direction: SE-NW
Address range: 10500 to 10999
105th Ave
Length: 0.17 miles
Directions: SE-NW, SW-NE
Address range: 750 to 849
Directions: SE-NW, SW-NE
Address range: 750 to 849
107th Ave
Length: 0.15 miles
Directions: E-W, SE-NW, SW-NE
Address range: 700 to 899
Directions: E-W, SE-NW, SW-NE
Address range: 700 to 899
Moorpark St
Length: 0.15 miles
Directions: SE-NW, SW-NE
Address range: 700 to 899
Directions: SE-NW, SW-NE
Address range: 700 to 899
Gravenstein St
Length: 0.14 miles
Direction: E-W
Address range: 700 to 799
Direction: E-W
Address range: 700 to 799
Apple St
Length: 0.11 miles
Direction: SW-NE
Address range: 750 to 848
Direction: SW-NE
Address range: 750 to 848
Stone St
Length: 0.10 miles
Direction: SW-NE
Address range: 700 to 849
Direction: SW-NE
Address range: 700 to 849
100th Ave
Length: 0.09 miles
Direction: SW-NE
Address range: 700 to 823
Direction: SW-NE
Address range: 700 to 823
Prune St
Length: 0.09 miles
Direction: SW-NE
Address range: 774 to 899
Direction: SW-NE
Address range: 774 to 899
Blenheim St
Length: 0.06 miles
Direction: SW-NE
Direction: SW-NE
106th Ave
Length: 0.06 miles
Direction: SW-NE
Direction: SW-NE
Tartarian St
Length: 0.05 miles
Direction: SW-NE
Address range: 700 to 799
Direction: SW-NE
Address range: 700 to 799
Douglas Ave
Length: 0.04 miles
Direction: SW-NE
Address range: 750 to 799
Direction: SW-NE
Address range: 750 to 799
Railroad features:
Union Pacific RR
Length: 0.62 miles
Direction: SE-NW
Direction: SE-NW
Bay Area Rapid Transit RR
Length: 0.41 miles
Direction: SE-NW
Direction: SE-NW