Grand Lake neighborhood in Oakland, California (CA), 94611, 94610 detailed profile
Settings
X

Business Search - 14 Million verified businesses
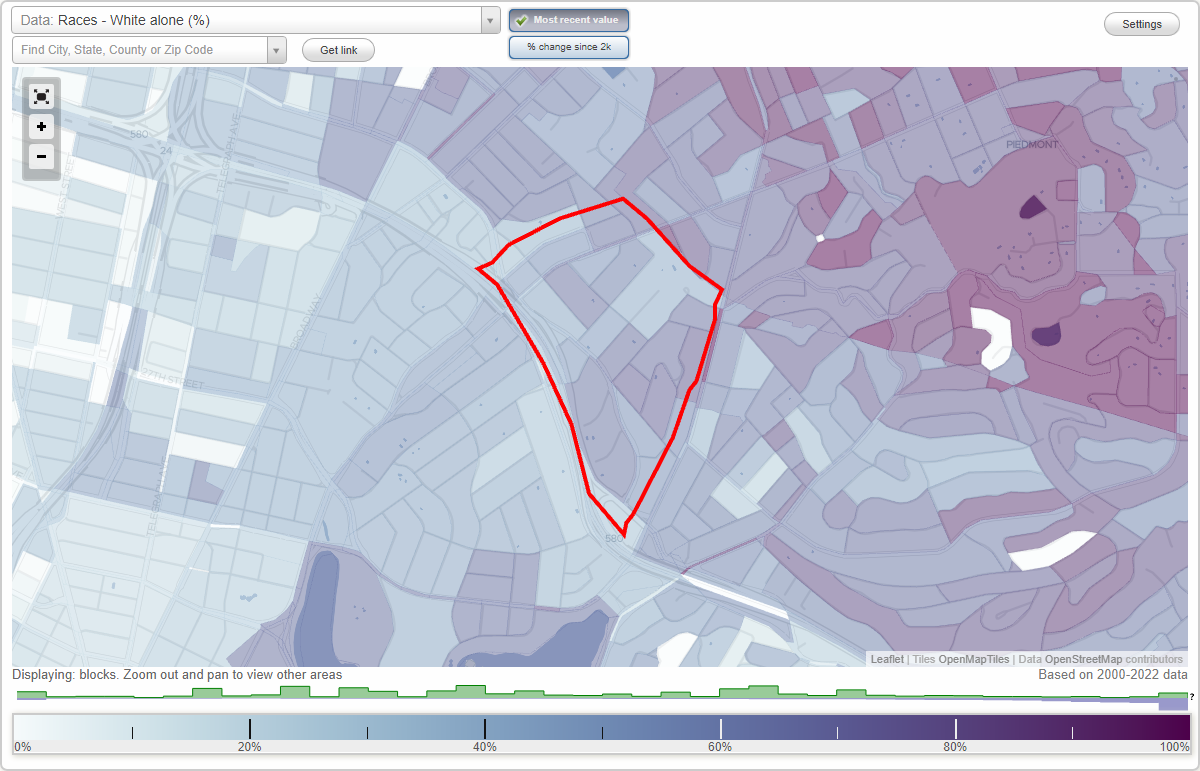
Area: 0.229 square miles
Population: 4,250
Population density:
| Grand Lake: | 18,519 people per square mile |
| Oakland: | 7,680 people per square mile |

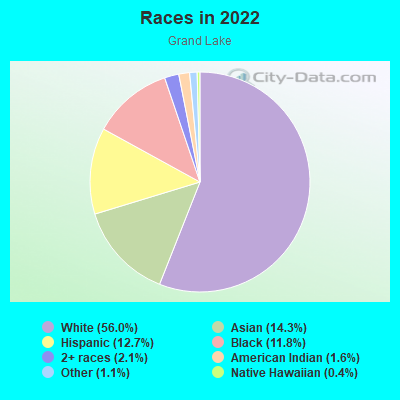
- 2,45356.0%White
- 62714.3%Asian
- 55712.7%Hispanic or Latino
- 51611.8%Black
- 932.1%Two or more races
- 691.6%American Indian
- 481.1%Some other race
- 190.4%Native Hawaiian and Other
Pacific Islander
Median household income in 2022:
| Grand Lake: | $129,637 |
| Oakland: | $93,146 |
Distribution of median household income
![Distribution of median household income]()
- 67Less than $10,000
- 357$10,000 to $19,999
- 281$20,000 to $29,999
- 287$30,000 to $39,999
- 169$40,000 to $49,999
- 97$50,000 to $59,999
- 295$60,000 to $74,999
- 252$75,000 to $99,999
- 180$100,000 to $124,999
- 292$125,000 to $149,999
- 297$150,000 to $199,999
- 606$200,000 or more

Distribution of owner-occupied house/condo value
![Distribution of owner-occupied house/condo value]()
- 9Less than $50,000
- 282$150,000 to $199,999
- 53$250,000 to $299,999
- 99$300,000 to $399,999
- 98$400,000 to $499,999
- 328$500,000 to $749,999
- 86$750,000 to $999,999
- 288$1,000,000 or more

Distribution of rent paid by renters
![Distribution of rent paid by renters]()
- 57$200 to $299
- 26$500 to $599
- 78$700 to $799
- 96$800 to $899
- 105$900 to $999
- 149$1,000 to $1,249
- 204$1,250 to $1,499
- 410$1,500 to $1,999
- 1,038$2,000 or more

Median rent in 2022:
| Grand Lake: | $2,019 |
| Oakland: | $1,741 |
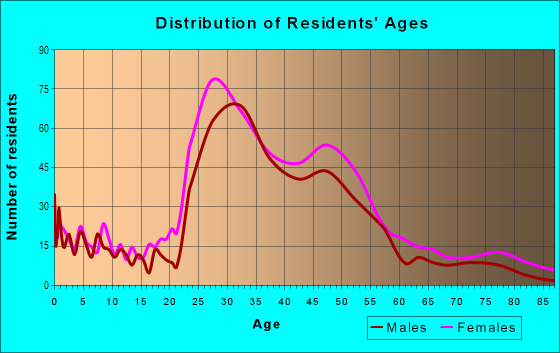
| Males: | 2,033 |
| Females: | 2,217 |
Males:
| This neighborhood: | 42.3 years |
| Whole city: | 38.3 years |
| This neighborhood: | 40.8 years |
| Whole city: | 39.1 years |
Average household size:
| Grand Lake: | 1.8 people |
| Oakland: | 2.4 people |
Percentage of family households:
| Grand Lake: | 26.9% |
| Oakland: | 37.1% |
| Here: | 28.3% |
| Oakland: | 34.9% |
Percentage of married-couple families with children (among all households):
| Grand Lake: | 49.8% |
| Oakland: | 28.3% |
Percentage of single-mother households (among all households):
| Grand Lake: | 7.5% |
| Oakland: | 9.9% |
Percentage of never married males 15 years old and over:
Percentage of never married females 15 years old and over:
| Grand Lake: | 21.3% |
| Oakland: | 24.6% |
Percentage of never married females 15 years old and over:
| Grand Lake: | 22.5% |
| city: | 21.9% |
Percentage of people that speak English not well or not at all:
| Grand Lake: | 1.0% |
| Oakland: | 10.6% |
Percentage of people born in this state:
Percentage of people born in another U.S. state:
Percentage of native residents but born outside the U.S.:
Percentage of foreign born residents:
| Here: | 49.1% |
| Oakland: | 49.9% |
Percentage of people born in another U.S. state:
| Grand Lake: | 31.0% |
| Oakland: | 22.3% |
Percentage of native residents but born outside the U.S.:
| Here: | 1.5% |
| city: | 1.6% |
Percentage of foreign born residents:
| Here: | 18.4% |
| Oakland: | 26.2% |
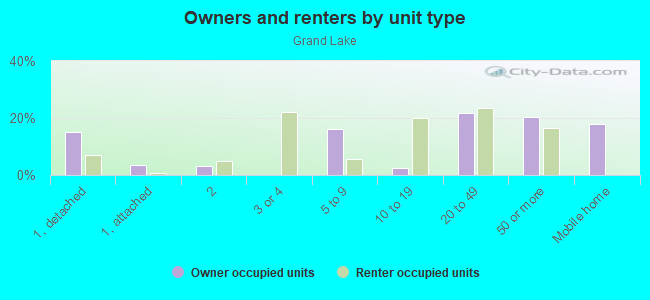
Owner-occupied
Renter-occupied

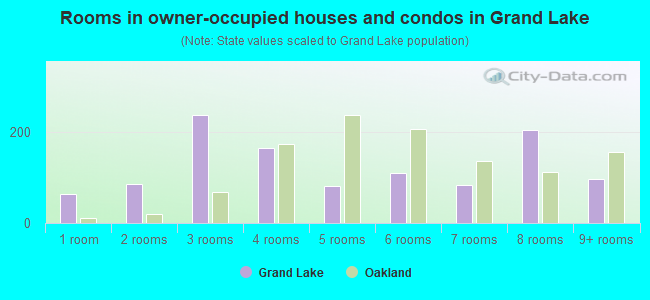
- Rooms in owner-occupied houses and condos in Grand Lake
- 631 room
- 852 rooms
- 2373 rooms
- 1644 rooms
- 815 rooms
- 1096 rooms
- 847 rooms
- 2048 rooms
- 969+ rooms
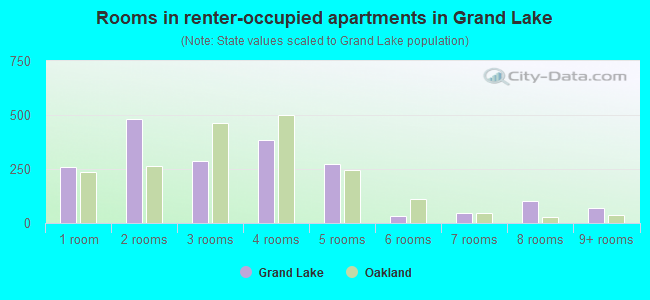
- Rooms in renter-occupied apartments in Grand Lake
- 2601 room
- 4822 rooms
- 2863 rooms
- 3834 rooms
- 2725 rooms
- 336 rooms
- 447 rooms
- 1048 rooms
- 699+ rooms
Owner-occupied
Renter-occupied
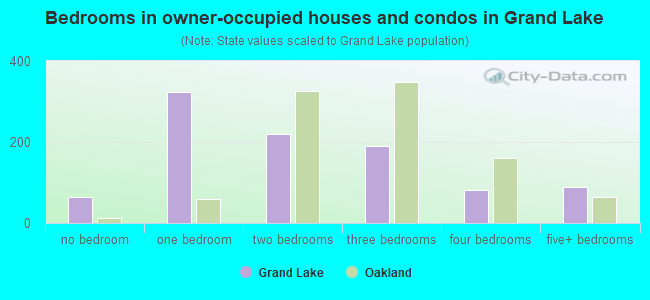
- Bedrooms in owner-occupied houses and condos in Grand Lake
- 63no bedroom
- 3241 bedroom
- 2202 bedrooms
- 1903 bedrooms
- 824 bedrooms
- 895+ bedrooms
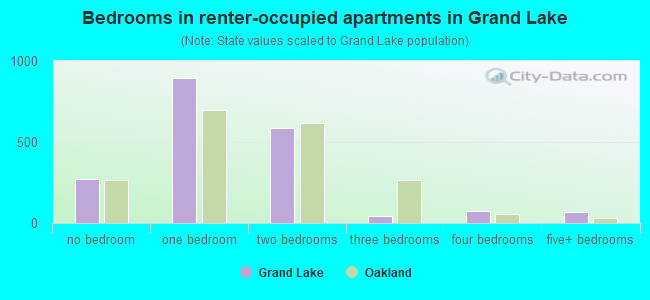
- Bedrooms in renter-occupied apartments in Grand Lake
- 271no bedroom
- 8921 bedroom
- 5882 bedrooms
- 443 bedrooms
- 734 bedrooms
- 695+ bedrooms
Average number of cars or other vehicles available in houses/condos:
Average number of cars or other vehicles available in apartments:
| This neighborhood: | |
| Oakland: |
Average number of cars or other vehicles available in apartments:
| Here: | 1.2 |
| city: | 1.1 |
Percentage of units with a mortgage:
| Grand Lake: | 75.9% |
| Oakland: | 71.2% |
Average estimated '22 value of housing units in 5-or-more-unit structures (20.5% of all units):
| Grand Lake: | $56,246 |
| Oakland: | $685,476 |
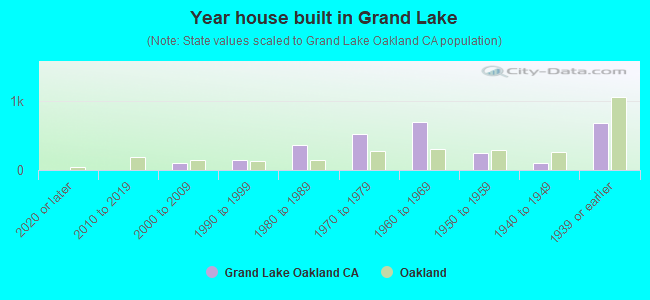
- Year house built in Grand Lake
- 02020 or later
- 02010 to 2019
- 1042000 to 2009
- 1481990 to 1999
- 3591980 to 1989
- 5161970 to 1979
- 6911960 to 1969
- 2391950 to 1959
- 1061940 to 1949
- 6841939 or earlier
City-data.com crime index for city in 2020 (higher means more crime):
| City: | 691.6 |
| U.S. average: | 219.5 |
Travel time to work (commute)
![Travel time to work (commute)]()
- 88Less than 5 minutes
- 1375 to 9 minutes
- 19510 to 14 minutes
- 36615 to 19 minutes
- 22520 to 24 minutes
- 14225 to 29 minutes
- 19030 to 34 minutes
- 3635 to 39 minutes
- 7340 to 44 minutes
- 34145 to 59 minutes
- 18760 to 89 minutes
- 10990 or more minutes

Means of transportation to work
![Means of transportation to work]()
- 37.7%944Drove a car alone
- 4.2%106Carpooled
- 12.0%301Bus
- 13.1%327Subway or elevated rail
- 2.9%73Long-distance train or commuter rail
- 1.7%43Light rail, streetcar or trolley
- 0.6%14Ferryboat
- 5.3%132Taxi
- 1.8%44Motorcycle
- 2.4%59Bicycle
- 6.5%162Walked
- 7.7%194Other means
- 28.3%708Worked at home

Time leaving home to go to work
![Time leaving home to go to work]()
- 6112:00 a.m. to 4:59 a.m.
- 365:00 a.m. to 5:29 a.m.
- 365:30 a.m. to 5:59 a.m.
- 1006:00 a.m. to 6:29 a.m.
- 1776:30 a.m. to 6:59 a.m.
- 2647:00 a.m. to 7:29 a.m.
- 2467:30 a.m. to 7:59 a.m.
- 2918:00 a.m. to 8:29 a.m.
- 2118:30 a.m. to 8:59 a.m.
- 4309:00 a.m. to 9:59 a.m.
- 12210:00 a.m. to 10:59 a.m.
- 2611:00 a.m. to 11:59 a.m.
- 7912:00 p.m. to 3:59 p.m.
- 1074:00 p.m. to 11:59 p.m.

Occupations of males:
- Percentage of males in management occupations (except farmers):
Here: 5.4% city: 13.5%
- Percentage of males in business and financial operations occupations:
Here: 11.4% city: 6.0%
- Percentage of males in computer and mathematical occupations:
Here: 7.8% city: 7.3%
- Percentage of males in architecture and engineering occupations:
Here: 6.2% city: 3.8%
- Percentage of males in life, physical, and social science occupations:
Here: 2.2% city: 2.0%
- Percentage of males in community and social services occupations:
Here: 1.3% city: 1.5%
- Percentage of males in legal occupations:
Here: 12.3% city: 1.9%
- Percentage of males in education, training, and library occupations:
Here: 4.3% city: 4.6%
- Percentage of males in arts, design, entertainment, sports, and media occupations:
Here: 6.0% city: 4.7%
- Percentage of males in healthcare practitioners and technical occupations:
Here: 3.9% city: 2.8%
- Percentage of males in service occupations:
Here: 9.8% city: 12.9%
- Percentage of males in sales and office occupations:
Here: 12.2% city: 13.4%
- Percentage of males in production occupations:
Here: 5.2% city: 4.2%
- Percentage of males in transportation occupations:
Here: 5.6% city: 5.6%
- Percentage of males in material moving occupations:
Here: 5.1% city: 4.5%
Occupations of females:
- Percentage of females in management occupations (except farmers):
Here: 25.3% city: 15.1%
- Percentage of females in business and financial operations occupations:
Here: 14.5% city: 8.2%
- Percentage of females in computer and mathematical occupations:
Here: 3.0% city: 3.0%
- Percentage of females in community and social services occupations:
Here: 3.8% city: 3.7%
- Percentage of females in legal occupations:
Here: 3.4% city: 2.5%
- Percentage of females in education, training, and library occupations:
Here: 12.0% city: 8.4%
- Percentage of females in arts, design, entertainment, sports, and media occupations:
Here: 8.2% city: 4.8%
- Percentage of females in healthcare practitioners and technical occupations:
Here: 5.1% city: 6.7%
- Percentage of females in service occupations:
Here: 11.7% city: 17.8%
- Percentage of females in sales and office occupations:
Here: 8.4% city: 20.0%
- Percentage of females in transportation occupations:
Here: 2.8% city: 1.2%
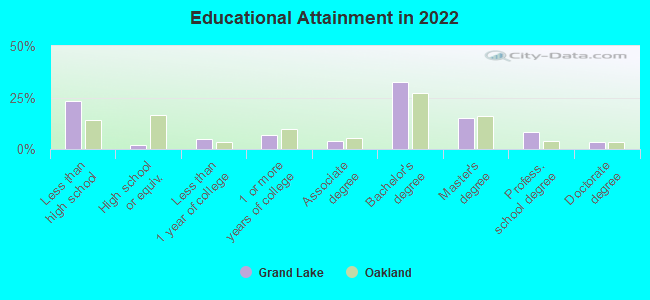
Education in this neighborhood (subdivision or community):
- Percentage of people 3 years and older in K-12 schools:
Grand Lake: 15.1% Oakland: 13.0%
- Percentage of people 3 years and older in undergraduate colleges:
Grand Lake: 3.8% Oakland: 4.3%
- Percentage of people 3 years and older in grad. or professional schools:
Grand Lake: 5.9% Oakland: 1.8%
- Percentage of students K-12 enrolled in private schools:
Grand Lake: 43.6% Oakland: 15.8%
Percentage of population below poverty level:
| Grand Lake: | 9.5% |
| Oakland: | 13.9% |
Median year renter moved in (as recorded in 2022):
| Grand Lake: | 2016 |
| Oakland: | 2018 |
Percentage of married-couple families with both working:
| Grand Lake: | 91.1% |
| Oakland: | 73.2% |
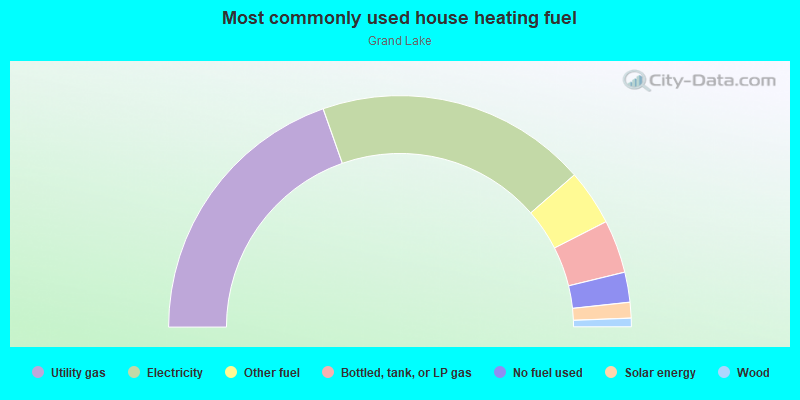
- 39.2%Utility gas
- 37.9%Electricity
- 7.8%Other fuel
- 7.4%Bottled, tank, or LP gas
- 4.2%No fuel used
- 2.2%Solar energy
- 1.2%Wood
Limited-access highways (interstate or state) in this neighborhood:
I- 580
Length: 0.35 miles
Directions: N-S, SE-NW
Directions: N-S, SE-NW
Roads and streets:
Santa Clara Ave
Length: 0.78 miles
Directions: E-W, N-S, SE-NW, SW-NE
Address range: 71 to 465
Directions: E-W, N-S, SE-NW, SW-NE
Address range: 71 to 465
Chetwood St
Length: 0.43 miles
Directions: E-W, SW-NE
Address range: 400 to 699
Directions: E-W, SW-NE
Address range: 400 to 699
Jean St
Length: 0.42 miles
Directions: E-W, N-S, SW-NE
Address range: 400 to 721
Directions: E-W, N-S, SW-NE
Address range: 400 to 721
Vernon St
Length: 0.42 miles
Directions: E-W, N-S, SE-NW, SW-NE
Address range: 450 to 699
Directions: E-W, N-S, SE-NW, SW-NE
Address range: 450 to 699
Harrison St
Length: 0.40 miles
Directions: E-W, SW-NE
Address range: 3480 to 3999
Directions: E-W, SW-NE
Address range: 3480 to 3999
Oakland Ave
Length: 0.40 miles
Directions: E-W, SW-NE
Address range: 500 to 751
Directions: E-W, SW-NE
Address range: 500 to 751
Valle Vista Ave
Length: 0.40 miles
Directions: E-W, N-S, SE-NW, SW-NE
Address range: 400 to 699
Directions: E-W, N-S, SE-NW, SW-NE
Address range: 400 to 699
Oakland
Length: 0.33 miles
Directions: E-W, SW-NE
Directions: E-W, SW-NE
Santa Rosa Ave
Length: 0.31 miles
Direction: SE-NW
Address range: 100 to 299
Direction: SE-NW
Address range: 100 to 299
Moss Ave
Length: 0.25 miles
Direction: SE-NW
Address range: 1 to 99
Direction: SE-NW
Address range: 1 to 99
Elwood Ave
Length: 0.22 miles
Direction: SE-NW
Address range: 300 to 459
Direction: SE-NW
Address range: 300 to 459
Mira Vista Ave
Length: 0.22 miles
Directions: E-W, N-S, SE-NW, SW-NE
Address range: 500 to 699
Directions: E-W, N-S, SE-NW, SW-NE
Address range: 500 to 699
Mariposa Ave
Length: 0.14 miles
Directions: N-S, SW-NE
Address range: 600 to 699
Directions: N-S, SW-NE
Address range: 600 to 699
Crescent St
Length: 0.12 miles
Directions: E-W, SW-NE
Address range: 400 to 499
Directions: E-W, SW-NE
Address range: 400 to 499
Alta Vista Ave
Length: 0.08 miles
Direction: SE-NW
Address range: 300 to 399
Direction: SE-NW
Address range: 300 to 399
Monte Vista Ave
Length: 0.07 miles
Direction: SE-NW
Address range: 400 to 799
Direction: SE-NW
Address range: 400 to 799
Sunnyslope Ave
Length: 0.07 miles
Direction: E-W
Address range: 400 to 424
Direction: E-W
Address range: 400 to 424
Bayo Vista Ave
Length: 0.06 miles
Direction: SE-NW
Address range: 120 to 199
Direction: SE-NW
Address range: 120 to 199
W Macarthur
Length: 0.04 miles
Direction: N-S
Direction: N-S
Adams
Length: 0.03 miles
Direction: E-W
Direction: E-W
W Macarthur Blvd (Macarthur Blvd)
Length: 0.02 miles
Direction: N-S
Address range: 1 to 64
Direction: N-S
Address range: 1 to 64
Interstate 580 E
Length: 0.01 miles
Direction: SE-NW
Direction: SE-NW