City Center neighborhood in Oakland, California (CA), 94607, 94612 detailed profile
Settings
X

Business Search - 14 Million verified businesses
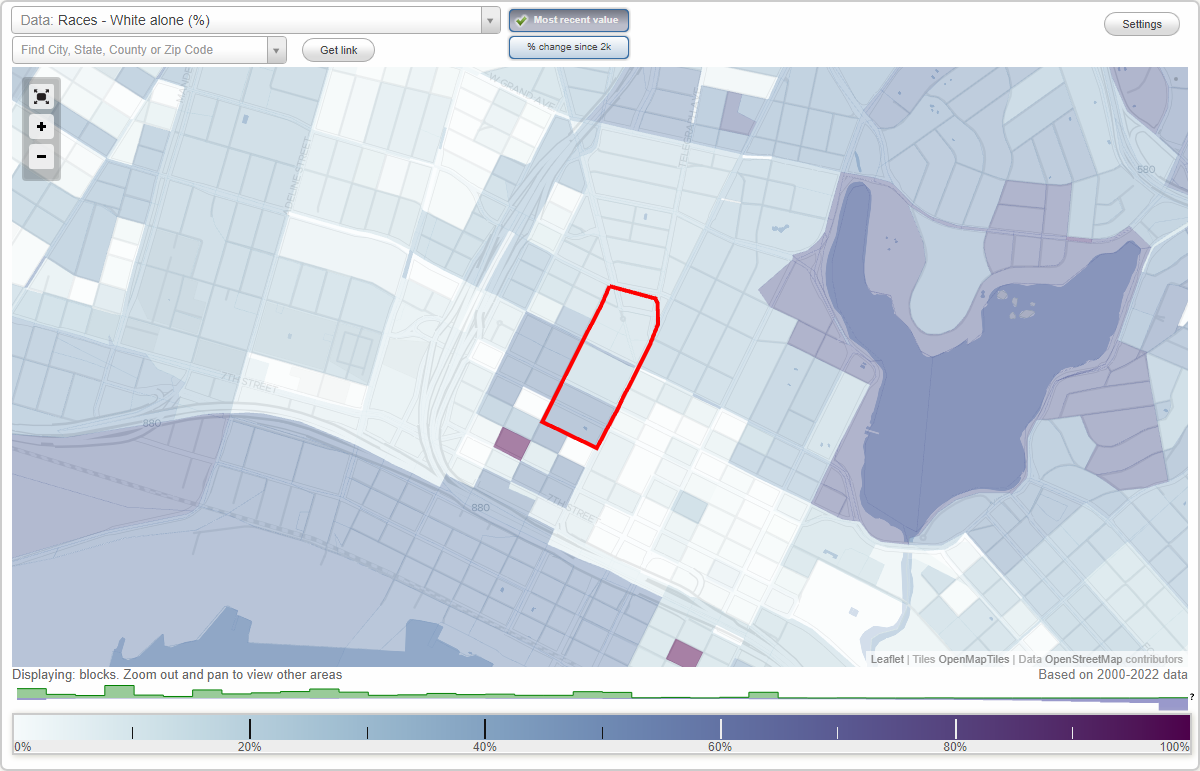
Area: 0.052 square miles
Population: 382
Population density:
| City Center: | 7,357 people per square mile |
| Oakland: | 7,680 people per square mile |

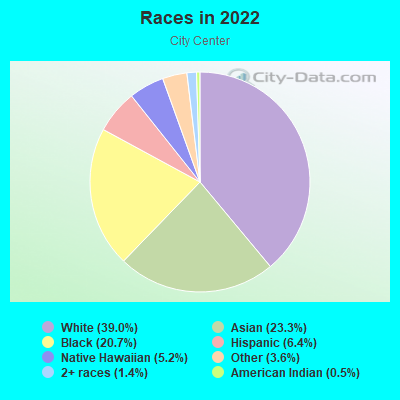
- 16439.0%White
- 9823.3%Asian
- 8720.7%Black
- 276.4%Hispanic or Latino
- 225.2%Native Hawaiian and Other
Pacific Islander - 153.6%Some other race
- 61.4%Two or more races
- 20.5%American Indian
Distribution of median household income
![Distribution of median household income]()
- 10Less than $10,000
- 7$10,000 to $19,999
- 32$20,000 to $29,999
- 19$30,000 to $39,999
- 22$40,000 to $49,999
- 13$50,000 to $59,999
- 7$60,000 to $74,999
- 17$75,000 to $99,999
- 21$100,000 to $124,999
- 31$125,000 to $149,999
- 10$150,000 to $199,999
- 83$200,000 or more

Distribution of owner-occupied house/condo value
![Distribution of owner-occupied house/condo value]()
- 4Less than $50,000
- 8$50,000 to $99,999
- 10$250,000 to $299,999
- 8$300,000 to $399,999
- 10$400,000 to $499,999
- 32$500,000 to $749,999
- 11$750,000 to $999,999
- 5$1,000,000 or more

Distribution of rent paid by renters
![Distribution of rent paid by renters]()
- 12Less than $100
- 6$100 to $199
- 22$200 to $299
- 27$300 to $399
- 61$400 to $499
- 17$500 to $599
- 7$600 to $699
- 6$700 to $799
- 4$800 to $899
- 4$900 to $999
- 9$1,000 to $1,249
- 18$1,250 to $1,499
- 53$1,500 to $1,999
- 136$2,000 or more

Median rent in 2022:
| City Center: | $2,767 |
| Oakland: | $1,741 |
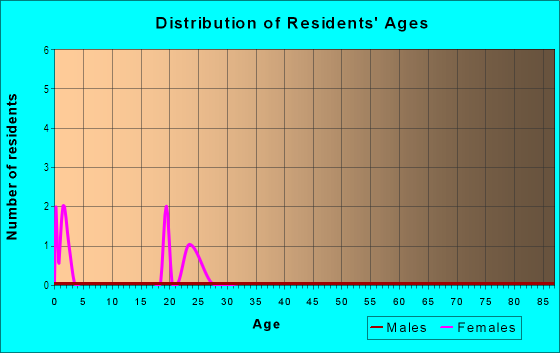
| Males: | 201 |
| Females: | 180 |
Males:
| This neighborhood: | 39.7 years |
| Whole city: | 38.3 years |
| This neighborhood: | 41.4 years |
| Whole city: | 39.1 years |
Average household size:
| City Center: | 1.7 people |
| Oakland: | 2.4 people |
Percentage of family households:
| City Center: | 23.7% |
| Oakland: | 37.1% |
| Here: | 17.9% |
| Oakland: | 34.9% |
Percentage of married-couple families with children (among all households):
| City Center: | 42.7% |
| Oakland: | 28.3% |
Percentage of single-mother households (among all households):
| City Center: | 45.3% |
| Oakland: | 9.9% |
Percentage of never married males 15 years old and over:
Percentage of never married females 15 years old and over:
| City Center: | 37.2% |
| Oakland: | 24.6% |
Percentage of never married females 15 years old and over:
| City Center: | 21.1% |
| city: | 21.9% |
Percentage of people that speak English not well or not at all:
| City Center: | 7.1% |
| Oakland: | 10.6% |
Percentage of people born in this state:
Percentage of people born in another U.S. state:
Percentage of native residents but born outside the U.S.:
Percentage of foreign born residents:
| Here: | 33.6% |
| Oakland: | 49.9% |
Percentage of people born in another U.S. state:
| City Center: | 33.1% |
| Oakland: | 22.3% |
Percentage of native residents but born outside the U.S.:
| Here: | 1.2% |
| city: | 1.6% |
Percentage of foreign born residents:
| Here: | 32.1% |
| Oakland: | 26.2% |

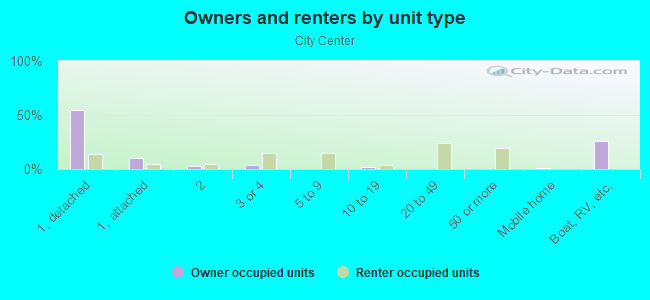
Owner-occupied
Renter-occupied

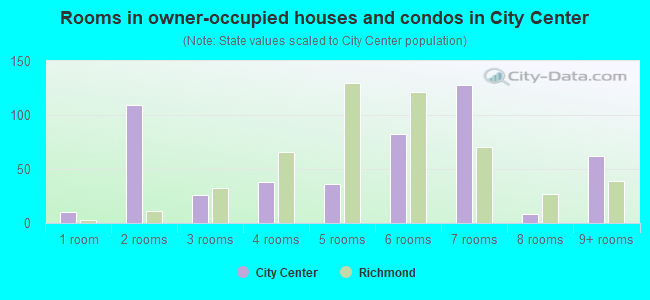
- Rooms in owner-occupied houses and condos in City Center
- 41 room
- 372 rooms
- 173 rooms
- 174 rooms
- 115 rooms
- 256 rooms
- 67 rooms
- 08 rooms
- 19+ rooms
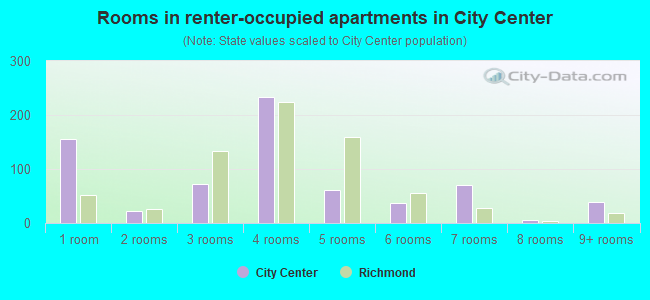
- Rooms in renter-occupied apartments in City Center
- 401 room
- 302 rooms
- 453 rooms
- 204 rooms
- 45 rooms
- 76 rooms
- 37 rooms
- 08 rooms
- 79+ rooms
Owner-occupied
Renter-occupied
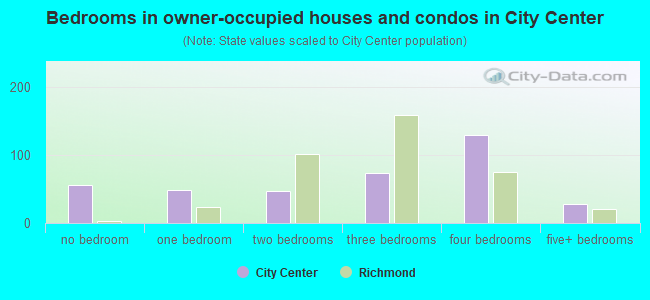
- Bedrooms in owner-occupied houses and condos in City Center
- 4no bedroom
- 111 bedroom
- 372 bedrooms
- 73 bedrooms
- 104 bedrooms
- 15+ bedrooms
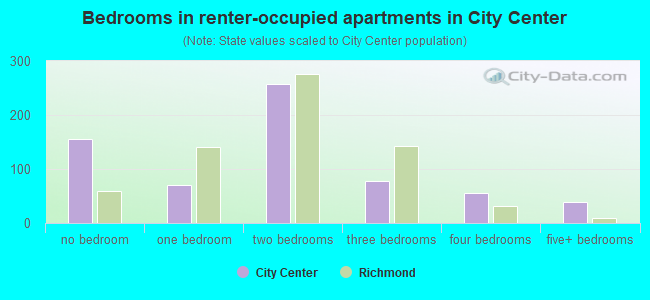
- Bedrooms in renter-occupied apartments in City Center
- 40no bedroom
- 621 bedroom
- 442 bedrooms
- 253 bedrooms
- 44 bedrooms
- 75+ bedrooms
Average number of cars or other vehicles available in houses/condos:
Average number of cars or other vehicles available in apartments:
| This neighborhood: | |
| Oakland: |
Average number of cars or other vehicles available in apartments:
| Here: | 0.8 |
| city: | 1.1 |
Percentage of units with a mortgage:
| City Center: | 80.4% |
| Oakland: | 71.2% |
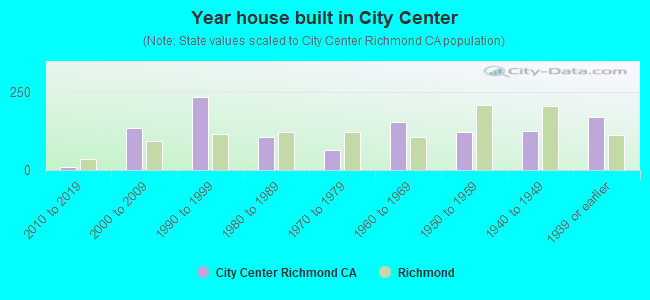
- Year house built in City Center
- 92020 or later
- 512010 to 2019
- 962000 to 2009
- 731990 to 1999
- 101980 to 1989
- 2571970 to 1979
- 131960 to 1969
- 21950 to 1959
- 81940 to 1949
- 191939 or earlier
City-data.com crime index for city in 2020 (higher means more crime):
| City: | 691.6 |
| U.S. average: | 219.5 |
Travel time to work (commute)
![Travel time to work (commute)]()
- 5Less than 5 minutes
- 75 to 9 minutes
- 810 to 14 minutes
- 1915 to 19 minutes
- 1920 to 24 minutes
- 3425 to 29 minutes
- 4430 to 34 minutes
- 335 to 39 minutes
- 1640 to 44 minutes
- 3045 to 59 minutes
- 1760 to 89 minutes
- 1090 or more minutes

Means of transportation to work
![Means of transportation to work]()
- 32.1%87Drove a car alone
- 2.2%6Carpooled
- 1.1%3Bus
- 24.7%67Subway or elevated rail
- 1.1%3Long-distance train or commuter rail
- 4.8%13Light rail, streetcar or trolley
- 3.3%9Ferryboat
- 1.8%5Taxi
- 1.8%5Bicycle
- 4.8%13Walked
- 1.5%4Other means
- 35.0%95Worked at home

Time leaving home to go to work
![Time leaving home to go to work]()
- 212:00 a.m. to 4:59 a.m.
- 25:00 a.m. to 5:29 a.m.
- 135:30 a.m. to 5:59 a.m.
- 116:00 a.m. to 6:29 a.m.
- 66:30 a.m. to 6:59 a.m.
- 357:00 a.m. to 7:29 a.m.
- 357:30 a.m. to 7:59 a.m.
- 498:00 a.m. to 8:29 a.m.
- 138:30 a.m. to 8:59 a.m.
- 219:00 a.m. to 9:59 a.m.
- 510:00 a.m. to 10:59 a.m.
- 311:00 a.m. to 11:59 a.m.
- 1212:00 p.m. to 3:59 p.m.
- 204:00 p.m. to 11:59 p.m.

Occupations of males:
- Percentage of males in management occupations (except farmers):
Here: 24.1% city: 13.5%
- Percentage of males in business and financial operations occupations:
Here: 15.9% city: 6.0%
- Percentage of males in computer and mathematical occupations:
Here: 17.0% city: 7.3%
- Percentage of males in architecture and engineering occupations:
Here: 2.2% city: 3.8%
- Percentage of males in life, physical, and social science occupations:
Here: 2.2% city: 2.0%
- Percentage of males in legal occupations:
Here: 2.4% city: 1.9%
- Percentage of males in education, training, and library occupations:
Here: 1.8% city: 4.6%
- Percentage of males in healthcare practitioners and technical occupations:
Here: 8.3% city: 2.8%
- Percentage of males in service occupations:
Here: 1.2% city: 12.9%
- Percentage of males in sales and office occupations:
Here: 22.1% city: 13.4%
- Percentage of males in construction, extraction, and maintenance occupations:
Here: 1.7% city: 8.3%
- Percentage of males in production occupations:
Here: 2.5% city: 4.2%
Occupations of females:
- Percentage of females in management occupations (except farmers):
Here: 10.0% city: 15.1%
- Percentage of females in business and financial operations occupations:
Here: 20.7% city: 8.2%
- Percentage of females in computer and mathematical occupations:
Here: 2.7% city: 3.0%
- Percentage of females in architecture and engineering occupations:
Here: 2.5% city: 1.6%
- Percentage of females in community and social services occupations:
Here: 3.2% city: 3.7%
- Percentage of females in legal occupations:
Here: 5.9% city: 2.5%
- Percentage of females in education, training, and library occupations:
Here: 9.3% city: 8.4%
- Percentage of females in arts, design, entertainment, sports, and media occupations:
Here: 3.9% city: 4.8%
- Percentage of females in healthcare practitioners and technical occupations:
Here: 16.2% city: 6.7%
- Percentage of females in service occupations:
Here: 9.1% city: 17.8%
- Percentage of females in sales and office occupations:
Here: 13.7% city: 20.0%
- Percentage of females in transportation occupations:
Here: 2.9% city: 1.2%
Education in this neighborhood (subdivision or community):
- Percentage of people 3 years and older in K-12 schools:
City Center: 28.2% Oakland: 13.0%
- Percentage of people 3 years and older in undergraduate colleges:
City Center: 4.3% Oakland: 4.3%
- Percentage of people 3 years and older in grad. or professional schools:
City Center: 6.2% Oakland: 1.8%
- Percentage of students K-12 enrolled in private schools:
City Center: 22.1% Oakland: 15.8%
Percentage of population below poverty level:
| City Center: | 17.1% |
| Oakland: | 13.9% |
Median year renter moved in (as recorded in 2022):
| City Center: | 2016 |
| Oakland: | 2018 |
Percentage of married-couple families with both working:
| City Center: | 67.6% |
| Oakland: | 73.2% |
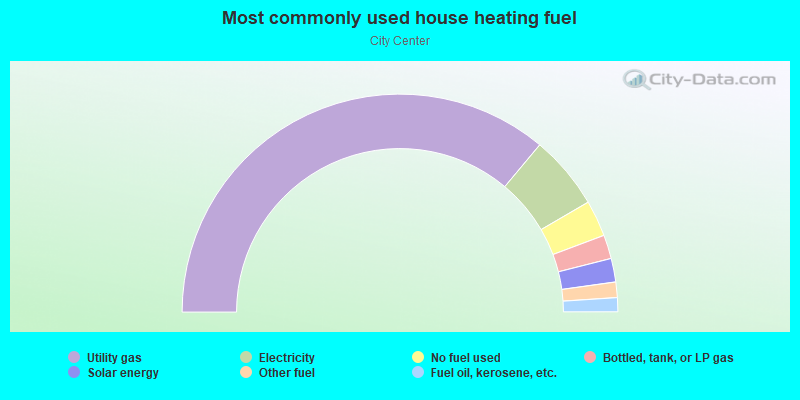
- 59.1%Electricity
- 27.1%Utility gas
- 4.7%No fuel used
- 3.9%Other fuel
- 2.9%Coal or coke
- 2.4%Bottled, tank, or LP gas
Roads and streets:
Broadway
Length: 0.37 miles
Direction: SW-NE
Address range: 1100 to 1499
Direction: SW-NE
Address range: 1100 to 1499
San Pablo
Length: 0.14 miles
Direction: N-S
Direction: N-S
Frank H Ogawa Plz
Length: 0.11 miles
Directions: N-S, SE-NW
Address range: 1 to 299
Directions: N-S, SE-NW
Address range: 1 to 299
16th St
Length: 0.11 miles
Directions: E-W, SE-NW
Address range: 500 to 543
Directions: E-W, SE-NW
Address range: 500 to 543
11th St
Length: 0.10 miles
Directions: E-W, SE-NW
Directions: E-W, SE-NW
14th
Length: 0.10 miles
Directions: E-W, SE-NW
Directions: E-W, SE-NW
14th St
Length: 0.10 miles
Direction: E-W
Address range: 444 to 499
Direction: E-W
Address range: 444 to 499
15th St
Length: 0.09 miles
Directions: E-W, SE-NW
Address range: 444 to 499
Directions: E-W, SE-NW
Address range: 444 to 499
Washington St (City Hall Plz, San Pablo Ave)
Length: 0.08 miles
Direction: SW-NE
Address range: 1 to 1598
Direction: SW-NE
Address range: 1 to 1598
Telegraph Ave
Length: 0.06 miles
Direction: N-S
Address range: 1500 to 1599
Direction: N-S
Address range: 1500 to 1599
San Pablo Ave
Length: 0.04 miles
Directions: N-S, SE-NW
Directions: N-S, SE-NW
16th
Length: 0.01 miles
Direction: E-W
Direction: E-W