Fruitvale Station neighborhood in Oakland, California (CA), 94601 detailed profile
Settings
X

Business Search - 14 Million verified businesses
Area: 0.167 square miles
Population: 803
Population density:
| Fruitvale Station: | 4,813 people per square mile |
| Oakland: | 7,680 people per square mile |

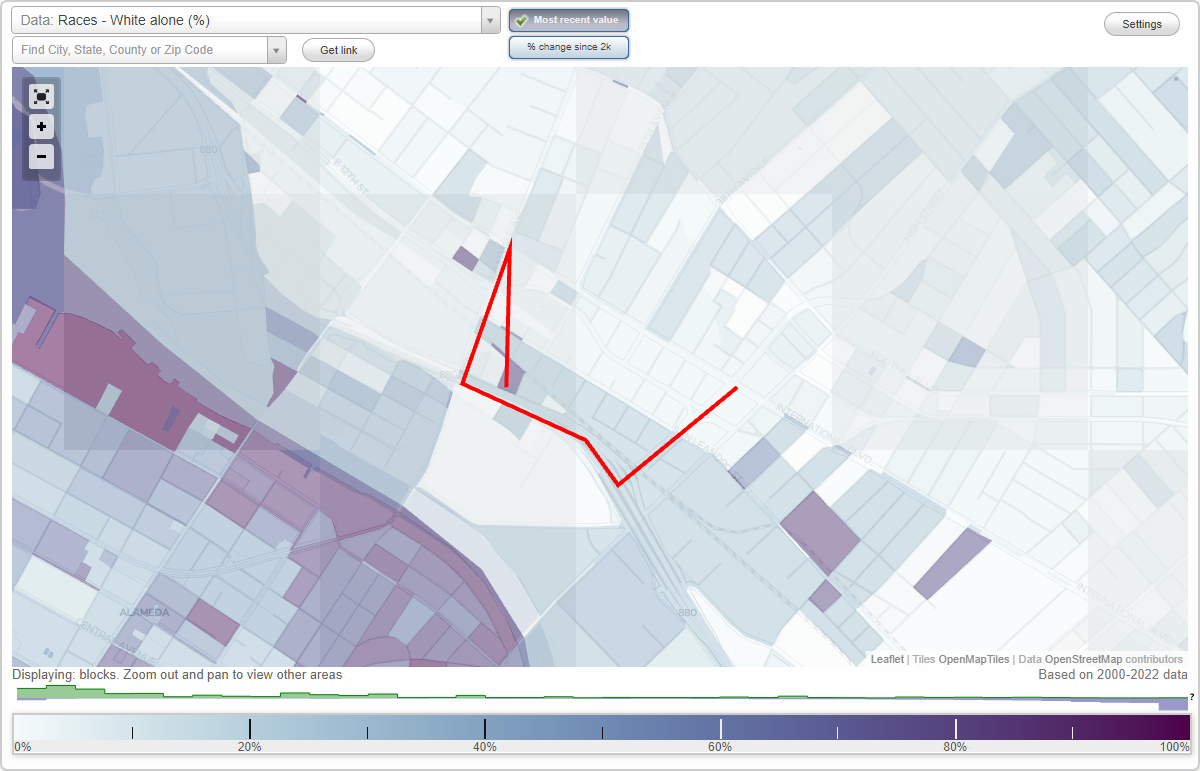
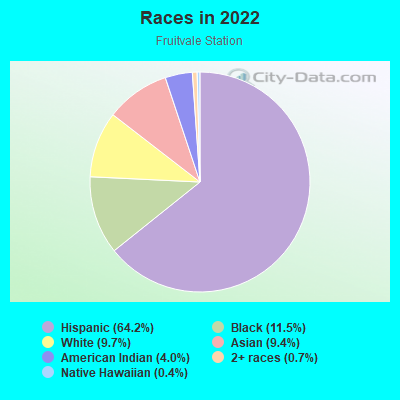
- 52364.2%Hispanic or Latino
- 9411.5%Black
- 799.7%White
- 779.4%Asian
- 334.0%American Indian
- 60.7%Two or more races
- 30.4%Native Hawaiian and Other
Pacific Islander
Median household income in 2022:
| Fruitvale Station: | $44,702 |
| Oakland: | $93,146 |
Distribution of median household income
![Distribution of median household income]()
- 25Less than $10,000
- 132$10,000 to $19,999
- 62$20,000 to $29,999
- 26$30,000 to $39,999
- 15$40,000 to $49,999
- 12$50,000 to $59,999
- 62$60,000 to $74,999
- 22$75,000 to $99,999
- 5$100,000 to $124,999
- 41$125,000 to $149,999
- 21$150,000 to $199,999
- 36$200,000 or more

Distribution of owner-occupied house/condo value
![Distribution of owner-occupied house/condo value]()
- 2$50,000 to $99,999
- 2$250,000 to $299,999
- 30$300,000 to $399,999
- 11$400,000 to $499,999
- 8$500,000 to $749,999
- 12$750,000 to $999,999
- 8$1,000,000 or more

Distribution of rent paid by renters
![Distribution of rent paid by renters]()
- 2$100 to $199
- 21$200 to $299
- 18$300 to $399
- 80$400 to $499
- 25$500 to $599
- 8$600 to $699
- 4$800 to $899
- 2$900 to $999
- 47$1,000 to $1,249
- 10$1,250 to $1,499
- 50$1,500 to $1,999
- 93$2,000 or more

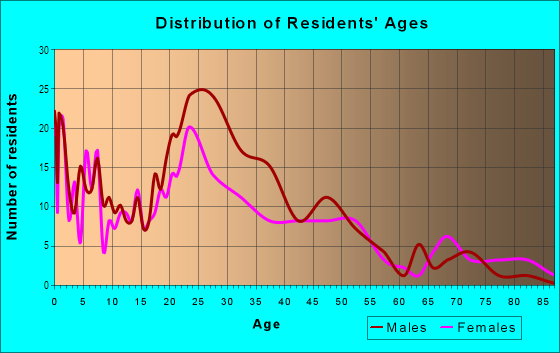
| Males: | 468 |
| Females: | 334 |
Males:
| This neighborhood: | 40.4 years |
| Whole city: | 38.3 years |
| This neighborhood: | 30.6 years |
| Whole city: | 39.1 years |
Average household size:
| Fruitvale Station: | 2.8 people |
| Oakland: | 2.4 people |
Percentage of family households:
| Fruitvale Station: | 40.3% |
| Oakland: | 37.1% |
| Here: | 33.8% |
| Oakland: | 34.9% |
Percentage of married-couple families with children (among all households):
| Fruitvale Station: | 29.9% |
| Oakland: | 28.3% |
Percentage of single-mother households (among all households):
| Fruitvale Station: | 13.3% |
| Oakland: | 9.9% |
Percentage of never married males 15 years old and over:
Percentage of never married females 15 years old and over:
| Fruitvale Station: | 28.7% |
| Oakland: | 24.6% |
Percentage of never married females 15 years old and over:
| Fruitvale Station: | 14.3% |
| city: | 21.9% |
Percentage of people that speak English not well or not at all:
| Fruitvale Station: | 11.0% |
| Oakland: | 10.6% |
Percentage of people born in this state:
Percentage of people born in another U.S. state:
Percentage of native residents but born outside the U.S.:
Percentage of foreign born residents:
| Here: | 56.9% |
| Oakland: | 49.9% |
Percentage of people born in another U.S. state:
| Fruitvale Station: | 12.2% |
| Oakland: | 22.3% |
Percentage of native residents but born outside the U.S.:
| Here: | 1.0% |
| city: | 1.6% |
Percentage of foreign born residents:
| Here: | 29.9% |
| Oakland: | 26.2% |
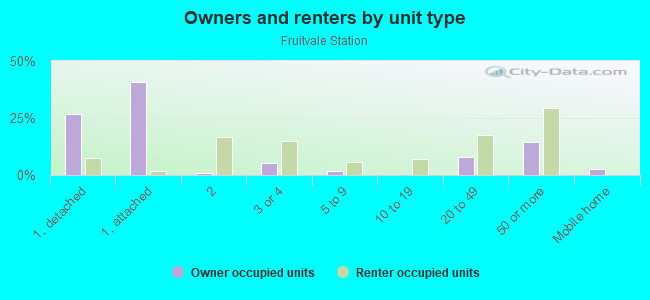
Owner-occupied
Renter-occupied

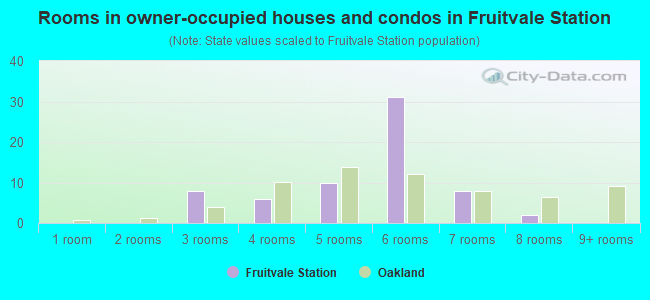
- Rooms in owner-occupied houses and condos in Fruitvale Station
- 01 room
- 02 rooms
- 83 rooms
- 64 rooms
- 105 rooms
- 316 rooms
- 87 rooms
- 28 rooms
- 09+ rooms
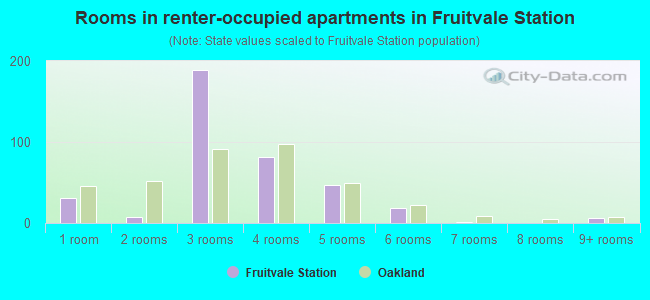
- Rooms in renter-occupied apartments in Fruitvale Station
- 311 room
- 72 rooms
- 1893 rooms
- 824 rooms
- 475 rooms
- 186 rooms
- 17 rooms
- 08 rooms
- 69+ rooms
Owner-occupied
Renter-occupied
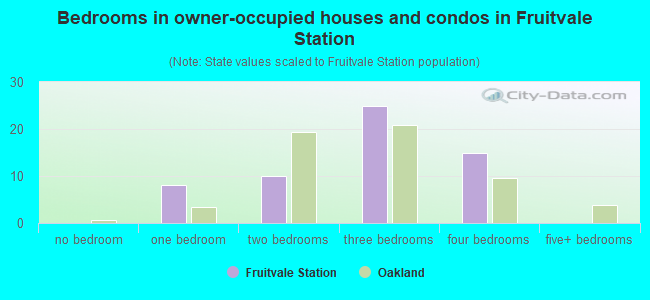
- Bedrooms in owner-occupied houses and condos in Fruitvale Station
- 0no bedroom
- 81 bedroom
- 102 bedrooms
- 253 bedrooms
- 154 bedrooms
- 05+ bedrooms
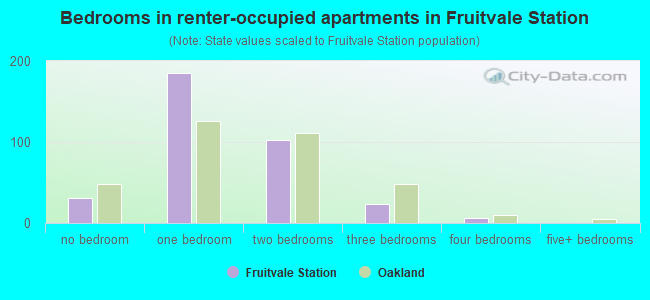
- Bedrooms in renter-occupied apartments in Fruitvale Station
- 31no bedroom
- 1851 bedroom
- 1032 bedrooms
- 243 bedrooms
- 64 bedrooms
- 05+ bedrooms
Average number of cars or other vehicles available in houses/condos:
Average number of cars or other vehicles available in apartments:
| This neighborhood: | 2.1 |
| Oakland: | 1.8 |
Average number of cars or other vehicles available in apartments:
| Here: | 1.0 |
| city: | 1.1 |
Percentage of units with a mortgage:
| Fruitvale Station: | 82.6% |
| Oakland: | 71.2% |
Average estimated value of detached houses in 2022 (21.7% of all units):
| Fruitvale Station: | $788,967 |
| Oakland: | $1,000,874 |
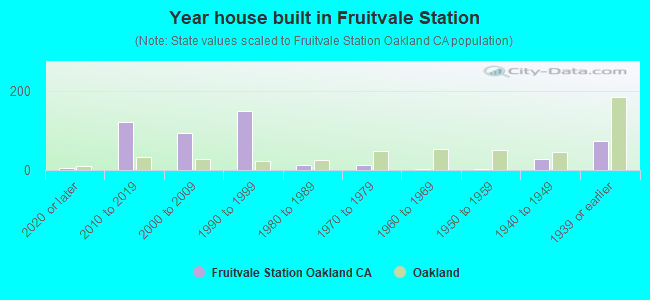
- Year house built in Fruitvale Station
- 52020 or later
- 1222010 to 2019
- 952000 to 2009
- 1491990 to 1999
- 121980 to 1989
- 131970 to 1979
- 21960 to 1969
- 31950 to 1959
- 281940 to 1949
- 751939 or earlier
City-data.com crime index for city in 2020 (higher means more crime):
| City: | 691.6 |
| U.S. average: | 219.5 |
Travel time to work (commute)
![Travel time to work (commute)]()
- 14Less than 5 minutes
- 335 to 9 minutes
- 3410 to 14 minutes
- 2215 to 19 minutes
- 3020 to 24 minutes
- 3725 to 29 minutes
- 5030 to 34 minutes
- 435 to 39 minutes
- 540 to 44 minutes
- 1945 to 59 minutes
- 1960 to 89 minutes
- 1390 or more minutes

Means of transportation to work
![Means of transportation to work]()
- 58.0%192Drove a car alone
- 6.9%23Carpooled
- 7.3%24Bus
- 15.1%50Subway or elevated rail
- 1.5%5Ferryboat
- 2.4%8Taxi
- 2.1%7Bicycle
- 13.6%45Walked
- 0.3%1Other means
- 7.6%25Worked at home

Time leaving home to go to work
![Time leaving home to go to work]()
- 3412:00 a.m. to 4:59 a.m.
- 135:00 a.m. to 5:29 a.m.
- 15:30 a.m. to 5:59 a.m.
- 426:00 a.m. to 6:29 a.m.
- 36:30 a.m. to 6:59 a.m.
- 357:00 a.m. to 7:29 a.m.
- 387:30 a.m. to 7:59 a.m.
- 378:00 a.m. to 8:29 a.m.
- 228:30 a.m. to 8:59 a.m.
- 99:00 a.m. to 9:59 a.m.
- 1510:00 a.m. to 10:59 a.m.
- 1911:00 a.m. to 11:59 a.m.
- 1512:00 p.m. to 3:59 p.m.
- 74:00 p.m. to 11:59 p.m.

Occupations of males:
- Percentage of males in management occupations (except farmers):
Here: 8.6% city: 13.5%
- Percentage of males in business and financial operations occupations:
Here: 2.0% city: 6.0%
- Percentage of males in computer and mathematical occupations:
Here: 2.5% city: 7.3%
- Percentage of males in architecture and engineering occupations:
Here: 4.7% city: 3.8%
- Percentage of males in life, physical, and social science occupations:
Here: 1.6% city: 2.0%
- Percentage of males in community and social services occupations:
Here: 2.3% city: 1.5%
- Percentage of males in legal occupations:
Here: 5.1% city: 1.9%
- Percentage of males in education, training, and library occupations:
Here: 3.4% city: 4.6%
- Percentage of males in arts, design, entertainment, sports, and media occupations:
Here: 7.3% city: 4.7%
- Percentage of males in service occupations:
Here: 28.3% city: 12.9%
- Percentage of males in sales and office occupations:
Here: 8.6% city: 13.4%
- Percentage of males in construction, extraction, and maintenance occupations:
Here: 15.3% city: 8.3%
- Percentage of males in production occupations:
Here: 1.2% city: 4.2%
- Percentage of males in transportation occupations:
Here: 1.1% city: 5.6%
- Percentage of males in material moving occupations:
Here: 14.4% city: 4.5%
Occupations of females:
- Percentage of females in management occupations (except farmers):
Here: 8.1% city: 15.1%
- Percentage of females in business and financial operations occupations:
Here: 8.9% city: 8.2%
- Percentage of females in computer and mathematical occupations:
Here: 2.0% city: 3.0%
- Percentage of females in architecture and engineering occupations:
Here: 3.9% city: 1.6%
- Percentage of females in life, physical, and social science occupations:
Here: 6.9% city: 2.3%
- Percentage of females in community and social services occupations:
Here: 3.7% city: 3.7%
- Percentage of females in education, training, and library occupations:
Here: 12.7% city: 8.4%
- Percentage of females in arts, design, entertainment, sports, and media occupations:
Here: 4.9% city: 4.8%
- Percentage of females in healthcare practitioners and technical occupations:
Here: 13.4% city: 6.7%
- Percentage of females in service occupations:
Here: 40.9% city: 17.8%
- Percentage of females in sales and office occupations:
Here: 63.6% city: 20.0%
- Percentage of females in production occupations:
Here: 4.5% city: 2.4%
- Percentage of females in transportation occupations:
Here: 10.9% city: 1.2%
- Percentage of females in material moving occupations:
Here: 3.6% city: 1.7%
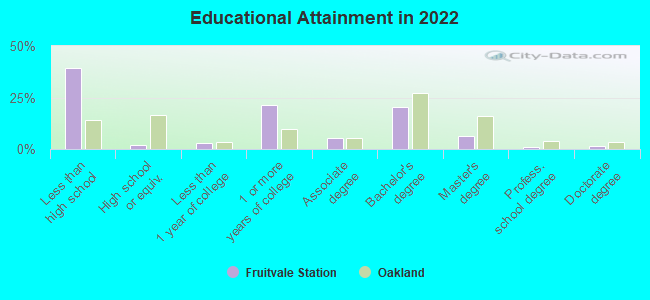
Education in this neighborhood (subdivision or community):
- Percentage of people 3 years and older in K-12 schools:
Fruitvale Station: 26.1% Oakland: 13.0%
- Percentage of people 3 years and older in undergraduate colleges:
Fruitvale Station: 9.3% Oakland: 4.3%
- Percentage of people 3 years and older in grad. or professional schools:
Fruitvale Station: 1.1% Oakland: 1.8%
- Percentage of students K-12 enrolled in private schools:
Fruitvale Station: 53.7% Oakland: 15.8%
Percentage of population below poverty level:
| Fruitvale Station: | 17.0% |
| Oakland: | 13.9% |
Median year owner moved in (as recorded in 2022):
Median year renter moved in (as recorded in 2022):
| Fruitvale Station: | 1996 |
| Oakland: | 2010 |
Median year renter moved in (as recorded in 2022):
| Fruitvale Station: | 2016 |
| Oakland: | 2018 |
Percentage of married-couple families with both working:
| Fruitvale Station: | 121.7% |
| Oakland: | 73.2% |
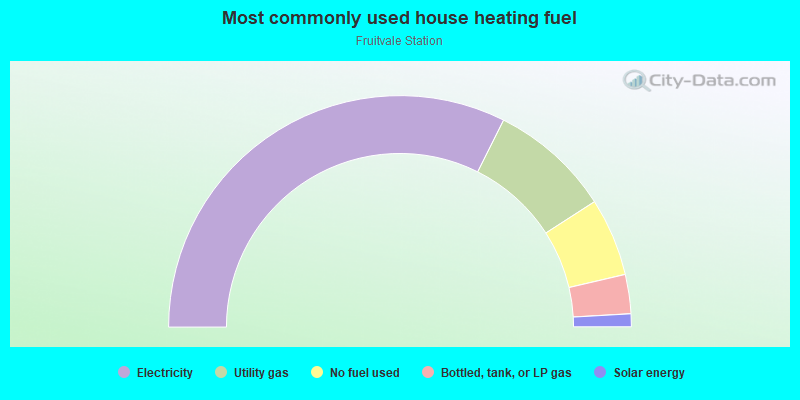
- 64.8%Electricity
- 17.0%Utility gas
- 10.9%No fuel used
- 5.5%Bottled, tank, or LP gas
- 1.8%Solar energy
Limited-access highways (interstate or state) in this neighborhood:
State Hwy 77
Length: 0.27 miles
Directions: E-W, N-S, SE-NW, SW-NE
Directions: E-W, N-S, SE-NW, SW-NE
Roads and streets:
San Leandro
Length: 0.62 miles
Directions: E-W, SE-NW
Directions: E-W, SE-NW
E 12th St
Length: 0.61 miles
Directions: E-W, SE-NW
Address range: 3300 to 4199
Directions: E-W, SE-NW
Address range: 3300 to 4199
San Leandro St
Length: 0.58 miles
Direction: SE-NW
Address range: 3301 to 4121
Direction: SE-NW
Address range: 3301 to 4121
International Blvd
Length: 0.52 miles
Directions: E-W, SE-NW
Directions: E-W, SE-NW
E 12th
Length: 0.35 miles
Direction: SE-NW
Direction: SE-NW
37th Ave
Length: 0.29 miles
Directions: E-W, N-S, SW-NE
Address range: 800 to 1387
Directions: E-W, N-S, SW-NE
Address range: 800 to 1387
35th Ave
Length: 0.28 miles
Direction: SW-NE
Address range: 800 to 1367
Direction: SW-NE
Address range: 800 to 1367
E 9th St
Length: 0.26 miles
Direction: E-W
Address range: 3300 to 3699
Direction: E-W
Address range: 3300 to 3699
39th Ave
Length: 0.26 miles
Direction: SW-NE
Address range: 900 to 1387
Direction: SW-NE
Address range: 900 to 1387
38th Ave
Length: 0.25 miles
Direction: SW-NE
Address range: 900 to 1386
Direction: SW-NE
Address range: 900 to 1386
33rd Ave
Length: 0.22 miles
Directions: N-S, SW-NE
Address range: 800 to 1377
Directions: N-S, SW-NE
Address range: 800 to 1377
34th Ave
Length: 0.19 miles
Direction: SW-NE
Address range: 800 to 1371
Direction: SW-NE
Address range: 800 to 1371
41st Ave
Length: 0.19 miles
Directions: E-W, N-S, SW-NE
Address range: 1101 to 1383
Directions: E-W, N-S, SW-NE
Address range: 1101 to 1383
42nd
Length: 0.19 miles
Directions: E-W, SW-NE
Directions: E-W, SW-NE
36th Ave
Length: 0.18 miles
Direction: SW-NE
Address range: 800 to 1383
Direction: SW-NE
Address range: 800 to 1383
Wattling St
Length: 0.18 miles
Direction: SE-NW
Address range: 3800 to 4099
Direction: SE-NW
Address range: 3800 to 4099
35th
Length: 0.18 miles
Directions: N-S, SW-NE
Directions: N-S, SW-NE
40th Ave
Length: 0.16 miles
Directions: SE-NW, SW-NE
Address range: 900 to 1199
Directions: SE-NW, SW-NE
Address range: 900 to 1199
Railroad features:
Bay Area Rapid Transit RR
Length: 1.19 miles
Direction: SE-NW
Direction: SE-NW
Union Pacific RR
Length: 0.54 miles
Direction: SE-NW
Direction: SE-NW