Cox neighborhood in Oakland, California (CA), 94603 detailed profile
Settings
X

Business Search - 14 Million verified businesses
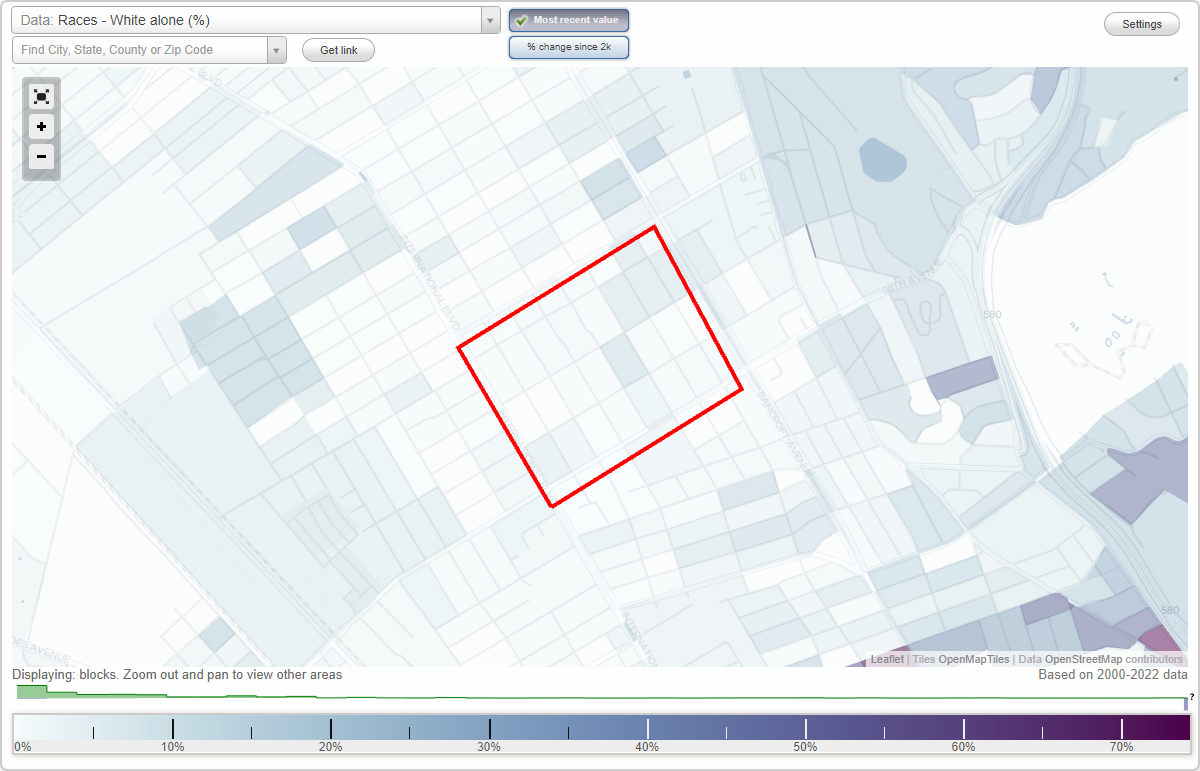
Area: 0.230 square miles
Population: 5,905
Population density:
| Cox: | 25,696 people per square mile |
| Oakland: | 7,680 people per square mile |

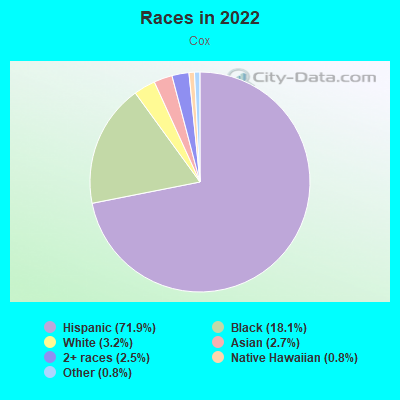
- 4,33771.9%Hispanic or Latino
- 1,09018.1%Black
- 1963.2%White
- 1612.7%Asian
- 1502.5%Two or more races
- 510.8%Native Hawaiian and Other
Pacific Islander - 500.8%Some other race
Distribution of median household income
![Distribution of median household income]()
- 84Less than $10,000
- 289$10,000 to $19,999
- 268$20,000 to $29,999
- 335$30,000 to $39,999
- 232$40,000 to $49,999
- 310$50,000 to $59,999
- 115$60,000 to $74,999
- 171$75,000 to $99,999
- 179$100,000 to $124,999
- 94$125,000 to $149,999
- 124$150,000 to $199,999
- 188$200,000 or more

Distribution of owner-occupied house/condo value
![Distribution of owner-occupied house/condo value]()
- 71Less than $50,000
- 47$50,000 to $99,999
- 25$100,000 to $149,999
- 101$150,000 to $199,999
- 161$200,000 to $249,999
- 25$250,000 to $299,999
- 64$300,000 to $399,999
- 96$400,000 to $499,999
- 272$500,000 to $749,999
- 132$750,000 to $999,999
- 48$1,000,000 or more

Distribution of rent paid by renters
![Distribution of rent paid by renters]()
- 21Less than $100
- 320$100 to $199
- 257$200 to $299
- 95$300 to $399
- 48$400 to $499
- 138$500 to $599
- 80$600 to $699
- 45$700 to $799
- 71$800 to $899
- 35$900 to $999
- 175$1,000 to $1,249
- 151$1,250 to $1,499
- 346$1,500 to $1,999
- 466$2,000 or more

Median rent in 2022:
| Cox: | $1,488 |
| Oakland: | $1,741 |
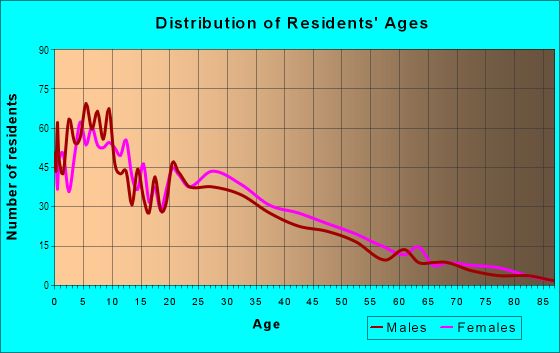
| Males: | 3,109 |
| Females: | 2,795 |
Males:
| This neighborhood: | 32.5 years |
| Whole city: | 38.3 years |
| This neighborhood: | 29.2 years |
| Whole city: | 39.1 years |
Average household size:
| Cox: | 3.4 people |
| Oakland: | 2.4 people |
Percentage of family households:
| Cox: | 62.2% |
| Oakland: | 37.1% |
| Here: | 41.3% |
| Oakland: | 34.9% |
Percentage of married-couple families with children (among all households):
| Cox: | 19.1% |
| Oakland: | 28.3% |
Percentage of single-mother households (among all households):
| Cox: | 8.0% |
| Oakland: | 9.9% |
Percentage of never married males 15 years old and over:
Percentage of never married females 15 years old and over:
| Cox: | 30.2% |
| Oakland: | 24.6% |
Percentage of never married females 15 years old and over:
| Cox: | 20.9% |
| city: | 21.9% |
Percentage of people that speak English not well or not at all:
| Cox: | 13.6% |
| Oakland: | 10.6% |
Percentage of people born in this state:
Percentage of people born in another U.S. state:
Percentage of native residents but born outside the U.S.:
Percentage of foreign born residents:
| Here: | 54.7% |
| Oakland: | 49.9% |
Percentage of people born in another U.S. state:
| Cox: | 6.8% |
| Oakland: | 22.3% |
Percentage of native residents but born outside the U.S.:
| Here: | 1.1% |
| city: | 1.6% |
Percentage of foreign born residents:
| Here: | 37.5% |
| Oakland: | 26.2% |
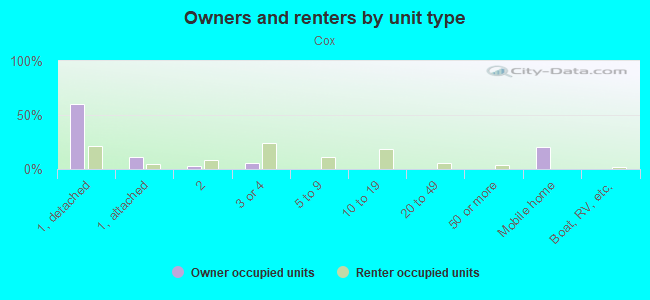
Owner-occupied
Renter-occupied

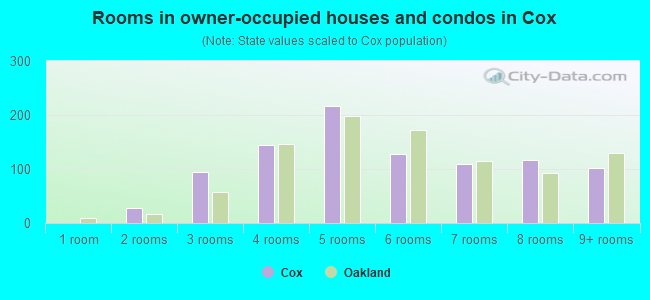
- Rooms in owner-occupied houses and condos in Cox
- 01 room
- 272 rooms
- 953 rooms
- 1444 rooms
- 2175 rooms
- 1286 rooms
- 1097 rooms
- 1178 rooms
- 1019+ rooms
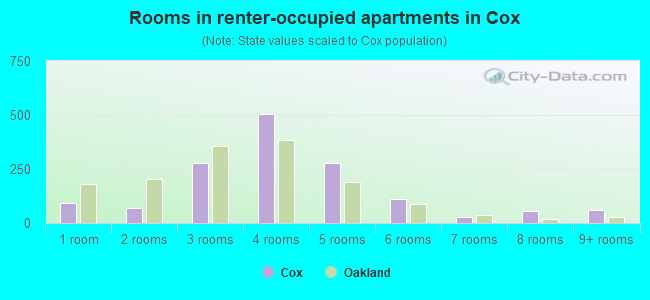
- Rooms in renter-occupied apartments in Cox
- 931 room
- 712 rooms
- 2803 rooms
- 5034 rooms
- 2795 rooms
- 1096 rooms
- 307 rooms
- 558 rooms
- 609+ rooms
Owner-occupied
Renter-occupied
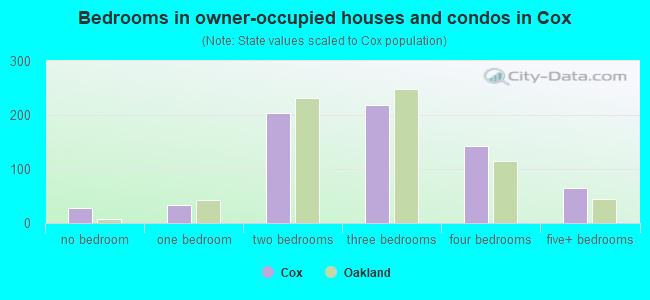
- Bedrooms in owner-occupied houses and condos in Cox
- 27no bedroom
- 341 bedroom
- 2042 bedrooms
- 2183 bedrooms
- 1434 bedrooms
- 655+ bedrooms
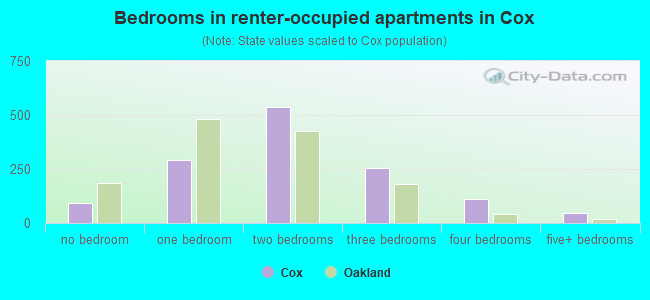
- Bedrooms in renter-occupied apartments in Cox
- 93no bedroom
- 2931 bedroom
- 5362 bedrooms
- 2553 bedrooms
- 1134 bedrooms
- 445+ bedrooms
Average number of cars or other vehicles available in houses/condos:
Average number of cars or other vehicles available in apartments:
| This neighborhood: | 2.4 |
| Oakland: | 1.8 |
Average number of cars or other vehicles available in apartments:
| Here: | 1.7 |
| city: | 1.1 |
Percentage of units with a mortgage:
| Cox: | 73.3% |
| Oakland: | 71.2% |
Average estimated value of detached houses in 2022 (46.7% of all units):
| Cox: | $648,829 |
| Oakland: | $1,000,874 |
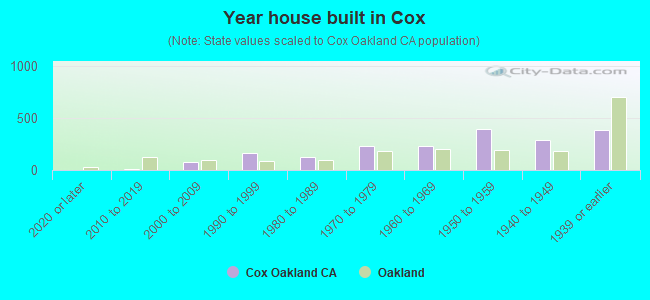
- Year house built in Cox
- 02020 or later
- 132010 to 2019
- 742000 to 2009
- 1661990 to 1999
- 1211980 to 1989
- 2311970 to 1979
- 2291960 to 1969
- 3921950 to 1959
- 2911940 to 1949
- 3821939 or earlier
City-data.com crime index for city in 2020 (higher means more crime):
| City: | 691.6 |
| U.S. average: | 219.5 |
Travel time to work (commute)
![Travel time to work (commute)]()
- 16Less than 5 minutes
- 345 to 9 minutes
- 24010 to 14 minutes
- 23415 to 19 minutes
- 43720 to 24 minutes
- 9625 to 29 minutes
- 39030 to 34 minutes
- 9735 to 39 minutes
- 11040 to 44 minutes
- 19145 to 59 minutes
- 11960 to 89 minutes
- 2790 or more minutes

Means of transportation to work
![Means of transportation to work]()
- 76.5%1,866Drove a car alone
- 11.6%283Carpooled
- 5.7%140Bus
- 6.7%164Subway or elevated rail
- 0.2%5Long-distance train or commuter rail
- 4.1%100Ferryboat
- 1.2%30Taxi
- 3.1%76Motorcycle
- 0.7%17Bicycle
- 1.1%26Walked
- 0.1%2Other means
- 6.7%164Worked at home

Time leaving home to go to work
![Time leaving home to go to work]()
- 14212:00 a.m. to 4:59 a.m.
- 1155:00 a.m. to 5:29 a.m.
- 815:30 a.m. to 5:59 a.m.
- 2366:00 a.m. to 6:29 a.m.
- 1306:30 a.m. to 6:59 a.m.
- 2637:00 a.m. to 7:29 a.m.
- 1207:30 a.m. to 7:59 a.m.
- 1768:00 a.m. to 8:29 a.m.
- 928:30 a.m. to 8:59 a.m.
- 939:00 a.m. to 9:59 a.m.
- 4010:00 a.m. to 10:59 a.m.
- 1911:00 a.m. to 11:59 a.m.
- 20012:00 p.m. to 3:59 p.m.
- 1524:00 p.m. to 11:59 p.m.

Occupations of males:
- Percentage of males in management occupations (except farmers):
Here: 7.6% city: 13.5%
- Percentage of males in computer and mathematical occupations:
Here: 1.5% city: 7.3%
- Percentage of males in healthcare practitioners and technical occupations:
Here: 2.8% city: 2.8%
- Percentage of males in service occupations:
Here: 21.7% city: 12.9%
- Percentage of males in sales and office occupations:
Here: 13.8% city: 13.4%
- Percentage of males in construction, extraction, and maintenance occupations:
Here: 17.6% city: 8.3%
- Percentage of males in production occupations:
Here: 16.6% city: 4.2%
- Percentage of males in transportation occupations:
Here: 8.8% city: 5.6%
- Percentage of males in material moving occupations:
Here: 4.1% city: 4.5%
Occupations of females:
- Percentage of females in management occupations (except farmers):
Here: 9.1% city: 15.1%
- Percentage of females in business and financial operations occupations:
Here: 3.1% city: 8.2%
- Percentage of females in legal occupations:
Here: 1.8% city: 2.5%
- Percentage of females in education, training, and library occupations:
Here: 2.2% city: 8.4%
- Percentage of females in arts, design, entertainment, sports, and media occupations:
Here: 1.1% city: 4.8%
- Percentage of females in healthcare practitioners and technical occupations:
Here: 4.2% city: 6.7%
- Percentage of females in service occupations:
Here: 30.4% city: 17.8%
- Percentage of females in sales and office occupations:
Here: 29.2% city: 20.0%
- Percentage of females in farming, fishing, and forestry occupations:
Here: 4.5% city: 0.2%
- Percentage of females in construction, extraction, and maintenance occupations:
Here: 1.6% city: 0.3%
- Percentage of females in production occupations:
Here: 4.4% city: 2.4%
- Percentage of females in transportation occupations:
Here: 3.6% city: 1.2%
- Percentage of females in material moving occupations:
Here: 3.9% city: 1.7%
Percentage of people 16-64 in Armed Forces:
| Cox: | 0.1% |
| Oakland: | 0.2% |
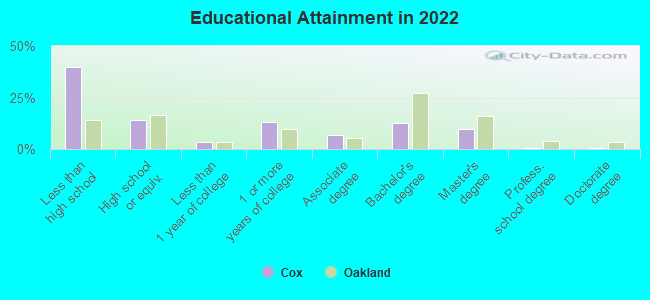
Education in this neighborhood (subdivision or community):
- Percentage of people 3 years and older in K-12 schools:
Cox: 30.9% Oakland: 13.0%
- Percentage of people 3 years and older in undergraduate colleges:
Cox: 5.5% Oakland: 4.3%
- Percentage of people 3 years and older in grad. or professional schools:
Cox: 2.5% Oakland: 1.8%
- Percentage of students K-12 enrolled in private schools:
Cox: 10.2% Oakland: 15.8%
Percentage of population below poverty level:
| Cox: | 16.9% |
| Oakland: | 13.9% |
Median year owner moved in (as recorded in 2022):
Median year renter moved in (as recorded in 2022):
| Cox: | 2006 |
| Oakland: | 2010 |
Median year renter moved in (as recorded in 2022):
| Cox: | 2014 |
| Oakland: | 2018 |
Percentage of married-couple families with both working:
| Cox: | 45.2% |
| Oakland: | 73.2% |
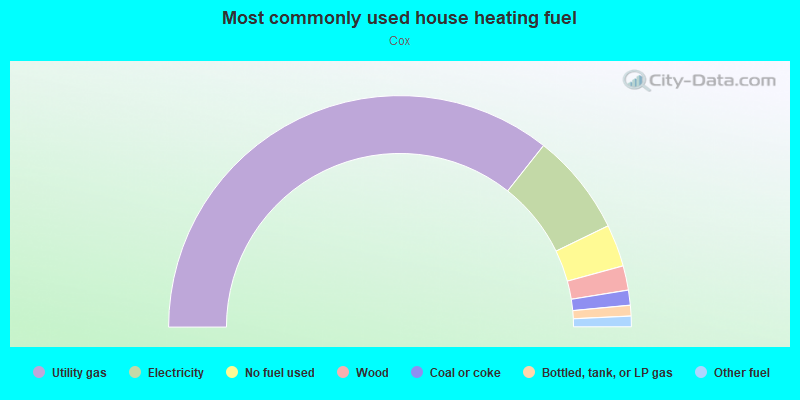
- 71.4%Utility gas
- 14.3%Electricity
- 5.9%No fuel used
- 3.4%Wood
- 2.1%Coal or coke
- 1.5%Bottled, tank, or LP gas
- 1.5%Other fuel
Highways in this neighborhood:
State Hwy 185 (International Blvd, E 14th St)
Length: 0.42 miles
Direction: SE-NW
Address range: 9101 to 9809
Direction: SE-NW
Address range: 9101 to 9809
Roads and streets:
92nd Ave
Length: 0.59 miles
Directions: E-W, SW-NE
Address range: 1392 to 2099
Directions: E-W, SW-NE
Address range: 1392 to 2099
96th Ave
Length: 0.58 miles
Directions: E-W, SW-NE
Address range: 1392 to 2099
Directions: E-W, SW-NE
Address range: 1392 to 2099
98th Ave
Length: 0.58 miles
Directions: E-W, SW-NE
Address range: 1392 to 2099
Directions: E-W, SW-NE
Address range: 1392 to 2099
94th Ave
Length: 0.58 miles
Directions: E-W, SW-NE
Address range: 1392 to 2099
Directions: E-W, SW-NE
Address range: 1392 to 2099
98th
Length: 0.58 miles
Direction: SW-NE
Direction: SW-NE
Plymouth St
Length: 0.43 miles
Direction: SE-NW
Address range: 9000 to 9803
Direction: SE-NW
Address range: 9000 to 9803
Sunnyside St
Length: 0.42 miles
Directions: SE-NW, SW-NE
Address range: 9200 to 9803
Directions: SE-NW, SW-NE
Address range: 9200 to 9803
International Blvd
Length: 0.42 miles
Direction: SE-NW
Direction: SE-NW
Holly St
Length: 0.38 miles
Direction: SE-NW
Address range: 9200 to 9803
Direction: SE-NW
Address range: 9200 to 9803
Walnut St
Length: 0.38 miles
Direction: SE-NW
Address range: 9200 to 9803
Direction: SE-NW
Address range: 9200 to 9803
Birch St
Length: 0.37 miles
Direction: SE-NW
Address range: 9200 to 9803
Direction: SE-NW
Address range: 9200 to 9803
Cherry St
Length: 0.37 miles
Direction: SE-NW
Address range: 9200 to 9799
Direction: SE-NW
Address range: 9200 to 9799
Olive St
Length: 0.35 miles
Direction: SE-NW
Address range: 9200 to 9803
Direction: SE-NW
Address range: 9200 to 9803
Cherry
Length: 0.00 miles
Direction: SE-NW
Direction: SE-NW