Gold Coast neighborhood in Oakland, California (CA), 94610, 94612 detailed profile
Settings
X

Business Search - 14 Million verified businesses
Area: 0.117 square miles
Population: 1,047
Population density:
| Gold Coast: | 8,948 people per square mile |
| Oakland: | 7,680 people per square mile |

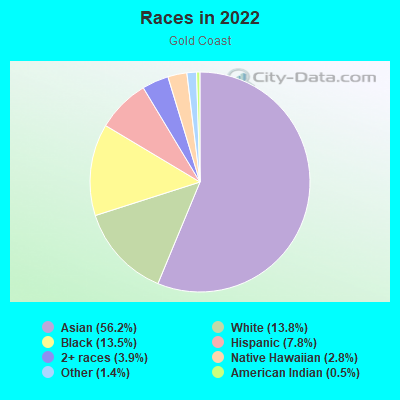
- 62856.2%Asian
- 15413.8%White
- 15113.5%Black
- 877.8%Hispanic or Latino
- 443.9%Two or more races
- 312.8%Native Hawaiian and Other
Pacific Islander - 161.4%Some other race
- 60.5%American Indian
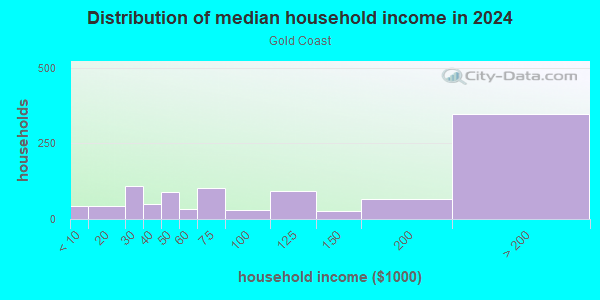
Distribution of median household income
![Distribution of median household income]()
- 51Less than $10,000
- 150$10,000 to $19,999
- 202$20,000 to $29,999
- 98$30,000 to $39,999
- 35$40,000 to $49,999
- 28$50,000 to $59,999
- 33$60,000 to $74,999
- 77$75,000 to $99,999
- 36$100,000 to $124,999
- 29$125,000 to $149,999
- 80$150,000 to $199,999
- 44$200,000 or more
Distribution of owner-occupied house/condo value
![Distribution of owner-occupied house/condo value]()
- 18Less than $50,000
- 41$250,000 to $299,999
- 53$300,000 to $399,999
- 166$400,000 to $499,999
- 487$500,000 to $749,999
- 15$750,000 to $999,999
- 20$1,000,000 or more

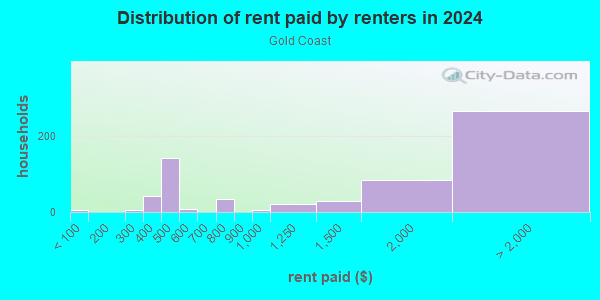
Distribution of rent paid by renters
![Distribution of rent paid by renters]()
- 27Less than $100
- 35$100 to $199
- 103$200 to $299
- 60$300 to $399
- 105$400 to $499
- 64$500 to $599
- 16$600 to $699
- 54$700 to $799
- 10$800 to $899
- 9$900 to $999
- 65$1,000 to $1,249
- 54$1,250 to $1,499
- 114$1,500 to $1,999
- 166$2,000 or more
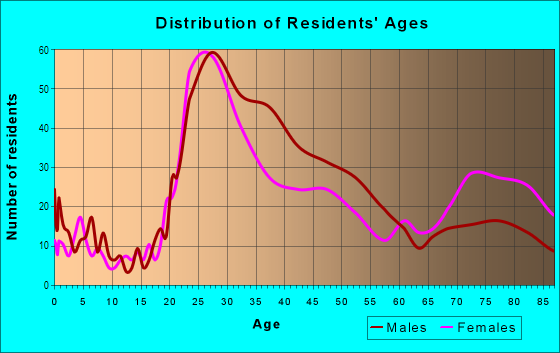
| Males: | 513 |
| Females: | 534 |
Males:
| This neighborhood: | 39.0 years |
| Whole city: | 38.3 years |
| This neighborhood: | 43.7 years |
| Whole city: | 39.1 years |
Average household size:
| Gold Coast: | 1.7 people |
| Oakland: | 2.4 people |
Percentage of family households:
| Gold Coast: | 11.4% |
| Oakland: | 37.1% |
| Here: | 23.5% |
| Oakland: | 34.9% |
Percentage of married-couple families with children (among all households):
| Gold Coast: | 10.0% |
| Oakland: | 28.3% |
Percentage of single-mother households (among all households):
| Gold Coast: | 54.7% |
| Oakland: | 9.9% |
Percentage of never married males 15 years old and over:
Percentage of never married females 15 years old and over:
| Gold Coast: | 23.4% |
| Oakland: | 24.6% |
Percentage of never married females 15 years old and over:
| Gold Coast: | 20.8% |
| city: | 21.9% |
Percentage of people that speak English not well or not at all:
| Gold Coast: | 35.4% |
| Oakland: | 10.6% |
Percentage of people born in this state:
Percentage of people born in another U.S. state:
Percentage of native residents but born outside the U.S.:
Percentage of foreign born residents:
| Here: | 27.8% |
| Oakland: | 49.9% |
Percentage of people born in another U.S. state:
| Gold Coast: | 25.0% |
| Oakland: | 22.3% |
Percentage of native residents but born outside the U.S.:
| Here: | 1.5% |
| city: | 1.6% |
Percentage of foreign born residents:
| Here: | 45.7% |
| Oakland: | 26.2% |
Owner-occupied
Renter-occupied

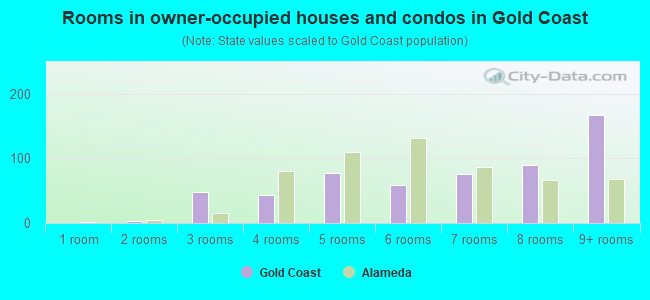
- Rooms in owner-occupied houses and condos in Gold Coast
- 1231 room
- 1322 rooms
- 1943 rooms
- 2384 rooms
- 145 rooms
- 496 rooms
- 197 rooms
- 08 rooms
- 09+ rooms
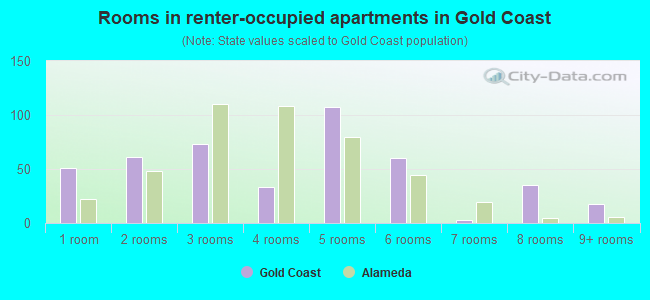
- Rooms in renter-occupied apartments in Gold Coast
- 1651 room
- 1672 rooms
- 1853 rooms
- 794 rooms
- 115 rooms
- 386 rooms
- 07 rooms
- 08 rooms
- 89+ rooms
Owner-occupied
Renter-occupied
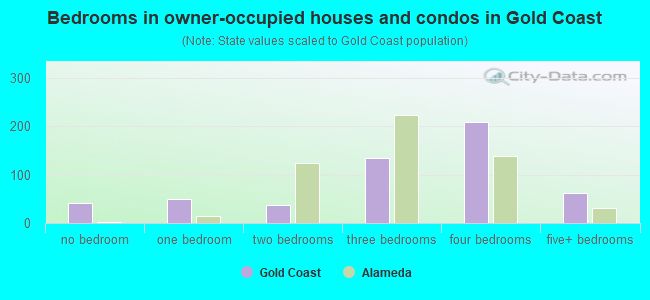
- Bedrooms in owner-occupied houses and condos in Gold Coast
- 123no bedroom
- 3151 bedroom
- 142 bedrooms
- 243 bedrooms
- 194 bedrooms
- 05+ bedrooms
- Bedrooms in renter-occupied apartments in Gold Coast
- 166no bedroom
- 3301 bedroom
- 1472 bedrooms
- 263 bedrooms
- 04 bedrooms
- 85+ bedrooms
Average number of cars or other vehicles available in houses/condos:
Average number of cars or other vehicles available in apartments:
| This neighborhood: | |
| Oakland: |
Average number of cars or other vehicles available in apartments:
| Here: | 0.6 |
| city: | 1.1 |
Percentage of units with a mortgage:
| Gold Coast: | 96.1% |
| Oakland: | 71.2% |
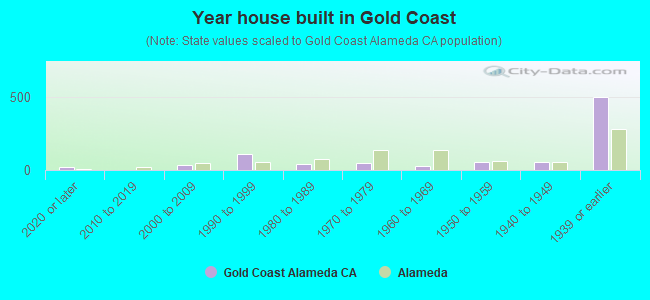
- Year house built in Gold Coast
- 202020 or later
- 492010 to 2019
- 1352000 to 2009
- 1431990 to 1999
- 731980 to 1989
- 1631970 to 1979
- 291960 to 1969
- 201950 to 1959
- 131940 to 1949
- 2051939 or earlier
City-data.com crime index for city in 2020 (higher means more crime):
| City: | 691.6 |
| U.S. average: | 219.5 |
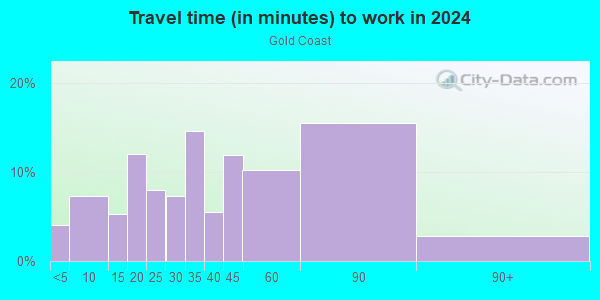
Travel time to work (commute)
![Travel time to work (commute)]()
- 15Less than 5 minutes
- 755 to 9 minutes
- 4010 to 14 minutes
- 12115 to 19 minutes
- 18620 to 24 minutes
- 11225 to 29 minutes
- 13030 to 34 minutes
- 3635 to 39 minutes
- 12440 to 44 minutes
- 7045 to 59 minutes
- 12760 to 89 minutes
- 2790 or more minutes
Means of transportation to work
![Means of transportation to work]()
- 12.2%55Drove a car alone
- 3.5%16Carpooled
- 6.9%31Bus
- 26.2%118Subway or elevated rail
- 19.5%88Long-distance train or commuter rail
- 6.4%29Light rail, streetcar or trolley
- 3.8%17Ferryboat
- 7.1%32Taxi
- 6.7%30Bicycle
- 6.9%31Walked
- 37.5%169Worked at home

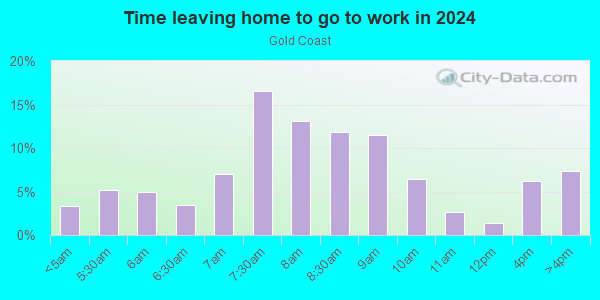
Time leaving home to go to work
![Time leaving home to go to work]()
- 4012:00 a.m. to 4:59 a.m.
- 455:00 a.m. to 5:29 a.m.
- 225:30 a.m. to 5:59 a.m.
- 736:00 a.m. to 6:29 a.m.
- 196:30 a.m. to 6:59 a.m.
- 1197:00 a.m. to 7:29 a.m.
- 1857:30 a.m. to 7:59 a.m.
- 738:00 a.m. to 8:29 a.m.
- 1518:30 a.m. to 8:59 a.m.
- 1519:00 a.m. to 9:59 a.m.
- 13710:00 a.m. to 10:59 a.m.
- 6311:00 a.m. to 11:59 a.m.
- 3312:00 p.m. to 3:59 p.m.
- 644:00 p.m. to 11:59 p.m.
Occupations of males:
- Percentage of males in management occupations (except farmers):
Here: 6.7% city: 13.5%
- Percentage of males in business and financial operations occupations:
Here: 4.7% city: 6.0%
- Percentage of males in computer and mathematical occupations:
Here: 9.5% city: 7.3%
- Percentage of males in architecture and engineering occupations:
Here: 23.1% city: 3.8%
- Percentage of males in life, physical, and social science occupations:
Here: 2.4% city: 2.0%
- Percentage of males in education, training, and library occupations:
Here: 28.8% city: 4.6%
- Percentage of males in arts, design, entertainment, sports, and media occupations:
Here: 8.2% city: 4.7%
- Percentage of males in healthcare practitioners and technical occupations:
Here: 7.5% city: 2.8%
- Percentage of males in service occupations:
Here: 5.2% city: 12.9%
- Percentage of males in sales and office occupations:
Here: 11.9% city: 13.4%
- Percentage of males in production occupations:
Here: 9.3% city: 4.2%
Occupations of females:
- Percentage of females in business and financial operations occupations:
Here: 16.2% city: 8.2%
- Percentage of females in architecture and engineering occupations:
Here: 8.1% city: 1.6%
- Percentage of females in life, physical, and social science occupations:
Here: 8.8% city: 2.3%
- Percentage of females in legal occupations:
Here: 5.6% city: 2.5%
- Percentage of females in arts, design, entertainment, sports, and media occupations:
Here: 7.5% city: 4.8%
- Percentage of females in healthcare practitioners and technical occupations:
Here: 8.3% city: 6.7%
- Percentage of females in service occupations:
Here: 18.1% city: 17.8%
- Percentage of females in sales and office occupations:
Here: 33.6% city: 20.0%
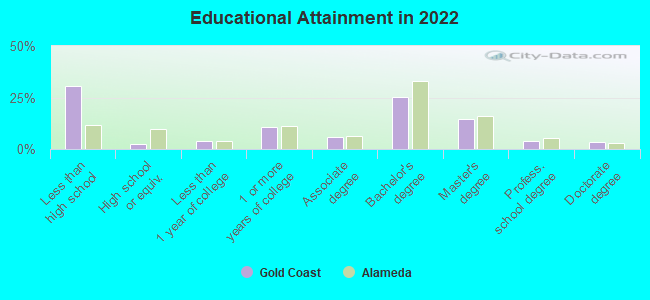
Education in this neighborhood (subdivision or community):
- Percentage of people 3 years and older in K-12 schools:
Gold Coast: 13.5% Oakland: 13.0%
- Percentage of people 3 years and older in undergraduate colleges:
Gold Coast: 2.5% Oakland: 4.3%
- Percentage of people 3 years and older in grad. or professional schools:
Gold Coast: 15.1% Oakland: 1.8%
- Percentage of students K-12 enrolled in private schools:
Gold Coast: 22.1% Oakland: 15.8%
Percentage of population below poverty level:
| Gold Coast: | 25.4% |
| Oakland: | 13.9% |
Median year renter moved in (as recorded in 2022):
| Gold Coast: | 2013 |
| Oakland: | 2018 |
Percentage of married-couple families with both working:
| Gold Coast: | 989.0% |
| Oakland: | 73.2% |
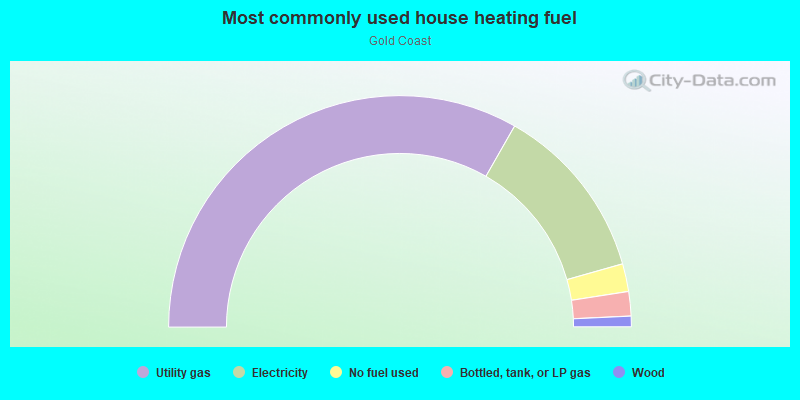
- 65.6%Electricity
- 24.7%Utility gas
- 4.0%Other fuel
- 3.0%Coal or coke
- 2.8%No fuel used
Roads and streets:
14th St
Length: 0.44 miles
Directions: E-W, SE-NW
Address range: 32 to 265
Directions: E-W, SE-NW
Address range: 32 to 265
Lakeside Dr
Length: 0.42 miles
Directions: E-W, N-S, SE-NW
Address range: 200 to 299
Directions: E-W, N-S, SE-NW
Address range: 200 to 299
Jackson St
Length: 0.33 miles
Direction: SW-NE
Address range: 1392 to 1999
Direction: SW-NE
Address range: 1392 to 1999
17th St
Length: 0.31 miles
Directions: E-W, SE-NW
Address range: 1 to 275
Directions: E-W, SE-NW
Address range: 1 to 275
Alice St
Length: 0.29 miles
Direction: SW-NE
Address range: 138 to 1899
Direction: SW-NE
Address range: 138 to 1899
Madison St
Length: 0.26 miles
Direction: SW-NE
Address range: 1390 to 1899
Direction: SW-NE
Address range: 1390 to 1899
Oak St
Length: 0.22 miles
Direction: SW-NE
Address range: 1400 to 1748
Direction: SW-NE
Address range: 1400 to 1748
19th St
Length: 0.17 miles
Directions: E-W, SE-NW
Address range: 100 to 249
Directions: E-W, SE-NW
Address range: 100 to 249
15th St
Length: 0.09 miles
Direction: E-W
Address range: 100 to 199
Direction: E-W
Address range: 100 to 199
14th
Length: 0.09 miles
Direction: E-W
Direction: E-W