Bartlett neighborhood in Oakland, California (CA), 94601, 94602 detailed profile
Settings
X

Business Search - 14 Million verified businesses
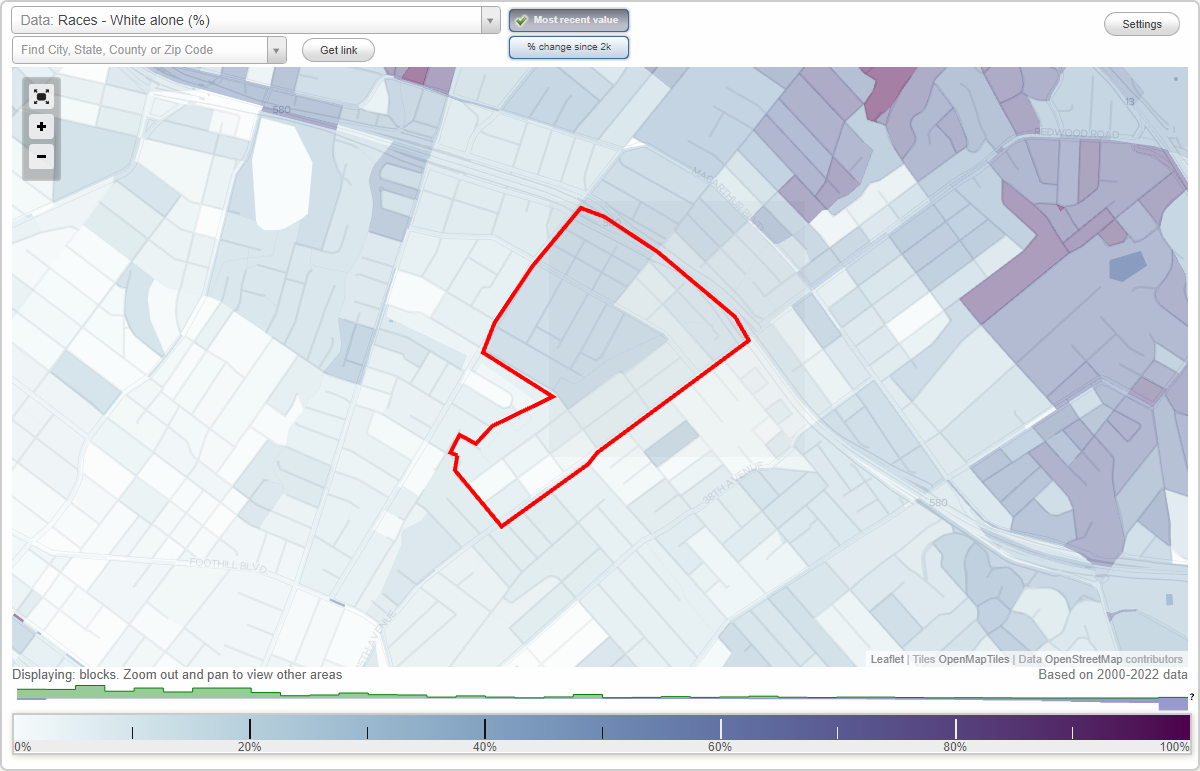
Area: 0.246 square miles
Population: 11,678
Population density:
| Bartlett: | 47,499 people per square mile |
| Oakland: | 7,680 people per square mile |

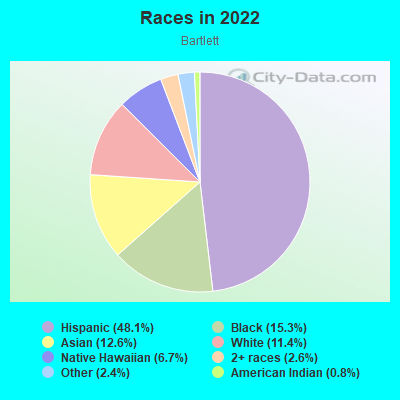
- 5,93348.1%Hispanic or Latino
- 1,88615.3%Black
- 1,55912.6%Asian
- 1,40811.4%White
- 8246.7%Native Hawaiian and Other
Pacific Islander - 3232.6%Two or more races
- 2992.4%Some other race
- 930.8%American Indian
Median household income in 2022:
| Bartlett: | $83,116 |
| Oakland: | $93,146 |
Distribution of median household income
![Distribution of median household income]()
- 228Less than $10,000
- 520$10,000 to $19,999
- 117$20,000 to $29,999
- 224$30,000 to $39,999
- 156$40,000 to $49,999
- 265$50,000 to $59,999
- 527$60,000 to $74,999
- 174$75,000 to $99,999
- 329$100,000 to $124,999
- 285$125,000 to $149,999
- 357$150,000 to $199,999
- 378$200,000 or more

Distribution of owner-occupied house/condo value
![Distribution of owner-occupied house/condo value]()
- 83$50,000 to $99,999
- 61$150,000 to $199,999
- 15$200,000 to $249,999
- 100$250,000 to $299,999
- 155$300,000 to $399,999
- 48$400,000 to $499,999
- 648$500,000 to $749,999
- 331$750,000 to $999,999
- 305$1,000,000 or more

Distribution of rent paid by renters
![Distribution of rent paid by renters]()
- 9$100 to $199
- 154$200 to $299
- 148$400 to $499
- 74$700 to $799
- 167$800 to $899
- 238$900 to $999
- 174$1,000 to $1,249
- 90$1,250 to $1,499
- 685$1,500 to $1,999
- 878$2,000 or more

Median rent in 2022:
| Bartlett: | $1,746 |
| Oakland: | $1,741 |
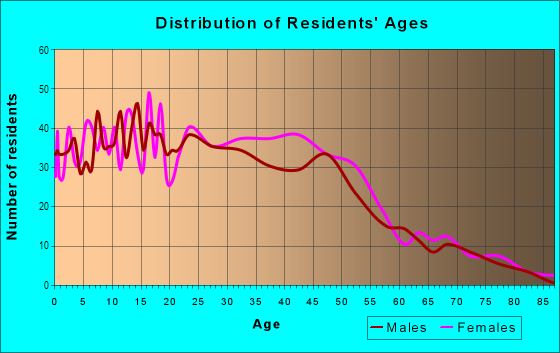
| Males: | 5,802 |
| Females: | 5,876 |
Males:
| This neighborhood: | 39.1 years |
| Whole city: | 38.3 years |
| This neighborhood: | 35.5 years |
| Whole city: | 39.1 years |
Average household size:
| Bartlett: | 3.5 people |
| Oakland: | 2.4 people |
Percentage of family households:
| Bartlett: | 52.7% |
| Oakland: | 37.1% |
| Here: | 56.4% |
| Oakland: | 34.9% |
Percentage of married-couple families with children (among all households):
| Bartlett: | 19.5% |
| Oakland: | 28.3% |
Percentage of single-mother households (among all households):
| Bartlett: | 8.0% |
| Oakland: | 9.9% |
Percentage of never married males 15 years old and over:
Percentage of never married females 15 years old and over:
| Bartlett: | 21.5% |
| Oakland: | 24.6% |
Percentage of never married females 15 years old and over:
| Bartlett: | 17.5% |
| city: | 21.9% |
Percentage of people that speak English not well or not at all:
| Bartlett: | 19.4% |
| Oakland: | 10.6% |
Percentage of people born in this state:
Percentage of people born in another U.S. state:
Percentage of native residents but born outside the U.S.:
Percentage of foreign born residents:
| Here: | 46.4% |
| Oakland: | 49.9% |
Percentage of people born in another U.S. state:
| Bartlett: | 12.3% |
| Oakland: | 22.3% |
Percentage of native residents but born outside the U.S.:
| Here: | 5.0% |
| city: | 1.6% |
Percentage of foreign born residents:
| Here: | 36.4% |
| Oakland: | 26.2% |
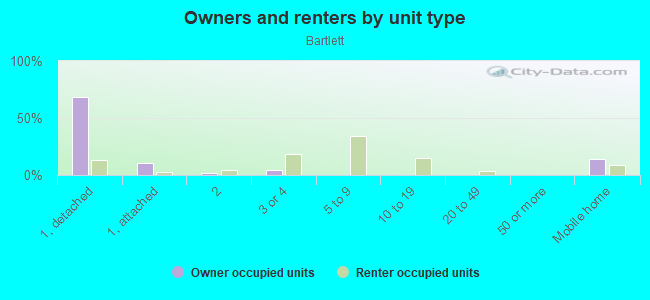
Owner-occupied
Renter-occupied

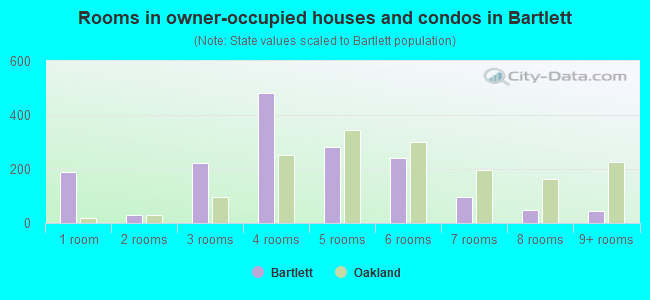
- Rooms in owner-occupied houses and condos in Bartlett
- 1881 room
- 282 rooms
- 2223 rooms
- 4804 rooms
- 2805 rooms
- 2416 rooms
- 957 rooms
- 498 rooms
- 459+ rooms
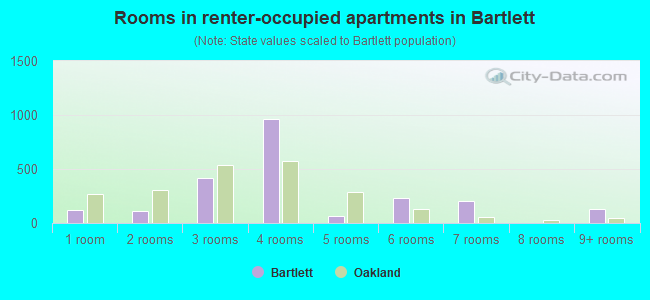
- Rooms in renter-occupied apartments in Bartlett
- 1221 room
- 1102 rooms
- 4133 rooms
- 9604 rooms
- 645 rooms
- 2296 rooms
- 2087 rooms
- 08 rooms
- 1329+ rooms
Owner-occupied
Renter-occupied
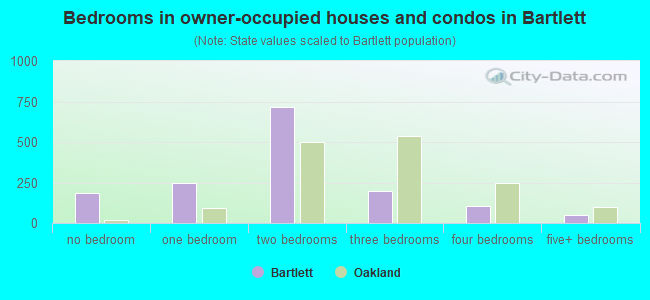
- Bedrooms in owner-occupied houses and condos in Bartlett
- 188no bedroom
- 2451 bedroom
- 7162 bedrooms
- 1953 bedrooms
- 1024 bedrooms
- 505+ bedrooms
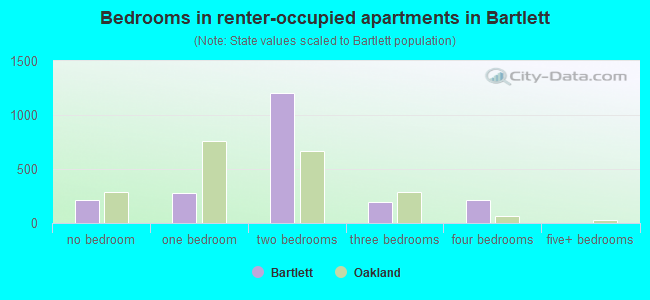
- Bedrooms in renter-occupied apartments in Bartlett
- 217no bedroom
- 2781 bedroom
- 1,2022 bedrooms
- 1903 bedrooms
- 2094 bedrooms
- 05+ bedrooms
Average number of cars or other vehicles available in houses/condos:
Average number of cars or other vehicles available in apartments:
| This neighborhood: | 1.5 |
| Oakland: | 1.8 |
Average number of cars or other vehicles available in apartments:
| Here: | 1.8 |
| city: | 1.1 |
Percentage of units with a mortgage:
| Bartlett: | 81.9% |
| Oakland: | 71.2% |
Average estimated value of detached houses in 2022 (41.9% of all units):
| Bartlett: | $513,020 |
| Oakland: | $1,000,874 |
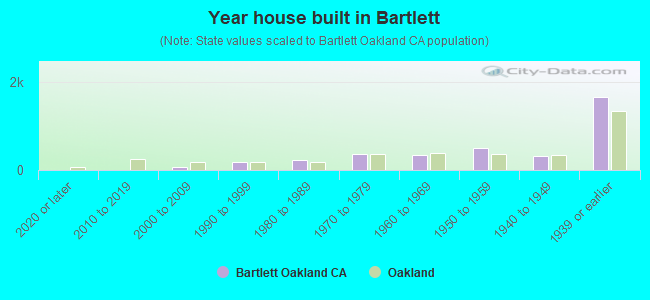
- Year house built in Bartlett
- 02020 or later
- 02010 to 2019
- 622000 to 2009
- 1701990 to 1999
- 2191980 to 1989
- 3731970 to 1979
- 3501960 to 1969
- 4951950 to 1959
- 3231940 to 1949
- 1,6451939 or earlier
City-data.com crime index for city in 2020 (higher means more crime):
| City: | 691.6 |
| U.S. average: | 219.5 |
Travel time to work (commute)
![Travel time to work (commute)]()
- 1315 to 9 minutes
- 41410 to 14 minutes
- 67215 to 19 minutes
- 48920 to 24 minutes
- 4725 to 29 minutes
- 83830 to 34 minutes
- 3535 to 39 minutes
- 26340 to 44 minutes
- 24845 to 59 minutes
- 39460 to 89 minutes
- 8590 or more minutes

Means of transportation to work
![Means of transportation to work]()
- 71.7%3,910Drove a car alone
- 4.3%236Carpooled
- 6.2%340Bus
- 10.4%570Subway or elevated rail
- 0.5%30Taxi
- 0.5%26Motorcycle
- 1.4%74Bicycle
- 2.7%148Walked
- 3.4%188Other means
- 5.9%323Worked at home

Time leaving home to go to work
![Time leaving home to go to work]()
- 14712:00 a.m. to 4:59 a.m.
- 1135:00 a.m. to 5:29 a.m.
- 1825:30 a.m. to 5:59 a.m.
- 2426:00 a.m. to 6:29 a.m.
- 4646:30 a.m. to 6:59 a.m.
- 2917:00 a.m. to 7:29 a.m.
- 2547:30 a.m. to 7:59 a.m.
- 5648:00 a.m. to 8:29 a.m.
- 3518:30 a.m. to 8:59 a.m.
- 2719:00 a.m. to 9:59 a.m.
- 23710:00 a.m. to 10:59 a.m.
- 9711:00 a.m. to 11:59 a.m.
- 24212:00 p.m. to 3:59 p.m.
- 594:00 p.m. to 11:59 p.m.

Occupations of males:
- Percentage of males in management occupations (except farmers):
Here: 4.9% city: 13.5%
- Percentage of males in computer and mathematical occupations:
Here: 3.6% city: 7.3%
- Percentage of males in architecture and engineering occupations:
Here: 2.2% city: 3.8%
- Percentage of males in life, physical, and social science occupations:
Here: 2.3% city: 2.0%
- Percentage of males in community and social services occupations:
Here: 1.0% city: 1.5%
- Percentage of males in healthcare practitioners and technical occupations:
Here: 7.1% city: 2.8%
- Percentage of males in service occupations:
Here: 34.8% city: 12.9%
- Percentage of males in sales and office occupations:
Here: 19.7% city: 13.4%
- Percentage of males in construction, extraction, and maintenance occupations:
Here: 4.9% city: 8.3%
- Percentage of males in production occupations:
Here: 12.1% city: 4.2%
- Percentage of males in transportation occupations:
Here: 3.7% city: 5.6%
- Percentage of males in material moving occupations:
Here: 1.8% city: 4.5%
Occupations of females:
- Percentage of females in management occupations (except farmers):
Here: 12.3% city: 15.1%
- Percentage of females in business and financial operations occupations:
Here: 14.2% city: 8.2%
- Percentage of females in computer and mathematical occupations:
Here: 7.4% city: 3.0%
- Percentage of females in community and social services occupations:
Here: 6.0% city: 3.7%
- Percentage of females in education, training, and library occupations:
Here: 5.8% city: 8.4%
- Percentage of females in arts, design, entertainment, sports, and media occupations:
Here: 1.6% city: 4.8%
- Percentage of females in healthcare practitioners and technical occupations:
Here: 5.2% city: 6.7%
- Percentage of females in service occupations:
Here: 28.5% city: 17.8%
- Percentage of females in sales and office occupations:
Here: 15.9% city: 20.0%
- Percentage of females in production occupations:
Here: 1.2% city: 2.4%
- Percentage of females in material moving occupations:
Here: 1.7% city: 1.7%
Percentage of people 16-64 in Armed Forces:
| Bartlett: | 0.3% |
| Oakland: | 0.2% |
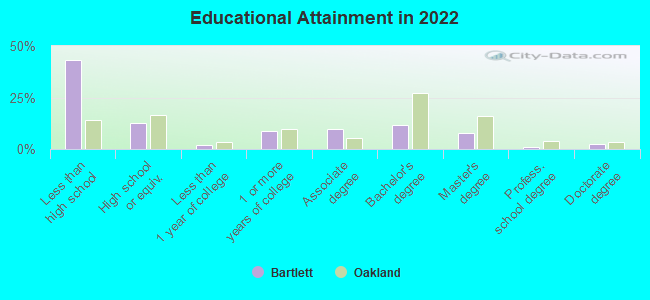
Education in this neighborhood (subdivision or community):
- Percentage of people 3 years and older in K-12 schools:
Bartlett: 22.4% Oakland: 13.0%
- Percentage of people 3 years and older in undergraduate colleges:
Bartlett: 7.0% Oakland: 4.3%
- Percentage of people 3 years and older in grad. or professional schools:
Bartlett: 2.3% Oakland: 1.8%
- Percentage of students K-12 enrolled in private schools:
Bartlett: 9.9% Oakland: 15.8%
Percentage of population below poverty level:
| Bartlett: | 15.6% |
| Oakland: | 13.9% |
Median year owner moved in (as recorded in 2022):
Median year renter moved in (as recorded in 2022):
| Bartlett: | 2006 |
| Oakland: | 2010 |
Median year renter moved in (as recorded in 2022):
| Bartlett: | 2013 |
| Oakland: | 2018 |
Percentage of married-couple families with both working:
| Bartlett: | 91.6% |
| Oakland: | 73.2% |
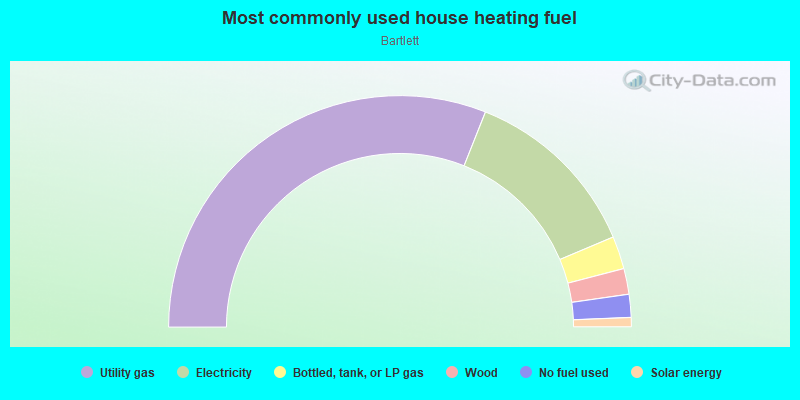
- 62.0%Utility gas
- 25.2%Electricity
- 4.6%Bottled, tank, or LP gas
- 3.6%Wood
- 3.2%No fuel used
- 1.3%Solar energy
Limited-access highways (interstate or state) in this neighborhood:
I- 580
Length: 0.09 miles
Direction: SE-NW
Direction: SE-NW
Roads and streets:
35th Ave
Length: 0.83 miles
Direction: SW-NE
Address range: 2300 to 3308
Direction: SW-NE
Address range: 2300 to 3308
Humboldt Ave
Length: 0.60 miles
Directions: E-W, SE-NW, SW-NE
Address range: 2353 to 3099
Directions: E-W, SE-NW, SW-NE
Address range: 2353 to 3099
Bartlett St
Length: 0.57 miles
Direction: SW-NE
Address range: 2400 to 3099
Direction: SW-NE
Address range: 2400 to 3099
Suter St
Length: 0.49 miles
Direction: SE-NW
Address range: 3061 to 3499
Direction: SE-NW
Address range: 3061 to 3499
School St
Length: 0.47 miles
Directions: E-W, SE-NW
Address range: 3100 to 3499
Directions: E-W, SE-NW
Address range: 3100 to 3499
Maple Ave
Length: 0.36 miles
Direction: SW-NE
Address range: 3000 to 3338
Direction: SW-NE
Address range: 3000 to 3338
Pleitner Ave
Length: 0.30 miles
Direction: SW-NE
Address range: 3000 to 3299
Direction: SW-NE
Address range: 3000 to 3299
Curran Ave
Length: 0.28 miles
Direction: SW-NE
Address range: 3000 to 3399
Direction: SW-NE
Address range: 3000 to 3399
Interstate 580 E
Length: 0.25 miles
Directions: N-S, SE-NW
Directions: N-S, SE-NW
Arkansas St
Length: 0.21 miles
Direction: SE-NW
Address range: 3200 to 3399
Direction: SE-NW
Address range: 3200 to 3399
Berlin Way
Length: 0.20 miles
Directions: E-W, SE-NW, SW-NE
Address range: 3000 to 3199
Directions: E-W, SE-NW, SW-NE
Address range: 3000 to 3199
Nicol Ave
Length: 0.19 miles
Direction: SE-NW
Address range: 3200 to 3399
Direction: SE-NW
Address range: 3200 to 3399
Brookdale Ave
Length: 0.18 miles
Direction: SE-NW
Address range: 3329 to 3499
Direction: SE-NW
Address range: 3329 to 3499
Texas St
Length: 0.17 miles
Direction: SE-NW
Address range: 3100 to 3199
Direction: SE-NW
Address range: 3100 to 3199
Laurel Ave
Length: 0.15 miles
Direction: SW-NE
Address range: 3200 to 3399
Direction: SW-NE
Address range: 3200 to 3399
Deering St
Length: 0.13 miles
Direction: SE-NW
Address range: 3400 to 3499
Direction: SE-NW
Address range: 3400 to 3499
Lynde St
Length: 0.13 miles
Direction: SE-NW
Address range: 3400 to 3499
Direction: SE-NW
Address range: 3400 to 3499
Penniman Ave
Length: 0.12 miles
Direction: SE-NW
Address range: 3400 to 3499
Direction: SE-NW
Address range: 3400 to 3499
35th
Length: 0.09 miles
Directions: E-W, SW-NE
Directions: E-W, SW-NE
Ward Ln
Length: 0.08 miles
Direction: SE-NW
Address range: 3100 to 3199
Direction: SE-NW
Address range: 3100 to 3199
Henrietta St
Length: 0.05 miles
Direction: SE-NW
Address range: 3450 to 3499
Direction: SE-NW
Address range: 3450 to 3499
Arkansas
Length: 0.04 miles
Direction: SE-NW
Direction: SE-NW
Curran
Length: 0.02 miles
Direction: SW-NE
Direction: SW-NE
Other features:
Perlata Crk
Length: 0.62 miles
Directions: E-W, SW-NE
Directions: E-W, SW-NE