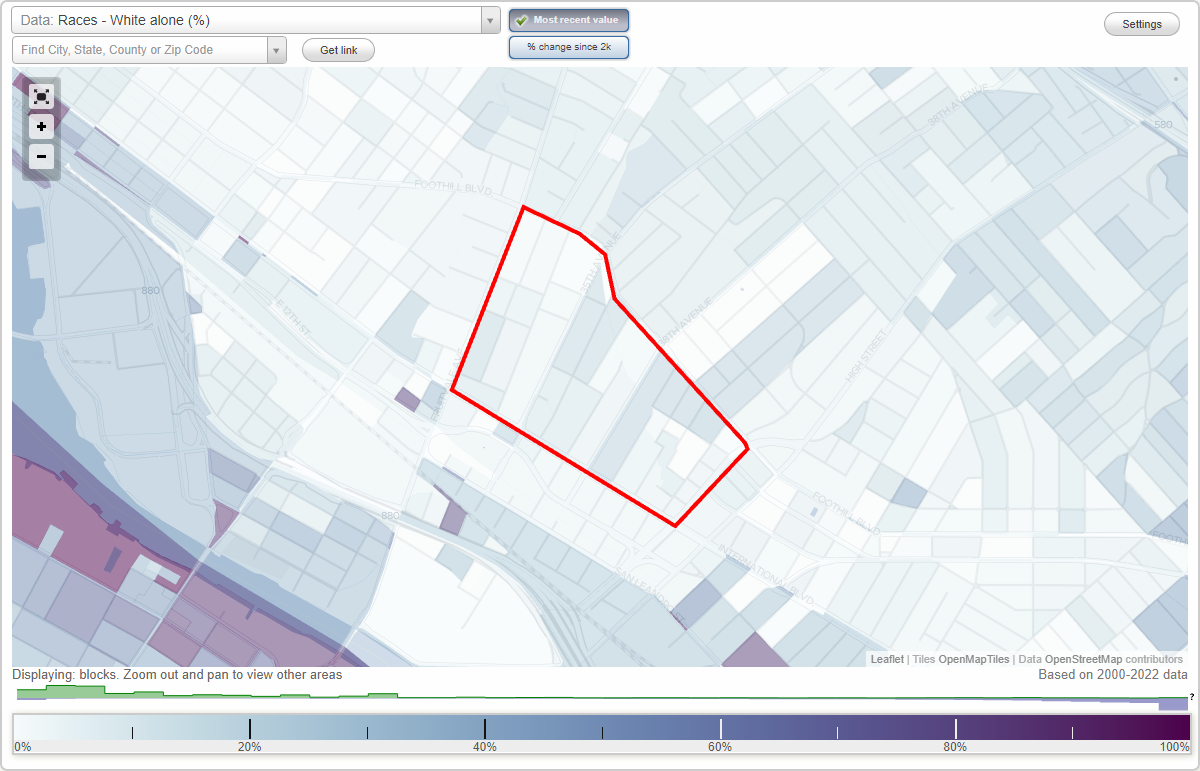
St. Elizabeth neighborhood in Oakland, California (CA), 94601 detailed profile
Settings
X

Business Search - 14 Million verified businesses
Area: 0.250 square miles
Population: 5,967
Population density:
| St. Elizabeth: | 23,912 people per square mile |
| Oakland: | 7,680 people per square mile |

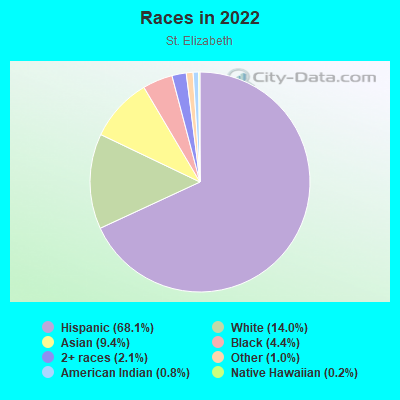
- 4,21068.1%Hispanic or Latino
- 86414.0%White
- 5839.4%Asian
- 2724.4%Black
- 1322.1%Two or more races
- 631.0%Some other race
- 500.8%American Indian
- 120.2%Native Hawaiian and Other
Pacific Islander
Median household income in 2022:
| St. Elizabeth: | $56,966 |
| Oakland: | $93,146 |
Distribution of median household income
![Distribution of median household income]()
- 150Less than $10,000
- 211$10,000 to $19,999
- 280$20,000 to $29,999
- 100$30,000 to $39,999
- 271$40,000 to $49,999
- 206$50,000 to $59,999
- 209$60,000 to $74,999
- 239$75,000 to $99,999
- 75$100,000 to $124,999
- 128$125,000 to $149,999
- 150$150,000 to $199,999
- 80$200,000 or more

Distribution of owner-occupied house/condo value
![Distribution of owner-occupied house/condo value]()
- 185Less than $50,000
- 62$50,000 to $99,999
- 17$250,000 to $299,999
- 58$300,000 to $399,999
- 66$400,000 to $499,999
- 221$500,000 to $749,999
- 176$750,000 to $999,999
- 13$1,000,000 or more

Distribution of rent paid by renters
![Distribution of rent paid by renters]()
- 100$100 to $199
- 31$200 to $299
- 62$300 to $399
- 119$400 to $499
- 141$500 to $599
- 112$600 to $699
- 37$700 to $799
- 7$800 to $899
- 115$900 to $999
- 259$1,000 to $1,249
- 225$1,250 to $1,499
- 323$1,500 to $1,999
- 347$2,000 or more

Median rent in 2022:
| St. Elizabeth: | $1,446 |
| Oakland: | $1,741 |
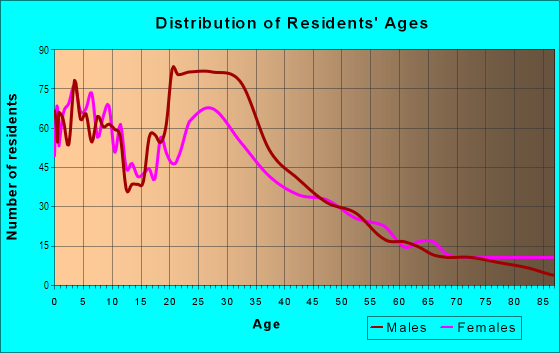
| Males: | 3,029 |
| Females: | 2,938 |
Males:
| This neighborhood: | 34.4 years |
| Whole city: | 38.3 years |
| This neighborhood: | 34.0 years |
| Whole city: | 39.1 years |
Average household size:
| St. Elizabeth: | 9.0 people |
| Oakland: | 2.4 people |
Percentage of family households:
| St. Elizabeth: | 55.0% |
| Oakland: | 37.1% |
| Here: | 43.8% |
| Oakland: | 34.9% |
Percentage of married-couple families with children (among all households):
| St. Elizabeth: | 19.3% |
| Oakland: | 28.3% |
Percentage of single-mother households (among all households):
| St. Elizabeth: | 7.2% |
| Oakland: | 9.9% |
Percentage of never married males 15 years old and over:
Percentage of never married females 15 years old and over:
| St. Elizabeth: | 25.5% |
| Oakland: | 24.6% |
Percentage of never married females 15 years old and over:
| St. Elizabeth: | 20.7% |
| city: | 21.9% |
Percentage of people that speak English not well or not at all:
| St. Elizabeth: | 19.7% |
| Oakland: | 10.6% |
Percentage of people born in this state:
Percentage of people born in another U.S. state:
Percentage of native residents but born outside the U.S.:
Percentage of foreign born residents:
| Here: | 43.4% |
| Oakland: | 49.9% |
Percentage of people born in another U.S. state:
| St. Elizabeth: | 4.9% |
| Oakland: | 22.3% |
Percentage of native residents but born outside the U.S.:
| Here: | 2.0% |
| city: | 1.6% |
Percentage of foreign born residents:
| Here: | 49.7% |
| Oakland: | 26.2% |
Owner-occupied
Renter-occupied

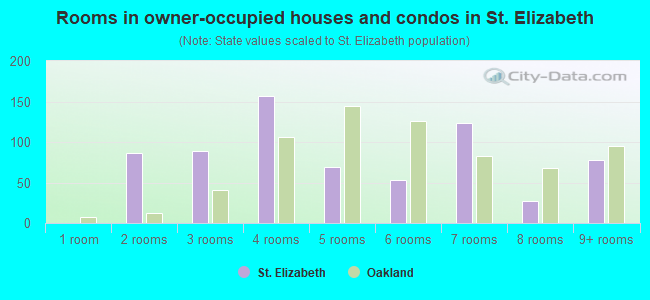
- Rooms in owner-occupied houses and condos in St. Elizabeth
- 01 room
- 872 rooms
- 893 rooms
- 1574 rooms
- 695 rooms
- 536 rooms
- 1237 rooms
- 278 rooms
- 789+ rooms
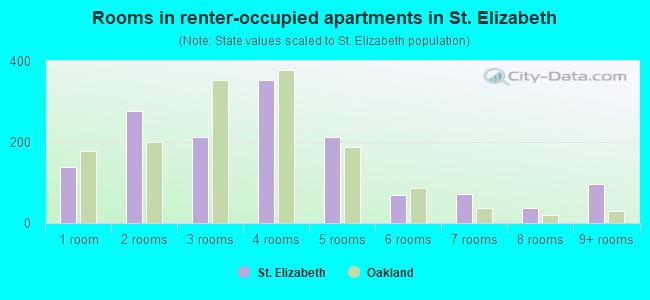
- Rooms in renter-occupied apartments in St. Elizabeth
- 1391 room
- 2772 rooms
- 2133 rooms
- 3534 rooms
- 2135 rooms
- 706 rooms
- 727 rooms
- 388 rooms
- 969+ rooms
Owner-occupied
Renter-occupied
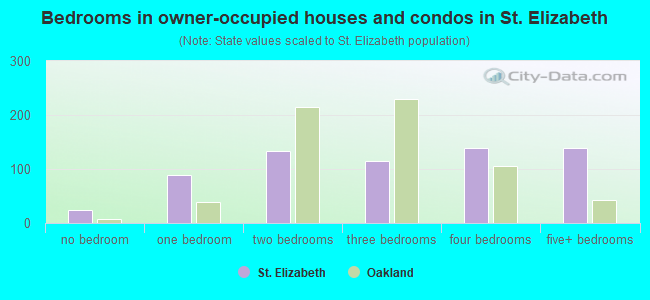
- Bedrooms in owner-occupied houses and condos in St. Elizabeth
- 24no bedroom
- 891 bedroom
- 1342 bedrooms
- 1153 bedrooms
- 1384 bedrooms
- 1385+ bedrooms
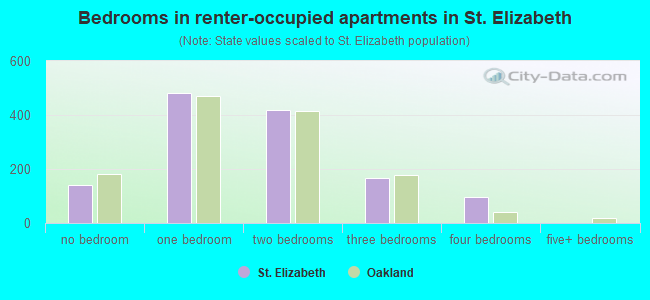
- Bedrooms in renter-occupied apartments in St. Elizabeth
- 139no bedroom
- 4811 bedroom
- 4172 bedrooms
- 1683 bedrooms
- 964 bedrooms
- 05+ bedrooms
Average number of cars or other vehicles available in houses/condos:
Average number of cars or other vehicles available in apartments:
| This neighborhood: | 2.4 |
| Oakland: | 1.8 |
Average number of cars or other vehicles available in apartments:
| Here: | 1.3 |
| city: | 1.1 |
Percentage of units with a mortgage:
| St. Elizabeth: | 55.0% |
| Oakland: | 71.2% |
Average estimated value of detached houses in 2022 (34.1% of all units):
| St. Elizabeth: | $788,967 |
| Oakland: | $1,000,874 |
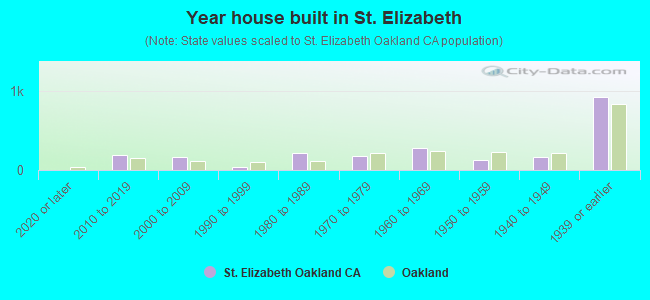
- Year house built in St. Elizabeth
- 32020 or later
- 1832010 to 2019
- 1632000 to 2009
- 361990 to 1999
- 2111980 to 1989
- 1721970 to 1979
- 2771960 to 1969
- 1301950 to 1959
- 1591940 to 1949
- 9151939 or earlier
City-data.com crime index for city in 2020 (higher means more crime):
| City: | 691.6 |
| U.S. average: | 219.5 |
Travel time to work (commute)
![Travel time to work (commute)]()
- 24Less than 5 minutes
- 235 to 9 minutes
- 43910 to 14 minutes
- 27415 to 19 minutes
- 45220 to 24 minutes
- 14625 to 29 minutes
- 41130 to 34 minutes
- 10135 to 39 minutes
- 12340 to 44 minutes
- 28345 to 59 minutes
- 31460 to 89 minutes
- 7490 or more minutes

Means of transportation to work
![Means of transportation to work]()
- 53.8%1,522Drove a car alone
- 7.7%218Carpooled
- 8.3%234Bus
- 12.3%347Subway or elevated rail
- 3.6%103Long-distance train or commuter rail
- 6.3%177Ferryboat
- 0.1%4Taxi
- 3.0%84Bicycle
- 5.7%162Walked
- 5.1%143Other means
- 8.6%242Worked at home

Time leaving home to go to work
![Time leaving home to go to work]()
- 10212:00 a.m. to 4:59 a.m.
- 1445:00 a.m. to 5:29 a.m.
- 785:30 a.m. to 5:59 a.m.
- 2686:00 a.m. to 6:29 a.m.
- 206:30 a.m. to 6:59 a.m.
- 2897:00 a.m. to 7:29 a.m.
- 2727:30 a.m. to 7:59 a.m.
- 4668:00 a.m. to 8:29 a.m.
- 1188:30 a.m. to 8:59 a.m.
- 2809:00 a.m. to 9:59 a.m.
- 12310:00 a.m. to 10:59 a.m.
- 8611:00 a.m. to 11:59 a.m.
- 19612:00 p.m. to 3:59 p.m.
- 1554:00 p.m. to 11:59 p.m.

Occupations of males:
- Percentage of males in management occupations (except farmers):
Here: 7.8% city: 13.5%
- Percentage of males in business and financial operations occupations:
Here: 1.5% city: 6.0%
- Percentage of males in architecture and engineering occupations:
Here: 1.9% city: 3.8%
- Percentage of males in life, physical, and social science occupations:
Here: 1.8% city: 2.0%
- Percentage of males in community and social services occupations:
Here: 1.7% city: 1.5%
- Percentage of males in arts, design, entertainment, sports, and media occupations:
Here: 2.5% city: 4.7%
- Percentage of males in service occupations:
Here: 17.0% city: 12.9%
- Percentage of males in sales and office occupations:
Here: 19.0% city: 13.4%
- Percentage of males in construction, extraction, and maintenance occupations:
Here: 23.1% city: 8.3%
- Percentage of males in production occupations:
Here: 6.6% city: 4.2%
- Percentage of males in transportation occupations:
Here: 4.7% city: 5.6%
- Percentage of males in material moving occupations:
Here: 4.7% city: 4.5%
Occupations of females:
- Percentage of females in management occupations (except farmers):
Here: 19.3% city: 15.1%
- Percentage of females in business and financial operations occupations:
Here: 1.6% city: 8.2%
- Percentage of females in computer and mathematical occupations:
Here: 1.7% city: 3.0%
- Percentage of females in community and social services occupations:
Here: 5.0% city: 3.7%
- Percentage of females in legal occupations:
Here: 1.6% city: 2.5%
- Percentage of females in education, training, and library occupations:
Here: 6.2% city: 8.4%
- Percentage of females in arts, design, entertainment, sports, and media occupations:
Here: 2.2% city: 4.8%
- Percentage of females in healthcare practitioners and technical occupations:
Here: 2.8% city: 6.7%
- Percentage of females in service occupations:
Here: 27.0% city: 17.8%
- Percentage of females in sales and office occupations:
Here: 22.7% city: 20.0%
- Percentage of females in construction, extraction, and maintenance occupations:
Here: 2.8% city: 0.3%
- Percentage of females in production occupations:
Here: 4.7% city: 2.4%
- Percentage of females in material moving occupations:
Here: 2.4% city: 1.7%
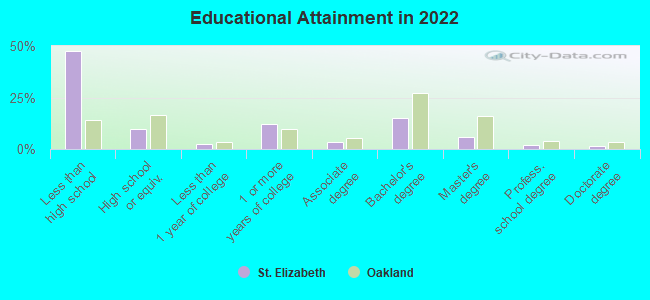
Education in this neighborhood (subdivision or community):
- Percentage of people 3 years and older in K-12 schools:
St. Elizabeth: 21.2% Oakland: 13.0%
- Percentage of people 3 years and older in undergraduate colleges:
St. Elizabeth: 4.9% Oakland: 4.3%
- Percentage of people 3 years and older in grad. or professional schools:
St. Elizabeth: 2.4% Oakland: 1.8%
- Percentage of students K-12 enrolled in private schools:
St. Elizabeth: 36.7% Oakland: 15.8%
Percentage of population below poverty level:
| St. Elizabeth: | 22.9% |
| Oakland: | 13.9% |
Median year owner moved in (as recorded in 2022):
Median year renter moved in (as recorded in 2022):
| St. Elizabeth: | 2000 |
| Oakland: | 2010 |
Median year renter moved in (as recorded in 2022):
| St. Elizabeth: | 2013 |
| Oakland: | 2018 |
Percentage of married-couple families with both working:
| St. Elizabeth: | 64.9% |
| Oakland: | 73.2% |
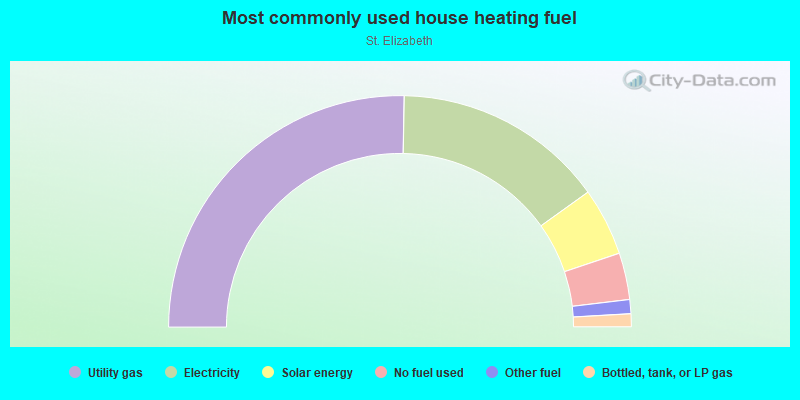
- 50.6%Utility gas
- 29.6%Electricity
- 9.5%Solar energy
- 6.5%No fuel used
- 2.0%Other fuel
- 1.8%Bottled, tank, or LP gas
Roads and streets:
E 14th St (International Blvd)
Length: 0.64 miles
Direction: SE-NW
Address range: 3300 to 4208
Direction: SE-NW
Address range: 3300 to 4208
34th Ave
Length: 0.49 miles
Direction: SW-NE
Address range: 1401 to 1989
Direction: SW-NE
Address range: 1401 to 1989
35th Ave
Length: 0.48 miles
Directions: N-S, SW-NE
Address range: 1400 to 1786
Directions: N-S, SW-NE
Address range: 1400 to 1786
E 18th St
Length: 0.44 miles
Directions: E-W, SE-NW
Address range: 3400 to 4199
Directions: E-W, SE-NW
Address range: 3400 to 4199
33rd Ave
Length: 0.43 miles
Directions: N-S, SW-NE
Address range: 1400 to 1989
Directions: N-S, SW-NE
Address range: 1400 to 1989
36th Ave
Length: 0.42 miles
Directions: E-W, SW-NE
Address range: 1400 to 1883
Directions: E-W, SW-NE
Address range: 1400 to 1883
E 16th St
Length: 0.37 miles
Directions: E-W, N-S, SE-NW
Address range: 3300 to 4199
Directions: E-W, N-S, SE-NW
Address range: 3300 to 4199
E 17th St
Length: 0.30 miles
Directions: E-W, SE-NW
Address range: 3300 to 4199
Directions: E-W, SE-NW
Address range: 3300 to 4199
42nd Ave
Length: 0.29 miles
Directions: E-W, SW-NE
Address range: 1400 to 1891
Directions: E-W, SW-NE
Address range: 1400 to 1891
37th Ave
Length: 0.27 miles
Direction: SW-NE
Address range: 1400 to 1899
Direction: SW-NE
Address range: 1400 to 1899
38th Ave
Length: 0.27 miles
Direction: SW-NE
Address range: 1400 to 1825
Direction: SW-NE
Address range: 1400 to 1825
40th Ave
Length: 0.24 miles
Directions: N-S, SE-NW, SW-NE
Address range: 1400 to 1799
Directions: N-S, SE-NW, SW-NE
Address range: 1400 to 1799
39th Ave
Length: 0.23 miles
Directions: N-S, SW-NE
Address range: 1400 to 1815
Directions: N-S, SW-NE
Address range: 1400 to 1815
41st Ave
Length: 0.22 miles
Direction: SW-NE
Address range: 1400 to 1799
Direction: SW-NE
Address range: 1400 to 1799
42nd
Length: 0.22 miles
Direction: SW-NE
Direction: SW-NE
Foothill
Length: 0.17 miles
Directions: E-W, N-S, SE-NW
Directions: E-W, N-S, SE-NW
E 15th St
Length: 0.14 miles
Directions: E-W, SE-NW
Address range: 3500 to 4199
Directions: E-W, SE-NW
Address range: 3500 to 4199
Bridge Ave
Length: 0.14 miles
Direction: SW-NE
Address range: 1500 to 1799
Direction: SW-NE
Address range: 1500 to 1799
Rosedale Ave
Length: 0.11 miles
Directions: N-S, SW-NE
Address range: 1500 to 1799
Directions: N-S, SW-NE
Address range: 1500 to 1799
Farnam St
Length: 0.08 miles
Direction: E-W
Address range: 3300 to 3399
Direction: E-W
Address range: 3300 to 3399
35th
Length: 0.03 miles
Direction: SW-NE
Direction: SW-NE
Other features:
Perlata Crk
Length: 0.66 miles
Directions: N-S, SE-NW
Directions: N-S, SE-NW