Waverly neighborhood in Oakland, California (CA), 94610, 94612 detailed profile
Settings
X

Business Search - 14 Million verified businesses
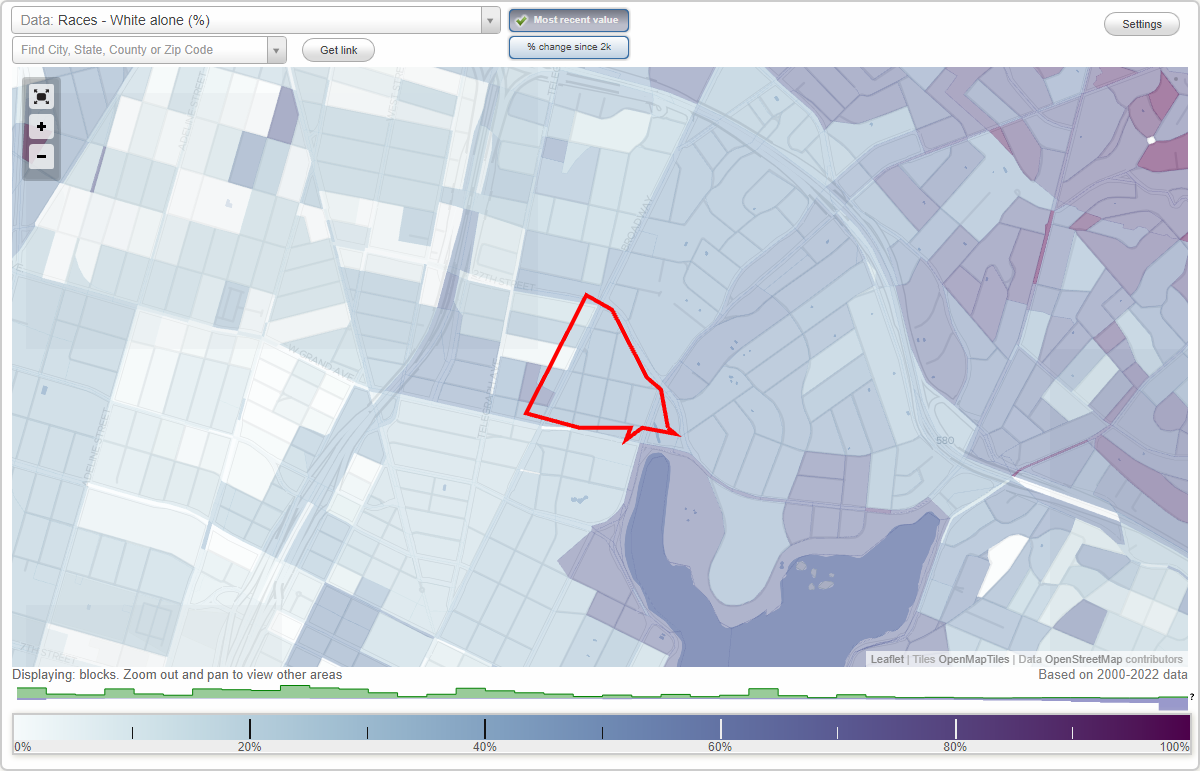
Area: 0.061 square miles
Population: 1,315
Population density:
| Waverly: | 21,552 people per square mile |
| Oakland: | 7,680 people per square mile |

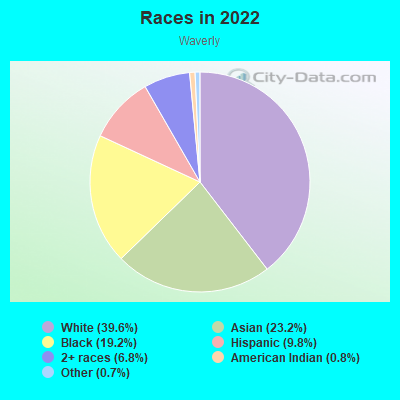
- 51939.6%White
- 30423.2%Asian
- 25219.2%Black
- 1299.8%Hispanic or Latino
- 896.8%Two or more races
- 100.8%American Indian
- 90.7%Some other race
Median household income in 2022:
| Waverly: | $124,500 |
| Oakland: | $93,146 |
Distribution of median household income
![Distribution of median household income]()
- 26Less than $10,000
- 27$10,000 to $19,999
- 20$20,000 to $29,999
- 41$30,000 to $39,999
- 35$40,000 to $49,999
- 14$50,000 to $59,999
- 40$60,000 to $74,999
- 89$75,000 to $99,999
- 101$100,000 to $124,999
- 101$125,000 to $149,999
- 79$150,000 to $199,999
- 167$200,000 or more

Distribution of owner-occupied house/condo value
![Distribution of owner-occupied house/condo value]()
- 37Less than $50,000
- 4$400,000 to $499,999
- 26$500,000 to $749,999
- 20$750,000 to $999,999
- 73$1,000,000 or more

Distribution of rent paid by renters
![Distribution of rent paid by renters]()
- 24$200 to $299
- 4$300 to $399
- 2$400 to $499
- 12$800 to $899
- 21$900 to $999
- 91$1,000 to $1,249
- 48$1,250 to $1,499
- 104$1,500 to $1,999
- 274$2,000 or more

Median rent in 2022:
| Waverly: | $2,000 |
| Oakland: | $1,741 |
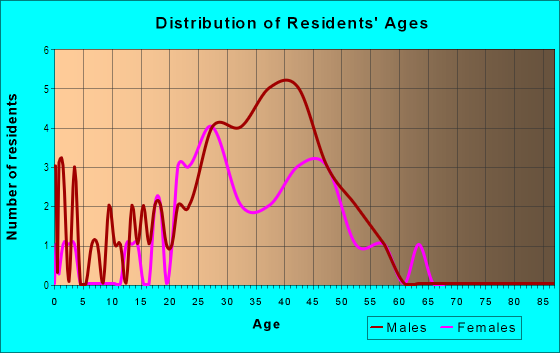
| Males: | 618 |
| Females: | 697 |
Males:
| This neighborhood: | 38.0 years |
| Whole city: | 38.3 years |
| This neighborhood: | 31.8 years |
| Whole city: | 39.1 years |
Average household size:
| Waverly: | 1.8 people |
| Oakland: | 2.4 people |
Percentage of family households:
| Waverly: | 26.2% |
| Oakland: | 37.1% |
| Here: | 25.2% |
| Oakland: | 34.9% |
Percentage of married-couple families with children (among all households):
| Waverly: | 53.0% |
| Oakland: | 28.3% |
Percentage of single-mother households (among all households):
| Waverly: | 9.1% |
| Oakland: | 9.9% |
Percentage of never married males 15 years old and over:
Percentage of never married females 15 years old and over:
| Waverly: | 25.5% |
| Oakland: | 24.6% |
Percentage of never married females 15 years old and over:
| Waverly: | 25.9% |
| city: | 21.9% |
Percentage of people that speak English not well or not at all:
| Waverly: | 4.0% |
| Oakland: | 10.6% |
Percentage of people born in this state:
Percentage of people born in another U.S. state:
Percentage of native residents but born outside the U.S.:
Percentage of foreign born residents:
| Here: | 41.6% |
| Oakland: | 49.9% |
Percentage of people born in another U.S. state:
| Waverly: | 32.6% |
| Oakland: | 22.3% |
Percentage of native residents but born outside the U.S.:
| Here: | 1.3% |
| city: | 1.6% |
Percentage of foreign born residents:
| Here: | 24.4% |
| Oakland: | 26.2% |
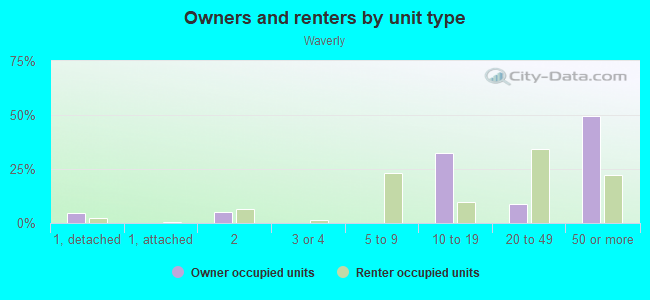
Owner-occupied
Renter-occupied

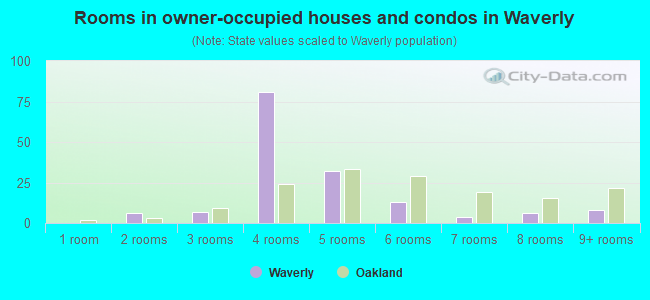
- Rooms in owner-occupied houses and condos in Waverly
- 01 room
- 62 rooms
- 73 rooms
- 814 rooms
- 325 rooms
- 136 rooms
- 47 rooms
- 68 rooms
- 89+ rooms
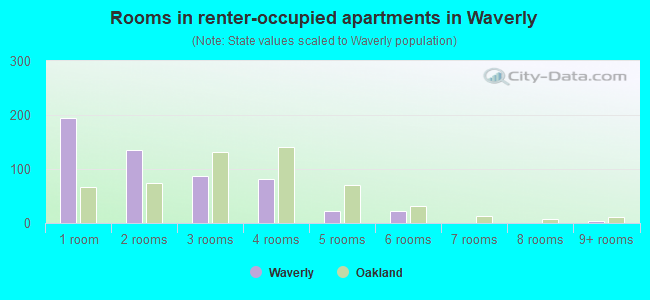
- Rooms in renter-occupied apartments in Waverly
- 1941 room
- 1352 rooms
- 873 rooms
- 824 rooms
- 235 rooms
- 226 rooms
- 07 rooms
- 08 rooms
- 49+ rooms
Owner-occupied
Renter-occupied
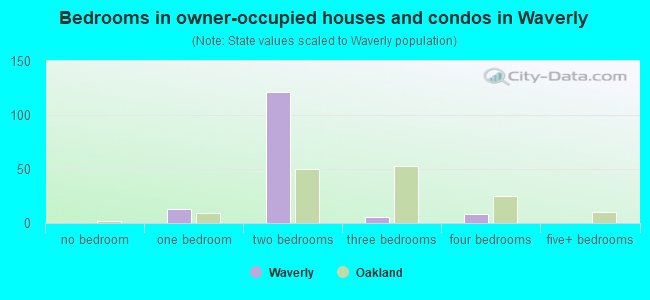
- Bedrooms in owner-occupied houses and condos in Waverly
- 0no bedroom
- 131 bedroom
- 1212 bedrooms
- 63 bedrooms
- 84 bedrooms
- 05+ bedrooms
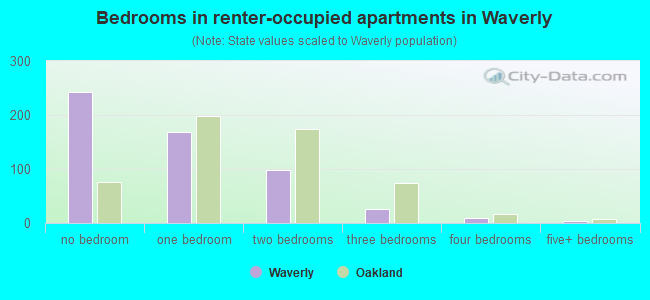
- Bedrooms in renter-occupied apartments in Waverly
- 242no bedroom
- 1691 bedroom
- 982 bedrooms
- 263 bedrooms
- 94 bedrooms
- 45+ bedrooms
Average number of cars or other vehicles available in houses/condos:
Average number of cars or other vehicles available in apartments:
| This neighborhood: | 1.4 |
| Oakland: | 1.8 |
Average number of cars or other vehicles available in apartments:
| Here: | 1.0 |
| city: | 1.1 |
Percentage of units with a mortgage:
| Waverly: | 58.8% |
| Oakland: | 71.2% |
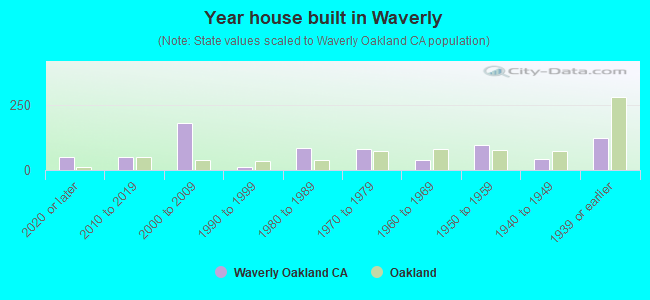
- Year house built in Waverly
- 512020 or later
- 492010 to 2019
- 1812000 to 2009
- 101990 to 1999
- 841980 to 1989
- 811970 to 1979
- 381960 to 1969
- 961950 to 1959
- 431940 to 1949
- 1221939 or earlier
City-data.com crime index for city in 2020 (higher means more crime):
| City: | 691.6 |
| U.S. average: | 219.5 |
Travel time to work (commute)
![Travel time to work (commute)]()
- 14Less than 5 minutes
- 115 to 9 minutes
- 4210 to 14 minutes
- 5315 to 19 minutes
- 3220 to 24 minutes
- 1925 to 29 minutes
- 7530 to 34 minutes
- 1035 to 39 minutes
- 3440 to 44 minutes
- 5245 to 59 minutes
- 7360 to 89 minutes
- 2390 or more minutes

Means of transportation to work
![Means of transportation to work]()
- 38.8%367Drove a car alone
- 3.6%34Carpooled
- 3.7%35Bus
- 15.6%148Subway or elevated rail
- 2.1%20Long-distance train or commuter rail
- 1.0%9Taxi
- 1.6%15Motorcycle
- 5.6%53Bicycle
- 11.9%113Walked
- 16.6%157Worked at home

Time leaving home to go to work
![Time leaving home to go to work]()
- 1812:00 a.m. to 4:59 a.m.
- 15:00 a.m. to 5:29 a.m.
- 65:30 a.m. to 5:59 a.m.
- 336:00 a.m. to 6:29 a.m.
- 406:30 a.m. to 6:59 a.m.
- 457:00 a.m. to 7:29 a.m.
- 357:30 a.m. to 7:59 a.m.
- 568:00 a.m. to 8:29 a.m.
- 598:30 a.m. to 8:59 a.m.
- 479:00 a.m. to 9:59 a.m.
- 1610:00 a.m. to 10:59 a.m.
- 311:00 a.m. to 11:59 a.m.
- 6412:00 p.m. to 3:59 p.m.
- 244:00 p.m. to 11:59 p.m.

Occupations of males:
- Percentage of males in management occupations (except farmers):
Here: 20.2% city: 13.5%
- Percentage of males in business and financial operations occupations:
Here: 5.6% city: 6.0%
- Percentage of males in computer and mathematical occupations:
Here: 11.0% city: 7.3%
- Percentage of males in architecture and engineering occupations:
Here: 4.4% city: 3.8%
- Percentage of males in life, physical, and social science occupations:
Here: 1.7% city: 2.0%
- Percentage of males in community and social services occupations:
Here: 1.5% city: 1.5%
- Percentage of males in education, training, and library occupations:
Here: 1.1% city: 4.6%
- Percentage of males in arts, design, entertainment, sports, and media occupations:
Here: 3.5% city: 4.7%
- Percentage of males in healthcare practitioners and technical occupations:
Here: 3.0% city: 2.8%
- Percentage of males in service occupations:
Here: 17.1% city: 12.9%
- Percentage of males in sales and office occupations:
Here: 23.3% city: 13.4%
- Percentage of males in farming, fishing, and forestry occupations:
Here: 2.0% city: 0.4%
- Percentage of males in construction, extraction, and maintenance occupations:
Here: 4.5% city: 8.3%
- Percentage of males in production occupations:
Here: 1.7% city: 4.2%
- Percentage of males in transportation occupations:
Here: 1.5% city: 5.6%
Occupations of females:
- Percentage of females in management occupations (except farmers):
Here: 20.1% city: 15.1%
- Percentage of females in business and financial operations occupations:
Here: 12.4% city: 8.2%
- Percentage of females in computer and mathematical occupations:
Here: 2.8% city: 3.0%
- Percentage of females in architecture and engineering occupations:
Here: 2.0% city: 1.6%
- Percentage of females in life, physical, and social science occupations:
Here: 7.9% city: 2.3%
- Percentage of females in community and social services occupations:
Here: 1.2% city: 3.7%
- Percentage of females in legal occupations:
Here: 1.4% city: 2.5%
- Percentage of females in education, training, and library occupations:
Here: 8.4% city: 8.4%
- Percentage of females in arts, design, entertainment, sports, and media occupations:
Here: 1.9% city: 4.8%
- Percentage of females in healthcare practitioners and technical occupations:
Here: 5.6% city: 6.7%
- Percentage of females in service occupations:
Here: 20.1% city: 17.8%
- Percentage of females in sales and office occupations:
Here: 16.2% city: 20.0%
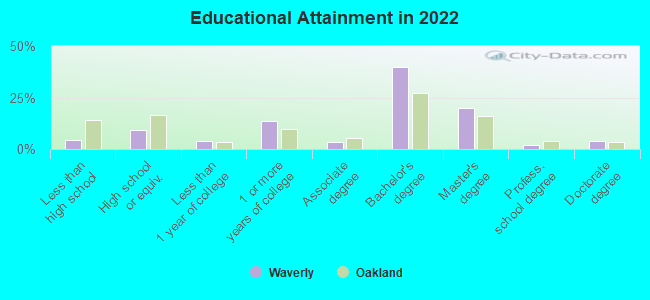
Education in this neighborhood (subdivision or community):
- Percentage of people 3 years and older in K-12 schools:
Waverly: 6.0% Oakland: 13.0%
- Percentage of people 3 years and older in undergraduate colleges:
Waverly: 2.3% Oakland: 4.3%
- Percentage of people 3 years and older in grad. or professional schools:
Waverly: 2.6% Oakland: 1.8%
- Percentage of students K-12 enrolled in private schools:
Waverly: 5.3% Oakland: 15.8%
Percentage of population below poverty level:
| Waverly: | 12.2% |
| Oakland: | 13.9% |
Median year owner moved in (as recorded in 2022):
Median year renter moved in (as recorded in 2022):
| Waverly: | 2014 |
| Oakland: | 2010 |
Median year renter moved in (as recorded in 2022):
| Waverly: | 2019 |
| Oakland: | 2018 |
Percentage of married-couple families with both working:
| Waverly: | 71.3% |
| Oakland: | 73.2% |
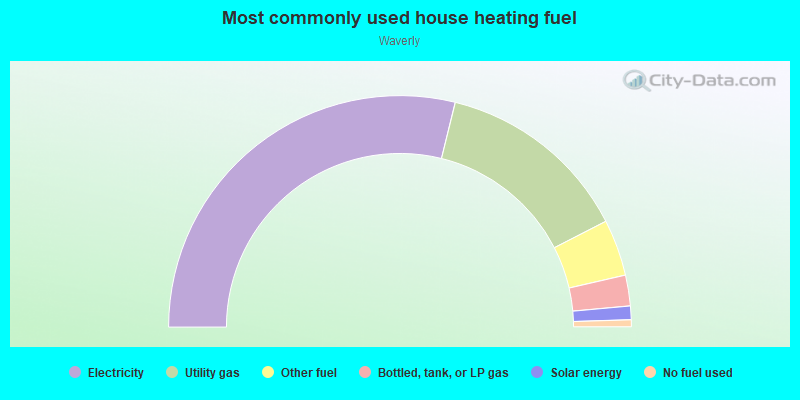
- 57.7%Electricity
- 27.2%Utility gas
- 7.9%Other fuel
- 4.3%Bottled, tank, or LP gas
- 1.9%Solar energy
- 1.0%No fuel used
Roads and streets:
Broadway
Length: 0.44 miles
Direction: SW-NE
Address range: 2300 to 2599
Direction: SW-NE
Address range: 2300 to 2599
23rd St
Length: 0.29 miles
Direction: E-W
Address range: 200 to 399
Direction: E-W
Address range: 200 to 399
24th St
Length: 0.29 miles
Directions: E-W, SE-NW
Address range: 200 to 419
Directions: E-W, SE-NW
Address range: 200 to 419
Kaiser Plz (Valdez St)
Length: 0.20 miles
Direction: N-S
Address range: 2300 to 2599
Direction: N-S
Address range: 2300 to 2599
Webster St
Length: 0.20 miles
Direction: N-S
Address range: 2300 to 2599
Direction: N-S
Address range: 2300 to 2599
Harrison St
Length: 0.14 miles
Directions: SE-NW, SW-NE
Address range: 2300 to 2399
Directions: SE-NW, SW-NE
Address range: 2300 to 2399
26th St
Length: 0.11 miles
Direction: E-W
Address range: 250 to 357
Direction: E-W
Address range: 250 to 357
Waverly St
Length: 0.09 miles
Direction: N-S
Address range: 2300 to 2399
Direction: N-S
Address range: 2300 to 2399
25th St
Length: 0.03 miles
Directions: E-W, SE-NW
Address range: 400 to 409
Directions: E-W, SE-NW
Address range: 400 to 409
Harrison
Length: 0.02 miles
Direction: SW-NE
Direction: SW-NE