Vallejo: Fire Incidents, California (CA)
Where are fire incidents reported in Vallejo, CA
Something went wrong! Please refresh the page.
| Fire incidents reported | |
|---|---|
| Sreet name | Count |
| SONOMA | 96 |
| SACRAMENTO ST | 78 |
| GEORGIA ST | 74 |
| ADMIRAL CALLAGHAN LN | 72 |
| BROADWAY ST | 66 |
| TENNESSEE ST | 32 |
| COUCH ST | 30 |
| FAIRGROUNDS DR | 30 |
| MAINE ST | 30 |
| MARIN ST | 28 |
| SPRINGS RD | 28 |
| REDWOOD ST | 26 |
| SONOMA BLVD | 24 |
| WB I80 | 24 |
| FLORIDA ST | 22 |
| NEBRASKA ST | 22 |
| SERENO DR | 22 |
| SANTA CLARA ST | 20 |
| WB HWY 37 | 20 |
| BENICIA RD | 18 |
| LEWIS BROWN RD | 18 |
| TUOLUMNE ST | 18 |
| LINCOLN RD E | 16 |
| MONTEREY ST | 16 |
| PENNSYLVANIA ST | 16 |
| PORTER ST | 16 |
| WILSON | 16 |
| ALABAMA ST | 14 |
| EL DORADO ST | 14 |
| GRIFFIN DR | 14 |
| Other | 490 |
2005 - 2018 National Fire Incident Reporting System (NFIRS) incidents
- Incident types reported to NFIRS in Vallejo, CA
- 12,95369.7%Rescue & EMS
- 1,99210.7%Good Intent Call
- 1,4107.6%Fire
- 9455.1%Service Call
- 7624.1%False Alarm
- 4902.6%Hazardous Condition
- 290.2%Overpressure Rupture
- Fire incident types reported to NFIRS in Vallejo, CA
- 58841.7%Outside Fires
- 52637.3%Structure Fires
- 24617.4%Mobile Property/Vehicle Fires
- 503.5%Other
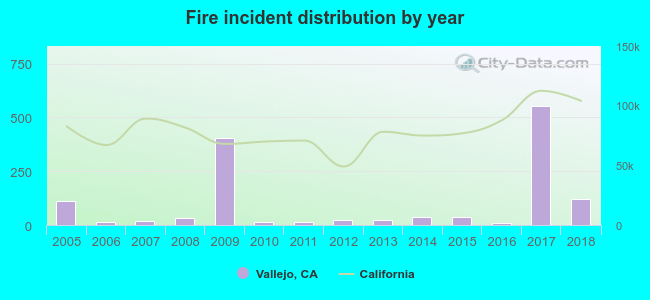 Based on the data from the years 2005 - 2018 the average number of fires per year is 101. The highest number of reported fires - 555 took place in 2017, and the least - 10 in 2016. The data has a growing trend.
The average number of yearly fire incidents per 10k residents in Vallejo, CA compared to nearest cities:
(Note: Based on data for the last 3 years, including only cities with population 5,000 and above)
| Vallejo: | 19.0 |
| American Canyon: | 14.5 |
| Benicia: | 27.3 |
| Rodeo: | 49.2 |
| Hercules: | 13.4 |
| Pinole: | 18.5 |
| Martinez: | 21.8 |
| El Sobrante: | 14.5 |
| Briones: | 1.5 |
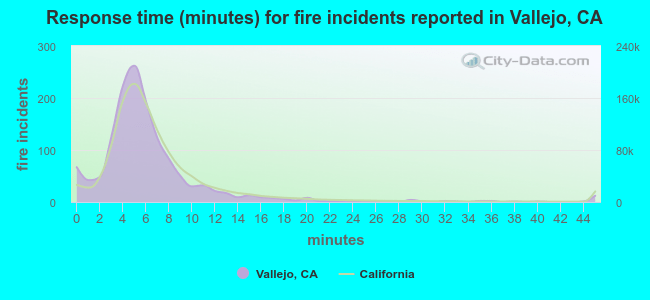 The median response time based on all reported fire incidents is 5 minutes. This is lower compared to the state median value.
The median response time in Vallejo, CA compared to nearest cities:
(Note: Based on data for all years, including only cities with at least 500 fire incidents)
| Vallejo: | 5 minutes |
| American Canyon: | 5 minutes |
| Benicia: | 6 minutes |
| Rodeo: | 6 minutes |
| Hercules: | 6 minutes |
| Martinez: | 7 minutes |
| San Pablo: | 7 minutes |
| Richmond: | 7 minutes |
| Napa: | 6 minutes |
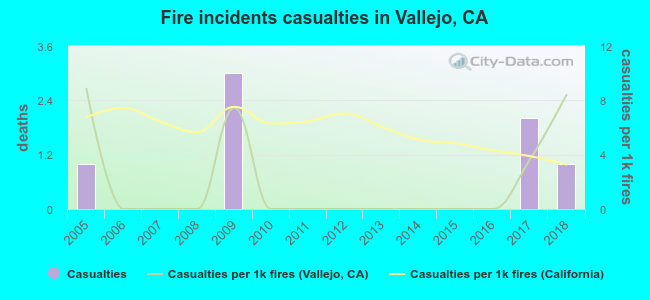 Based on the reports from the years 2005 - 2018 the average number of fire-related yearly casualties is 1. The highest number of reported injuries - 3 took place in 2009, and the lowest - 0 in 2006. The data has a constant trend.
The average number of injuries per 1,000 fires is 2. This indicator was the highest - 9 in 2005, and the lowest 0 in 2006. The trend for casualties per 1,000 fire incidents is declining. Compared to the California value the number of casualties per 1,000 incidents is similar.
Based on the reports from the years 2005 - 2018 the average number of fire-related yearly casualties is 1. The highest number of reported injuries - 3 took place in 2009, and the lowest - 0 in 2006. The data has a constant trend.
The average number of injuries per 1,000 fires is 2. This indicator was the highest - 9 in 2005, and the lowest 0 in 2006. The trend for casualties per 1,000 fire incidents is declining. Compared to the California value the number of casualties per 1,000 incidents is similar.
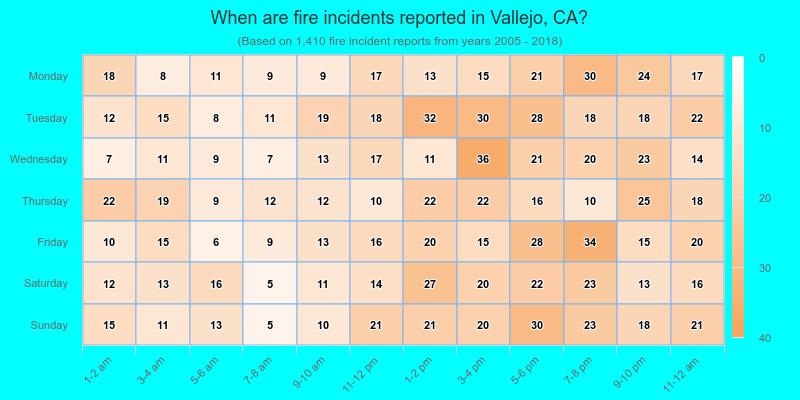
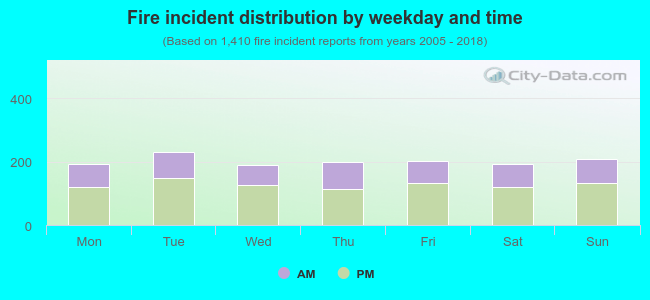 36.7% incidents where reported in the morning and 63.3% in the evening. The most fires (16.4%) took place on Tuesday, and the least (13.4%) on Wednesday.
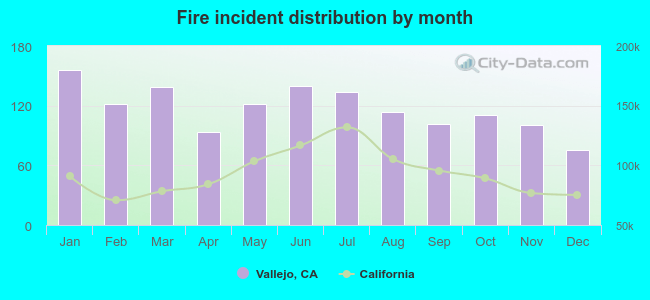 According to the 1,410 incident reports from years 2005 - 2018 most fires (11.1%) took place during January, and the least (5.3%) in December.
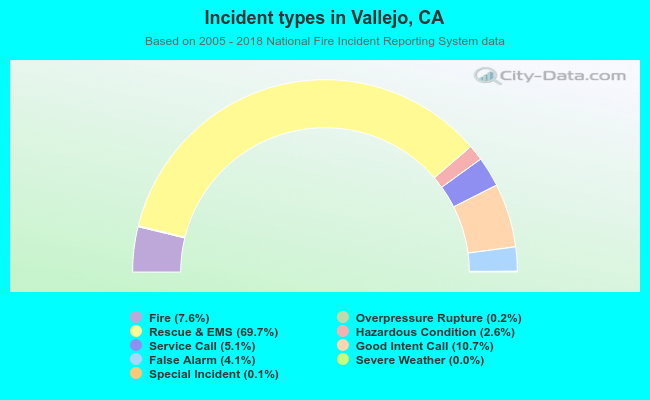 Out of all 18,596 cases reported during the years 2005 - 2018, the most belonged to the categories: Rescue & EMS (69.7%), Good Intent Call (10.7%), and Fire (7.6%).
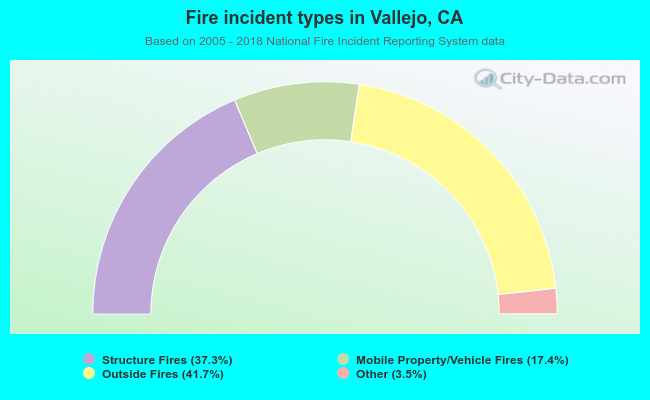 When looking into fire subcategories, the most incidents belonged to: Outside Fires (41.7%), and Structure Fires (37.3%).