Rodeo: Fire Incidents, California (CA)
Where are fire incidents reported in Rodeo, CA
Something went wrong! Please refresh the page.
|
| |||||||||||||||||||||||||||||||||||||||||||||||||||||||||||||||||||||||||||||||||||||||||||||||||||||||||||||
2002 - 2018 National Fire Incident Reporting System (NFIRS) incidents
- Incident types reported to NFIRS in Rodeo, CA
- 1,61050.1%Rescue & EMS
- 71922.4%Fire
- 40912.7%Good Intent Call
- 2016.3%Hazardous Condition
- 1424.4%False Alarm
- 1253.9%Service Call
- 40.1%Special Incident
- Fire incident types reported to NFIRS in Rodeo, CA
- 31343.5%Outside Fires
- 27338.0%Structure Fires
- 9012.5%Mobile Property/Vehicle Fires
- 436.0%Other
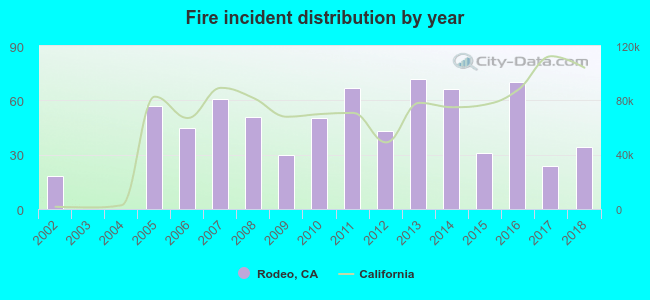 According to the data from the years 2002 - 2018 the average number of fire incidents per year is 42. The highest number of reported fires - 72 took place in 2013, and the least - 0 in 2003. The data has a rising trend.
The average number of yearly fire incidents per 10k residents in Rodeo, CA compared to nearest cities:
(Note: Based on data for the last 3 years, including only cities with population 5,000 and above)
| Rodeo: | 49.2 |
| Hercules: | 13.4 |
| Pinole: | 18.5 |
| El Sobrante: | 14.5 |
| Briones: | 1.5 |
| Vallejo: | 19.0 |
| Benicia: | 27.3 |
| San Pablo: | 41.0 |
| Richmond: | 41.0 |
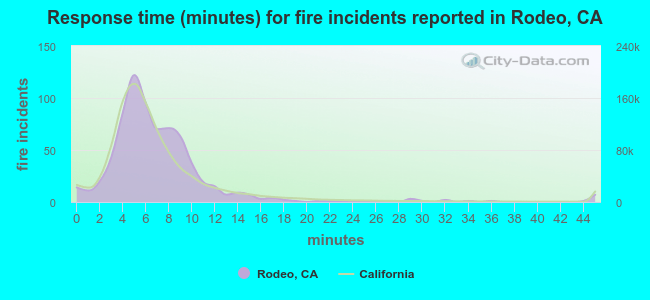 The median response time based on all reported fire incidents is 6 minutes. This is comparable to the California median value.
The median response time in Rodeo, CA compared to nearest cities:
(Note: Based on data for all years, including only cities with at least 500 fire incidents)
| Rodeo: | 6 minutes |
| Hercules: | 6 minutes |
| Vallejo: | 5 minutes |
| Benicia: | 6 minutes |
| San Pablo: | 7 minutes |
| Richmond: | 7 minutes |
| Martinez: | 7 minutes |
| El Cerrito: | 6 minutes |
| American Canyon: | 5 minutes |
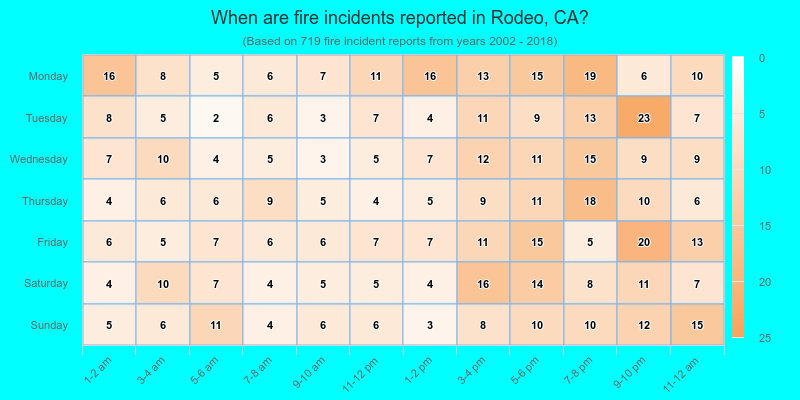
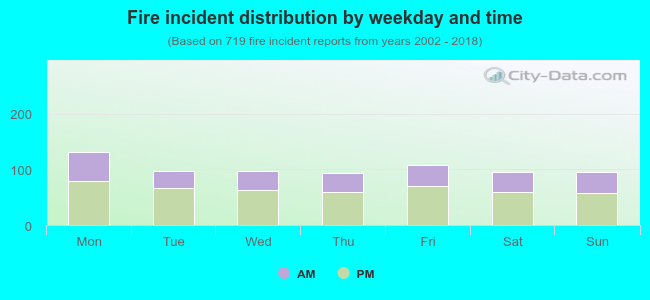 36.4% incidents where reported in the morning and 63.6% in the evening. The most fires (18.4%) took place on Monday, and the least (12.9%) on Thursday.
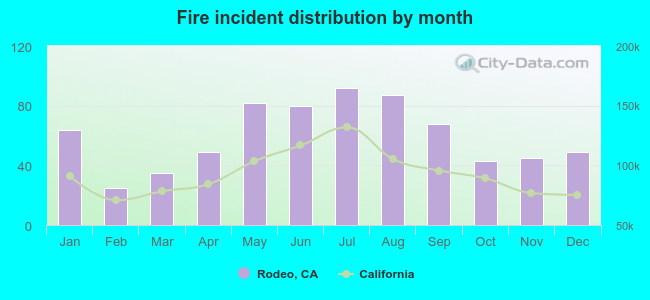 According to the 719 fire incident reports from years 2002 - 2018 most fires (12.8%) took place during July, and the least (3.5%) in February.
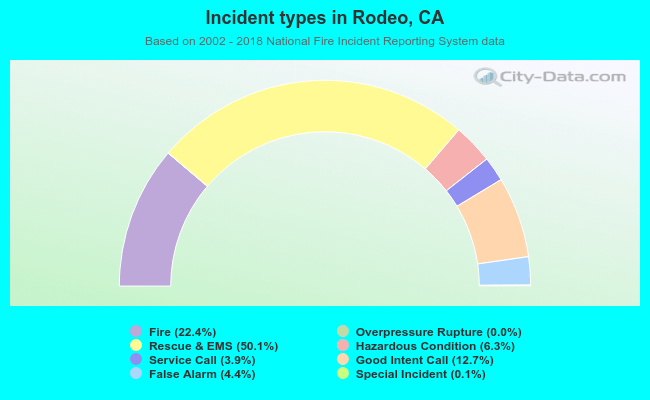 Out of all 3,211 cases reported during the years 2002 - 2018, the most belonged to the categories: Rescue & EMS (50.1%), Fire (22.4%), and Good Intent Call (12.7%).
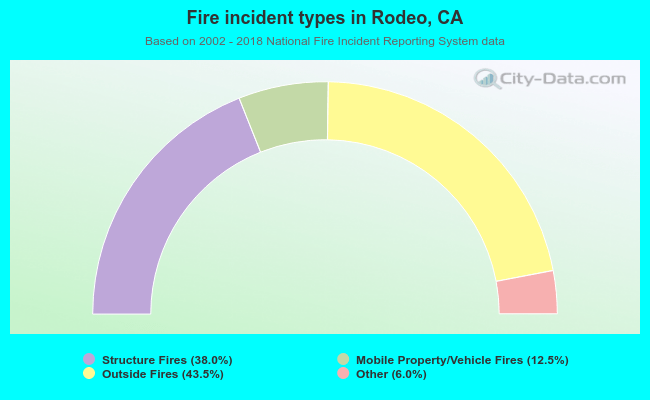 When looking into fire subcategories, the most incidents belonged to: Outside Fires (43.5%), and Structure Fires (38.0%).