Benicia: Fire Incidents, California (CA)
Where are fire incidents reported in Benicia, CA
Something went wrong! Please refresh the page.
| Fire incidents reported | |
|---|---|
| Sreet name | Count |
| I780 | 102 |
| SOUTHAMPTON RD | 84 |
| LAKE HERMAN RD | 76 |
| 2ND ST | 66 |
| I680 | 62 |
| ROSE DR | 48 |
| K ST | 40 |
| INDUSTRIAL | 32 |
| PARK RD | 30 |
| SECOND ST | 30 |
| BAYSHORE RD | 28 |
| H ST | 28 |
| I ST | 24 |
| INDUSTRIAL WAY | 24 |
| J ST | 24 |
| L ST | 24 |
| MILITARY EAST | 20 |
| STONE RD | 20 |
| 9TH ST | 18 |
| EAST SECOND ST | 18 |
| 5TH ST | 16 |
| PANORAMA DR | 16 |
| 1ST ST | 14 |
| 4TH ST | 14 |
| CAMBRIDGE DR | 14 |
| FIRST ST | 14 |
| GOODYEAR RD | 14 |
| I 780 | 14 |
| LOPES RD | 14 |
| MILITARY | 14 |
2005 - 2018 National Fire Incident Reporting System (NFIRS) incidents
- Incident types reported to NFIRS in Benicia, CA
- 6,04460.0%Rescue & EMS
- 1,02910.2%Service Call
- 9109.0%Fire
- 8758.7%Good Intent Call
- 6336.3%Hazardous Condition
- 5385.3%False Alarm
- 190.2%Overpressure Rupture
- 190.2%Special Incident
- 120.1%Severe Weather
- Fire incident types reported to NFIRS in Benicia, CA
- 47752.4%Outside Fires
- 24026.4%Structure Fires
- 15016.5%Mobile Property/Vehicle Fires
- 434.7%Other
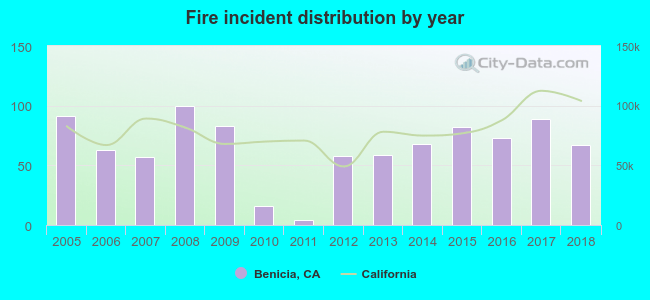 Based on the data from the years 2005 - 2018 the average number of fires per year is 65. The highest number of reported fire incidents - 100 took place in 2008, and the least - 4 in 2011. The data has a dropping trend.
The average number of yearly fire incidents per 10k residents in Benicia, CA compared to nearest cities:
(Note: Based on data for the last 3 years, including only cities with population 5,000 and above)
| Benicia: | 27.3 |
| Martinez: | 21.8 |
| Vallejo: | 19.0 |
| Rodeo: | 49.2 |
| Hercules: | 13.4 |
| Briones: | 1.5 |
| Pinole: | 18.5 |
| American Canyon: | 14.5 |
| Pleasant Hill: | 25.1 |
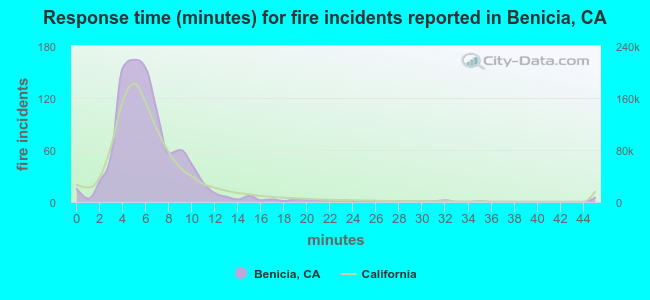 The median response time based on all reported fire incidents is 6 minutes. This is similar to the California median value.
The median response time in Benicia, CA compared to nearest cities:
(Note: Based on data for all years, including only cities with at least 500 fire incidents)
| Benicia: | 6 minutes |
| Martinez: | 7 minutes |
| Vallejo: | 5 minutes |
| Rodeo: | 6 minutes |
| Hercules: | 6 minutes |
| American Canyon: | 5 minutes |
| Pleasant Hill: | 6 minutes |
| Concord: | 6 minutes |
| Bay Point: | 7 minutes |
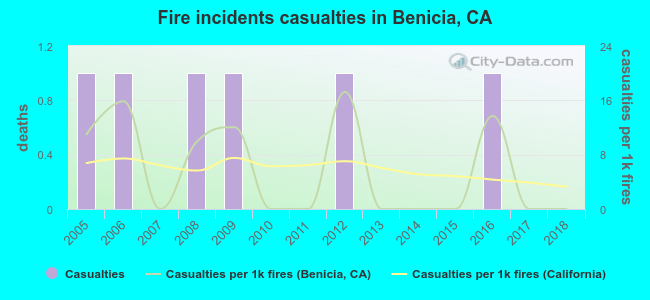 Based on the reports from the years 2005 - 2018 the average number of fire-related casualties per year is 0. The highest number of reported injuries - 1 took place in 2005, and the lowest - 0 in 2007. The data has a decreasing trend.
The average number of injuries per 1,000 fire incidents is 6. This indicator was the highest - 17 in 2012, and the lowest 0 in 2007. The trend for injuries per 1,000 incidents is declining. Compared to the state value the number of injuries per 1,000 fire incidents is about the same.
Based on the reports from the years 2005 - 2018 the average number of fire-related casualties per year is 0. The highest number of reported injuries - 1 took place in 2005, and the lowest - 0 in 2007. The data has a decreasing trend.
The average number of injuries per 1,000 fire incidents is 6. This indicator was the highest - 17 in 2012, and the lowest 0 in 2007. The trend for injuries per 1,000 incidents is declining. Compared to the state value the number of injuries per 1,000 fire incidents is about the same.Casualties per 1,000 incidents in Benicia, CA compared to nearest cities:
(Note: Based on data for all years, including only cities with at least 500 fire incidents)
| Benicia: | 6.6 |
| Martinez: | 0.8 |
| Vallejo: | 5.0 |
| Rodeo: | 1.4 |
| Hercules: | 4.9 |
| American Canyon: | 1.7 |
| Pleasant Hill: | 2.9 |
| Concord: | 1.5 |
| Bay Point: | 4.1 |
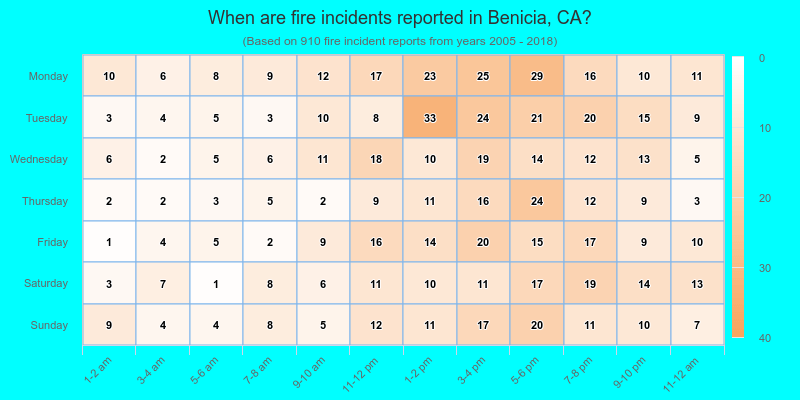
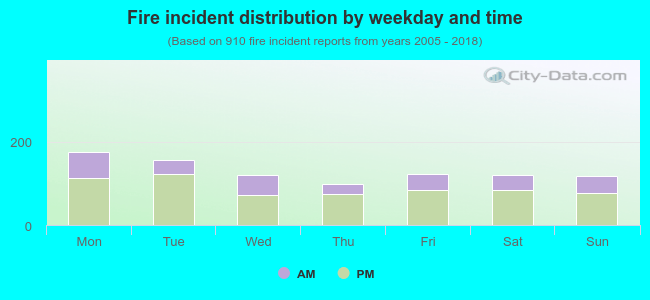 30.9% incidents where reported in the morning and 69.1% in the evening. The most fires (19.3%) took place on Monday, and the least (10.8%) on Thursday.
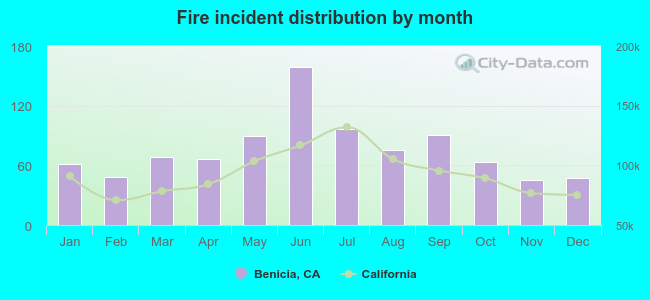 Based on the 910 fires from years 2005 - 2018 most fires (17.5%) took place during June, and the least (4.9%) in November.
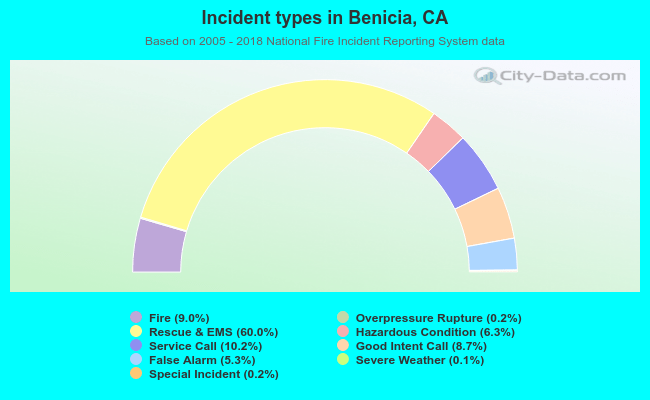 Out of all 10,079 cases reported during the years 2005 - 2018, the most belonged to the categories: Rescue & EMS (60.0%), Service Call (10.2%), and Fire (9.0%).
 When looking into fire subcategories, the most incidents belonged to: Outside Fires (52.4%), and Structure Fires (26.4%).