Martinez: Fire Incidents, California (CA)
Where are fire incidents reported in Martinez, CA
Something went wrong! Please refresh the page.
|
| |||||||||||||||||||||||||||||||||||||||||||||||||||||||||||||||||||||||||||||||||||||||||||||||||||||||||||||
2005 - 2018 National Fire Incident Reporting System (NFIRS) incidents
- Incident types reported to NFIRS in Martinez, CA
- 4,32049.1%Rescue & EMS
- 1,78720.3%Good Intent Call
- 1,18513.5%Fire
- 7498.5%Hazardous Condition
- 4004.6%Service Call
- 3383.8%False Alarm
- 90.1%Special Incident
- Fire incident types reported to NFIRS in Martinez, CA
- 54045.6%Outside Fires
- 31626.7%Structure Fires
- 27323.0%Mobile Property/Vehicle Fires
- 564.7%Other
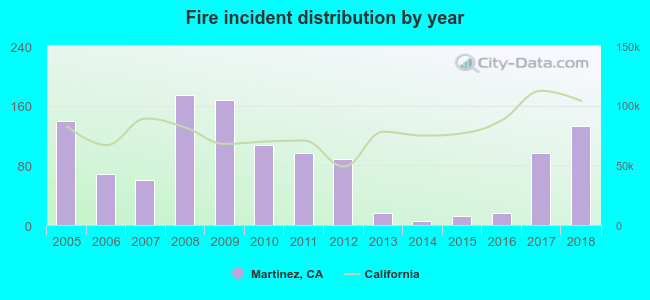 Based on the data from the years 2005 - 2018 the average number of fires per year is 84. The highest number of reported fire incidents - 174 took place in 2008, and the least - 5 in 2014. The data has a decreasing trend.
The average number of yearly fire incidents per 10k residents in Martinez, CA compared to nearest cities:
(Note: Based on data for the last 3 years, including only cities with population 5,000 and above)
| Martinez: | 21.8 |
| Pleasant Hill: | 25.1 |
| Benicia: | 27.3 |
| Concord: | 16.0 |
| Briones: | 1.5 |
| Walnut Creek: | 13.3 |
| Hercules: | 13.4 |
| Lafayette: | 18.8 |
| Rodeo: | 49.2 |
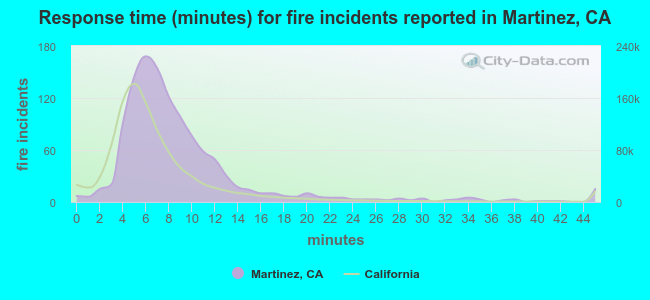 The median response time based on all reported fire incidents is 7 minutes. This is close to the state median value.
The median response time in Martinez, CA compared to nearest cities:
(Note: Based on data for all years, including only cities with at least 500 fire incidents)
| Martinez: | 7 minutes |
| Pleasant Hill: | 6 minutes |
| Benicia: | 6 minutes |
| Concord: | 6 minutes |
| Walnut Creek: | 6 minutes |
| Hercules: | 6 minutes |
| Lafayette: | 7 minutes |
| Rodeo: | 6 minutes |
| Bay Point: | 7 minutes |
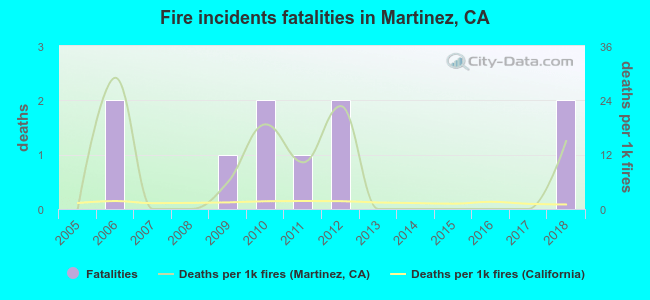 Based on the reports from the years 2005 - 2018 the average number of fire-related yearly deaths is 1. The highest number of deaths - 2 took place in 2006, and the lowest - 0 in 2005. The data has a rising trend.
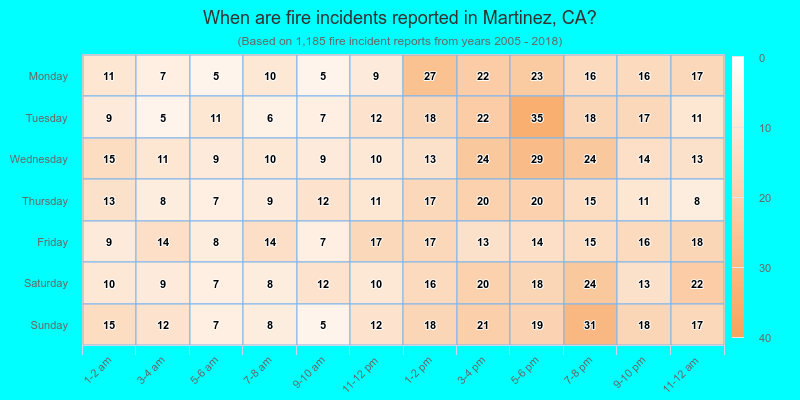
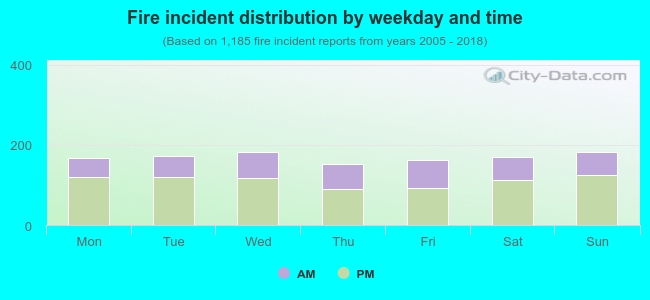 34.2% incidents where reported in the morning and 65.8% in the evening. The most fires (15.4%) took place on Sunday, and the least (12.7%) on Thursday.
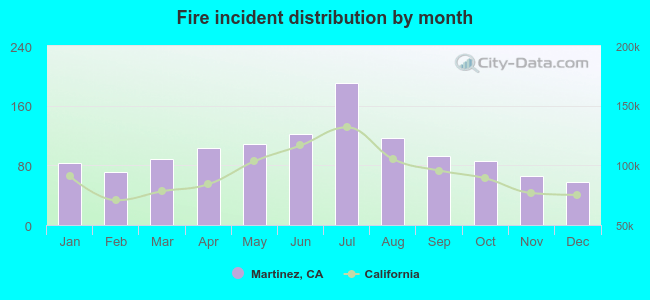 According to the 1,185 fire incident reports from years 2005 - 2018 most fires (16.1%) took place during July, and the least (4.9%) in December.
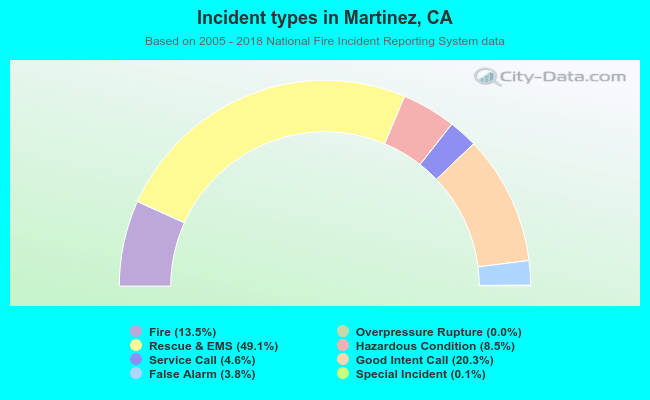 Out of all 8,790 cases reported during the years 2005 - 2018, the most belonged to the categories: Rescue & EMS (49.1%), Good Intent Call (20.3%), and Fire (13.5%).
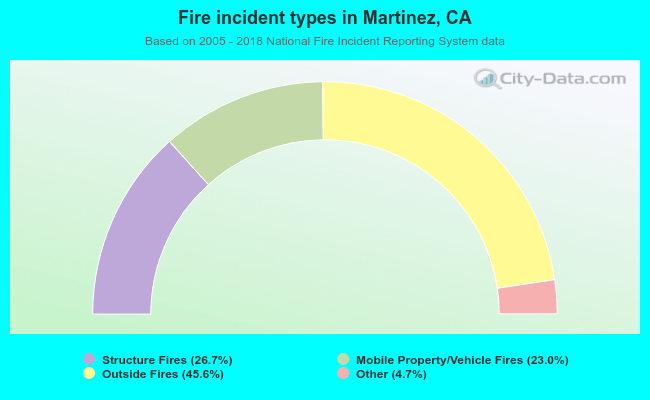 When looking into fire subcategories, the most incidents belonged to: Outside Fires (45.6%), and Structure Fires (26.7%).