American Canyon: Fire Incidents, California (CA)
Where are fire incidents reported in American Canyon, CA
Something went wrong! Please refresh the page.
|
| |||||||||||||||||||||||||||||||||||||||||||||||||||||||||||||||||||||||||||||||||||||||||||||||||||||||||||||
| Other | 19 | |||||||||||||||||||||||||||||||||||||||||||||||||||||||||||||||||||||||||||||||||||||||||||||||||||||||||||||
2005 - 2018 National Fire Incident Reporting System (NFIRS) incidents
- Incident types reported to NFIRS in American Canyon, CA
- 3,31658.1%Rescue & EMS
- 70512.3%Good Intent Call
- 60510.6%Fire
- 4207.4%Hazardous Condition
- 3416.0%False Alarm
- 3195.6%Service Call
- Fire incident types reported to NFIRS in American Canyon, CA
- 28346.8%Outside Fires
- 20734.2%Structure Fires
- 8013.2%Mobile Property/Vehicle Fires
- 355.8%Other
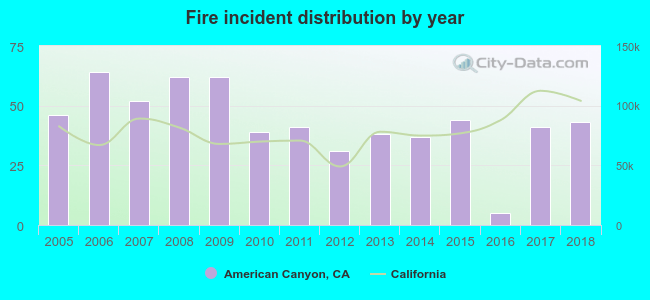 According to the data from the years 2005 - 2018 the average number of fire incidents per year is 43. The highest number of reported fires - 64 took place in 2006, and the least - 5 in 2016. The data has a dropping trend.
The average number of yearly fire incidents per 10k residents in American Canyon, CA compared to nearest cities:
(Note: Based on data for the last 3 years, including only cities with population 5,000 and above)
| American Canyon: | 14.5 |
| Vallejo: | 19.0 |
| Benicia: | 27.3 |
| Rodeo: | 49.2 |
| Napa: | 27.3 |
| Hercules: | 13.4 |
| Pinole: | 18.5 |
| Fairfield: | 9.0 |
| Martinez: | 21.8 |
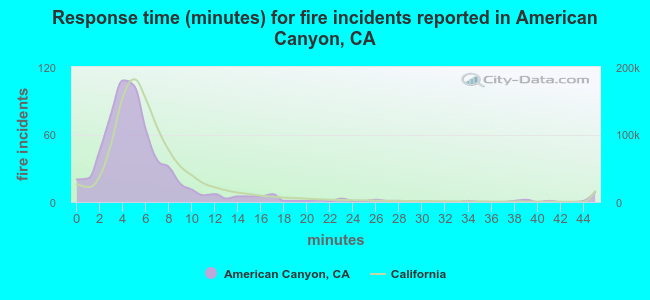 The median response time based on all reported fire incidents is 5 minutes. This is lower than the state median value.
The median response time in American Canyon, CA compared to nearest cities:
(Note: Based on data for all years, including only cities with at least 500 fire incidents)
| American Canyon: | 5 minutes |
| Vallejo: | 5 minutes |
| Benicia: | 6 minutes |
| Rodeo: | 6 minutes |
| Napa: | 6 minutes |
| Hercules: | 6 minutes |
| Fairfield: | 7 minutes |
| Martinez: | 7 minutes |
| Suisun City: | 5 minutes |
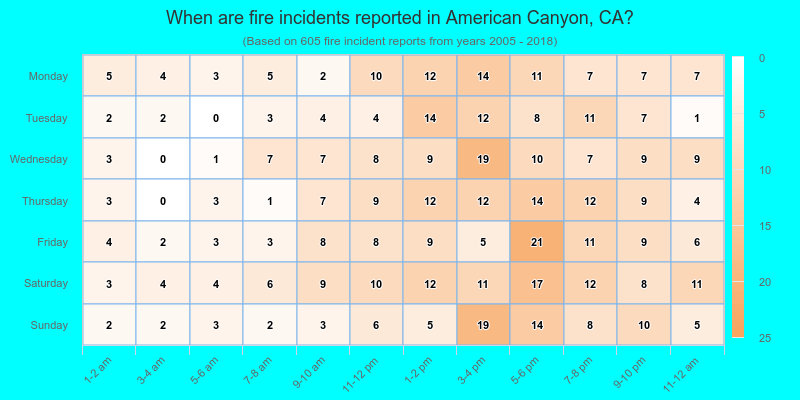
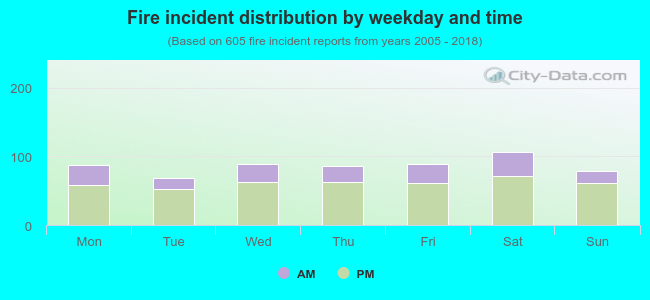 28.9% incidents where reported in the morning and 71.1% in the evening. The most fires (17.7%) took place on Saturday, and the least (11.2%) on Tuesday.
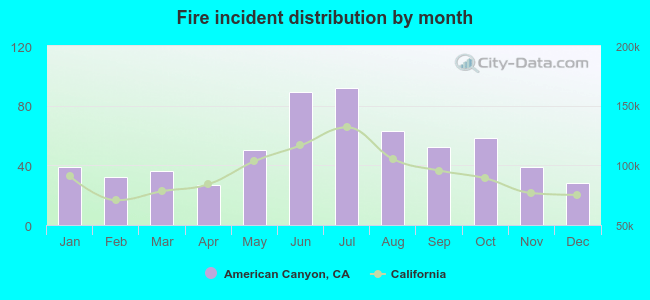 According to the 605 fire incident reports from years 2005 - 2018 most fires (15.2%) took place during July, and the least (4.5%) in April.
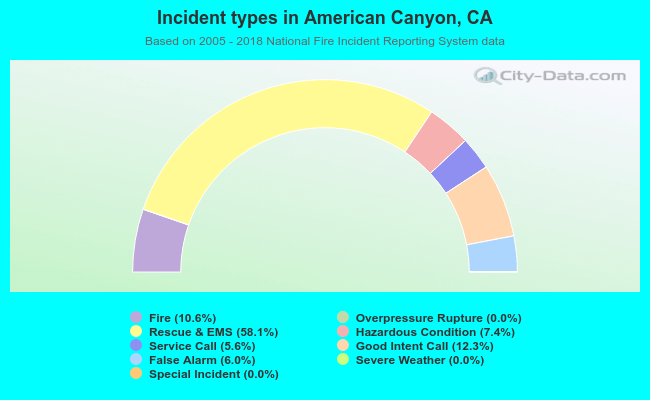 Out of all 5,709 cases reported during the years 2005 - 2018, the most belonged to the categories: Rescue & EMS (58.1%), Good Intent Call (12.3%), and Fire (10.6%).
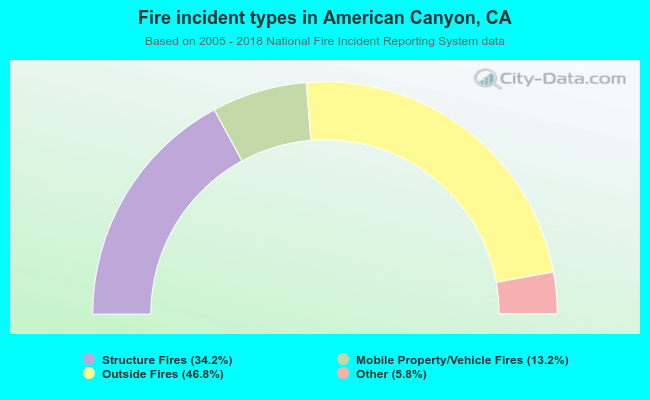 When looking into fire subcategories, the most reports belonged to: Outside Fires (46.8%), and Structure Fires (34.2%).