Napa: Fire Incidents, California (CA)
Where are fire incidents reported in Napa, CA
Something went wrong! Please refresh the page.
| Fire incidents reported | |
|---|---|
| Sreet name | Count |
| SOSCOL AVE | 206 |
| JEFFERSON ST | 182 |
| 1ST ST | 148 |
| LINCOLN AVE | 128 |
| SILVERADO TRL | 116 |
| STHY 29 | 112 |
| TRANCAS ST | 106 |
| OLD SONOMA RD | 98 |
| SOLANO AVE | 98 |
| IMOLA AVE | 80 |
| BROWNS VALLEY RD | 76 |
| TROWER AVE | 76 |
| MAIN ST | 72 |
| REDWOOD RD | 72 |
| LAUREL ST | 70 |
| PUEBLO AVE | 66 |
| COOMBSVILLE RD | 64 |
| CALIFORNIA BLVD | 58 |
| ATLAS PEAK RD | 56 |
| DRY CREEK RD | 56 |
| 3RD ST | 48 |
| BROWN ST | 46 |
| SEMINARY ST | 46 |
| PEARL ST | 44 |
| COOMBS ST | 40 |
| PARK AVE | 40 |
| PARTRICK RD | 40 |
| SHETLER AVE | 40 |
| SODA CANYON RD | 40 |
| BUHMAN AVE | 38 |
| Other | 860 |
2005 - 2018 National Fire Incident Reporting System (NFIRS) incidents
- Incident types reported to NFIRS in Napa, CA
- 28,61461.7%Rescue & EMS
- 4,79510.3%Good Intent Call
- 4,2219.1%Service Call
- 3,2357.0%Hazardous Condition
- 3,2226.9%Fire
- 2,2184.8%False Alarm
- Fire incident types reported to NFIRS in Napa, CA
- 1,43044.4%Outside Fires
- 1,12534.9%Structure Fires
- 41012.7%Mobile Property/Vehicle Fires
- 2578.0%Other
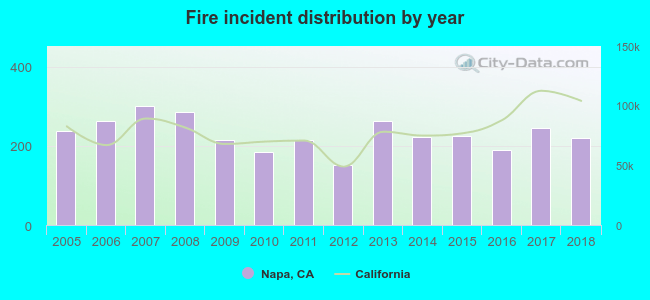 According to the data from the years 2005 - 2018 the average number of fire incidents per year is 230. The highest number of fire incidents - 302 took place in 2007, and the least - 151 in 2012. The data has a dropping trend.
The average number of yearly fire incidents per 10k residents in Napa, CA compared to nearest cities:
(Note: Based on data for the last 3 years, including only cities with population 5,000 and above)
| Napa: | 27.3 |
| Sonoma: | 91.7 |
| American Canyon: | 14.5 |
| Boyes Hot Springs: | 3.0 |
| Fairfield: | 9.0 |
| Vallejo: | 19.0 |
| Suisun City: | 23.7 |
| Vacaville: | 20.9 |
| Benicia: | 27.3 |
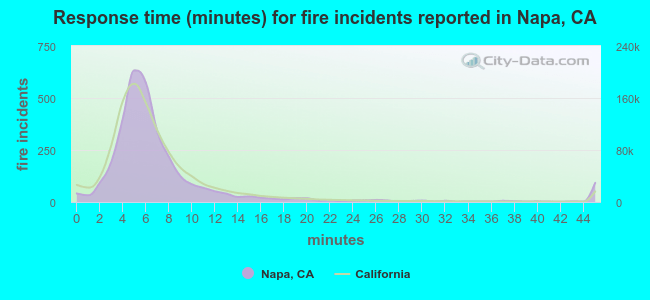 The median response time based on all reported fire incidents is 6 minutes. This is close to the state median value.
The median response time in Napa, CA compared to nearest cities:
(Note: Based on data for all years, including only cities with at least 500 fire incidents)
| Napa: | 6 minutes |
| Sonoma: | 8 minutes |
| American Canyon: | 5 minutes |
| Fairfield: | 7 minutes |
| Vallejo: | 5 minutes |
| Suisun City: | 5 minutes |
| Vacaville: | 7 minutes |
| Benicia: | 6 minutes |
| Petaluma: | 7 minutes |
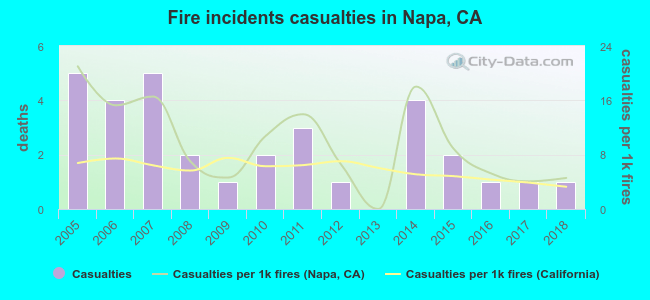 Based on the data from the years 2005 - 2018 the average number of fire-related casualties per year is 2. The highest number of injuries - 5 took place in 2005, and the lowest - 0 in 2013. The data has a decreasing trend.
The average number of injuries per 1,000 fires is 10. This indicator was the highest - 21 in 2005, and the lowest 0 in 2013. The trend for casualties per 1,000 fires is declining. Compared to the state value the number of injuries per 1,000 incidents is higher.
Based on the data from the years 2005 - 2018 the average number of fire-related casualties per year is 2. The highest number of injuries - 5 took place in 2005, and the lowest - 0 in 2013. The data has a decreasing trend.
The average number of injuries per 1,000 fires is 10. This indicator was the highest - 21 in 2005, and the lowest 0 in 2013. The trend for casualties per 1,000 fires is declining. Compared to the state value the number of injuries per 1,000 incidents is higher.Casualties per 1,000 incidents in Napa, CA compared to nearest cities:
(Note: Based on data for all years, including only cities with at least 500 fire incidents)
| Napa: | 9.9 |
| Sonoma: | 2.9 |
| American Canyon: | 1.7 |
| Fairfield: | 2.6 |
| Vallejo: | 5.0 |
| Suisun City: | 0.0 |
| Vacaville: | 6.4 |
| Benicia: | 6.6 |
| Petaluma: | 6.6 |
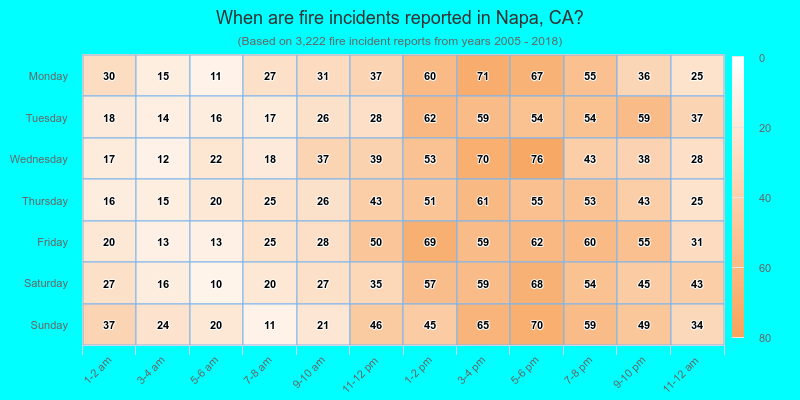
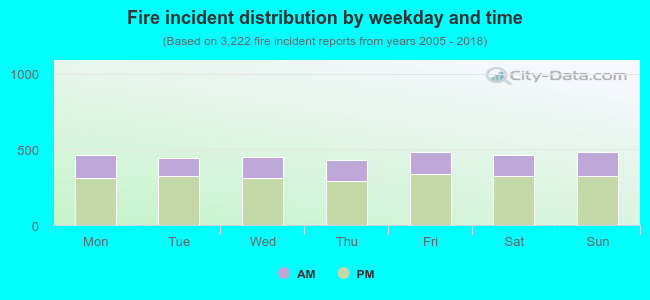 31.1% incidents where reported in the morning and 68.9% in the evening. The most fires (15.1%) took place on Friday, and the least (13.4%) on Thursday.
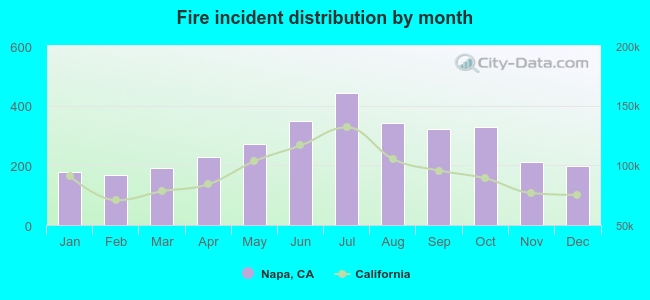 Based on the 3,222 fire incidents from years 2005 - 2018 most fires (13.7%) took place during July, and the least (5.2%) in February.
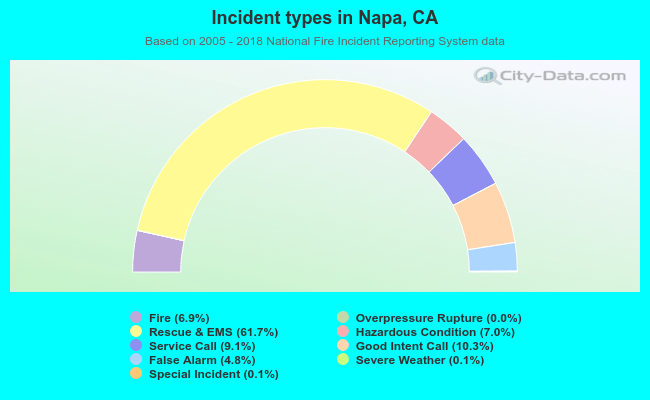 Out of all 46,387 cases reported during the years 2005 - 2018, the most belonged to the categories: Rescue & EMS (61.7%), Good Intent Call (10.3%), and Service Call (9.1%).
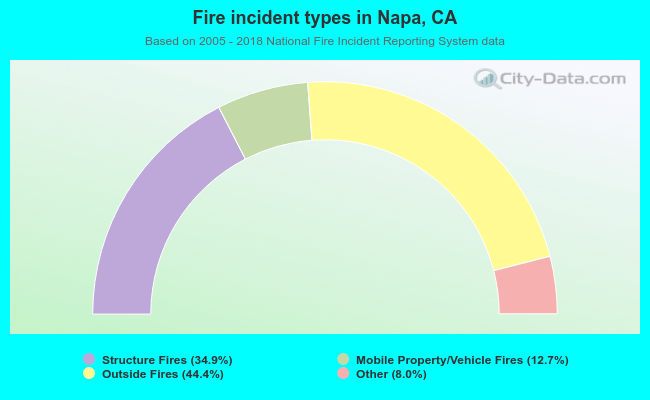 When looking into fire subcategories, the most incidents belonged to: Outside Fires (44.4%), and Structure Fires (34.9%).