Fairfield: Fire Incidents, California (CA)
Where are fire incidents reported in Fairfield, CA
Something went wrong! Please refresh the page.
| Fire incidents reported | |
|---|---|
| Sreet name | Count |
| TEXAS ST | 156 |
| CORDELIA RD | 110 |
| HIGHWAY 12 | 96 |
| NORTHBOUND INTERSTATE 680 | 86 |
| INTERSTATE 80 WESTBOUND | 82 |
| TABOR AV | 82 |
| SUISUN VALLEY RD | 80 |
| WESTBOUND INTERSTATE 80 FWY | 74 |
| GRIZZLY ISLAND RD | 56 |
| SOUTHBOUND INTERSTATE 680 HWY | 56 |
| WEBSTER ST | 56 |
| WEST BOUND 80 | 50 |
| TRAVIS BL | 48 |
| EASTBOUND INTERSTATE 80 FWY | 44 |
| EASTBOUND INTERSTATE 80 FWY | 42 |
| ROCKVILLE RD | 42 |
| ABERNATHY RD | 38 |
| GREEN VALLEY RD | 32 |
| ROCKVILLE ROAD RD | 32 |
| MANKAS CORNERS RD | 28 |
| EB80 | 26 |
| I 80 | 26 |
| LAKE HERMAN RD | 26 |
| WB80 | 24 |
| LOPES RD | 22 |
| PENNSYLVANIA AV | 22 |
| TWIN SISTERS RD | 22 |
| GOODYEAR RD | 20 |
| GORDON VALLEY RD | 20 |
| INTERSTATE 80 HY | 20 |
| Other | 408 |
2005 - 2018 National Fire Incident Reporting System (NFIRS) incidents
- Incident types reported to NFIRS in Fairfield, CA
- 1,92640.6%Fire
- 1,14124.0%Rescue & EMS
- 51510.8%Hazardous Condition
- 3818.0%Good Intent Call
- 2856.0%Special Incident
- 2825.9%Service Call
- 2124.5%False Alarm
- 70.1%Severe Weather
- Fire incident types reported to NFIRS in Fairfield, CA
- 1,21262.9%Outside Fires
- 35218.3%Structure Fires
- 27414.2%Mobile Property/Vehicle Fires
- 884.6%Other
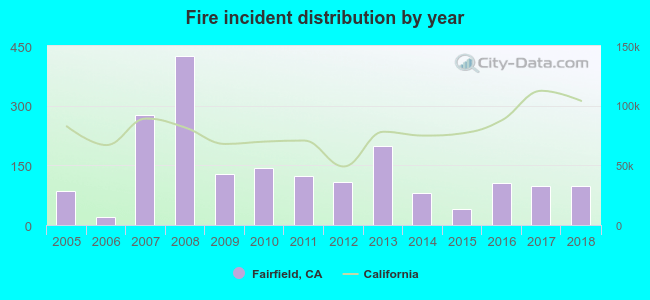 Based on the data from the years 2005 - 2018 the average number of fires per year is 138. The highest number of reported fires - 425 took place in 2008, and the least - 19 in 2006. The data has an increasing trend.
The average number of yearly fire incidents per 10k residents in Fairfield, CA compared to nearest cities:
(Note: Based on data for the last 3 years, including only cities with population 5,000 and above)
| Fairfield: | 9.0 |
| Suisun City: | 23.7 |
| Vacaville: | 20.9 |
| American Canyon: | 14.5 |
| Napa: | 27.3 |
| Vallejo: | 19.0 |
| Benicia: | 27.3 |
| Bay Point: | 54.3 |
| Dixon: | 3.7 |
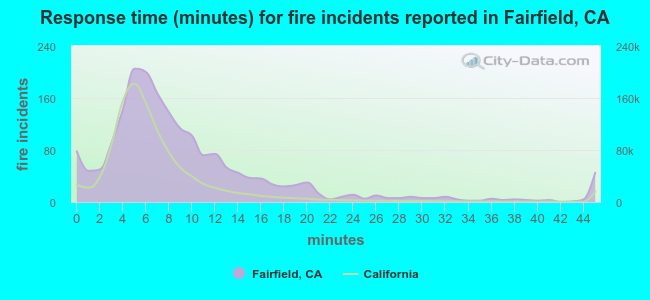 The median response time based on all reported fire incidents is 7 minutes. This is close to the state median value.
The median response time in Fairfield, CA compared to nearest cities:
(Note: Based on data for all years, including only cities with at least 500 fire incidents)
| Fairfield: | 7 minutes |
| Suisun City: | 5 minutes |
| Vacaville: | 7 minutes |
| American Canyon: | 5 minutes |
| Napa: | 6 minutes |
| Vallejo: | 5 minutes |
| Benicia: | 6 minutes |
| Bay Point: | 7 minutes |
| Dixon: | 8 minutes |
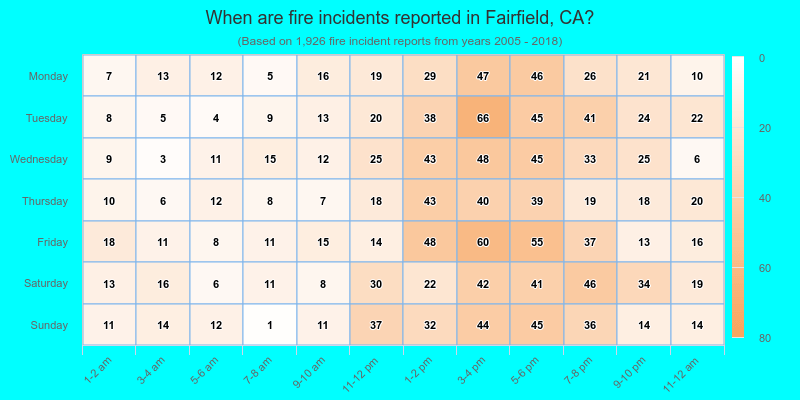
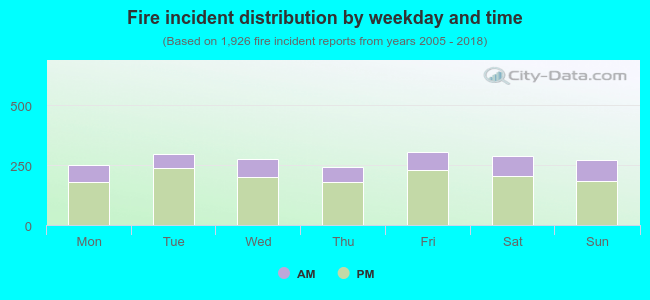 26.7% incidents where reported in the morning and 73.3% in the evening. The most fires (15.9%) took place on Friday, and the least (12.5%) on Thursday.
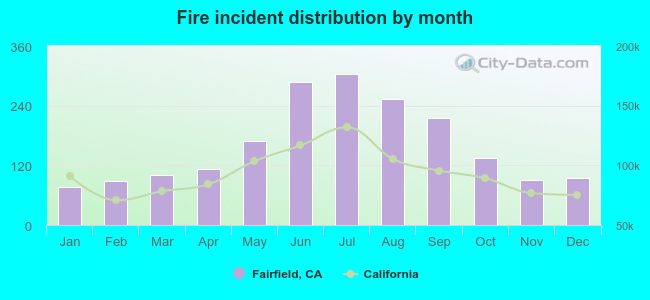 Based on the 1,926 fires from years 2005 - 2018 most fires (15.7%) took place during July, and the least (4.0%) in January.
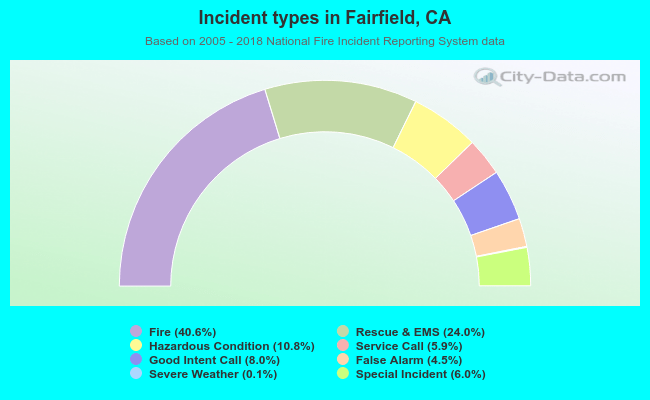 Out of all 4,749 cases reported during the years 2005 - 2018, the most belonged to the categories: Fire (40.6%), Overpressure Rupture (24.0%), and Rescue & EMS (10.8%).
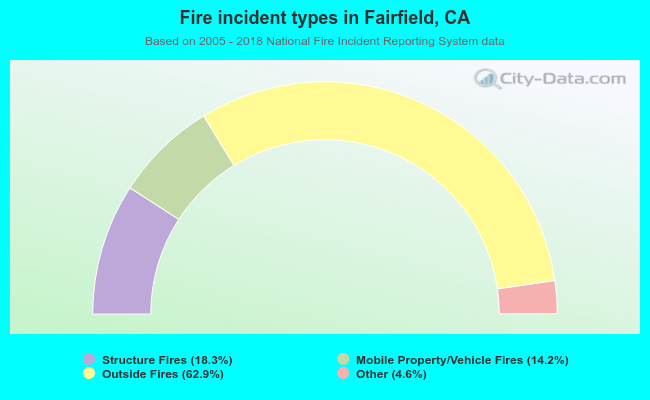 When looking into fire subcategories, the most incidents belonged to: Outside Fires (62.9%), and Structure Fires (18.3%).