Richmond: Fire Incidents, California (CA)
Where are fire incidents reported in Richmond, CA
Something went wrong! Please refresh the page.
| Fire incidents reported | |
|---|---|
| Sreet name | Count |
| RICHMOND PKY | 216 |
| MACDONALD AVE | 200 |
| SAN PABLO AVE | 188 |
| CARLSON BLVD | 168 |
| CUTTING BLVD | 168 |
| 23RD ST | 164 |
| NEVIN AVE | 148 |
| 7TH ST | 146 |
| 6TH ST | 138 |
| 2ND ST | 126 |
| 3RD ST | 124 |
| BARRETT AVE | 122 |
| 4TH ST | 120 |
| OHIO AVE | 118 |
| BROOKSIDE DR | 116 |
| 1ST ST | 104 |
| 580 | 104 |
| MARKET AVE | 102 |
| 80 | 96 |
| 15TH ST | 92 |
| 8TH ST | 92 |
| CHESLEY AVE | 92 |
| HARBOUR WAY | 92 |
| 13TH ST | 88 |
| MARINA WAY | 88 |
| ROOSEVELT AVE | 88 |
| 5TH ST | 80 |
| 16TH ST | 76 |
| 22ND ST | 76 |
| PULLMAN AVE | 76 |
| Other | 1,658 |
2005 - 2018 National Fire Incident Reporting System (NFIRS) incidents
- Incident types reported to NFIRS in Richmond, CA
- 13,03947.7%Rescue & EMS
- 5,74721.0%Good Intent Call
- 5,26619.3%Fire
- 1,4805.4%Hazardous Condition
- 9803.6%False Alarm
- 7802.9%Service Call
- Fire incident types reported to NFIRS in Richmond, CA
- 2,28043.3%Structure Fires
- 1,70832.4%Outside Fires
- 1,08020.5%Mobile Property/Vehicle Fires
- 1983.8%Other
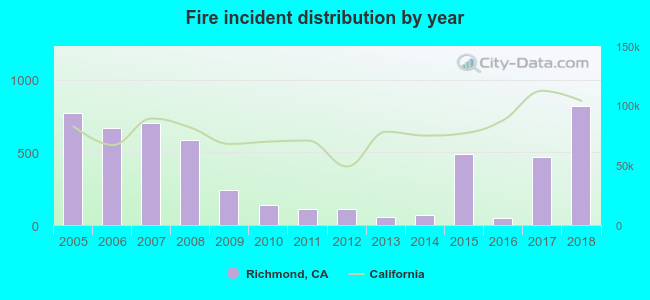 According to the data from the years 2005 - 2018 the average number of fires per year is 376. The highest number of reported fires - 821 took place in 2018, and the least - 49 in 2016. The data has a growing trend.
The average number of yearly fire incidents per 10k residents in Richmond, CA compared to nearest cities:
(Note: Based on data for the last 3 years, including only cities with population 5,000 and above)
| Richmond: | 41.0 |
| San Pablo: | 41.0 |
| El Cerrito: | 25.2 |
| El Sobrante: | 14.5 |
| Albany: | 19.3 |
| Kensington: | 11.2 |
| Pinole: | 18.5 |
| Berkeley: | 22.9 |
| Hercules: | 13.4 |
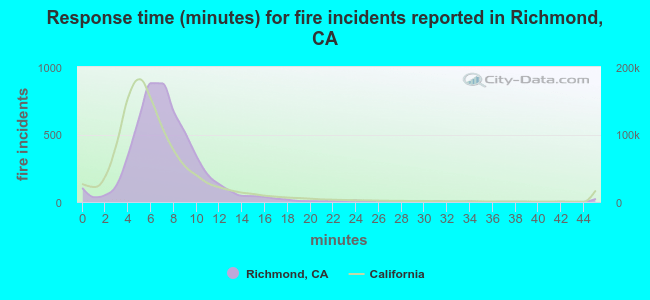 The median response time based on all reported fire incidents is 7 minutes. This is similar to the California median value.
The median response time in Richmond, CA compared to nearest cities:
(Note: Based on data for all years, including only cities with at least 500 fire incidents)
| Richmond: | 7 minutes |
| San Pablo: | 7 minutes |
| El Cerrito: | 6 minutes |
| Albany: | 4 minutes |
| Berkeley: | 5 minutes |
| Hercules: | 6 minutes |
| Rodeo: | 6 minutes |
| Sausalito: | 6 minutes |
| San Rafael: | 5 minutes |
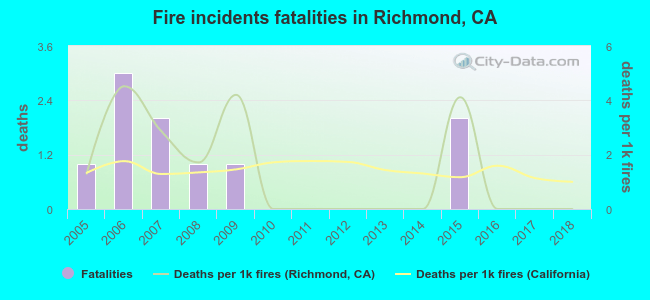 According to the reports from the years 2005 - 2018 the average number of fire-related yearly deaths is 1. The highest number of reported deaths - 3 took place in 2006, and the lowest - 0 in 2010. The data has a declining trend.
The average number of fatalities per 1,000 fire incidents is 1. This indicator was the highest - 5 in 2006, and the lowest 0 in 2010. The trend for fatalities per 1,000 fires is dropping. Compared to the California value the number of deaths per 1,000 fire incidents is higher.
According to the reports from the years 2005 - 2018 the average number of fire-related yearly deaths is 1. The highest number of reported deaths - 3 took place in 2006, and the lowest - 0 in 2010. The data has a declining trend.
The average number of fatalities per 1,000 fire incidents is 1. This indicator was the highest - 5 in 2006, and the lowest 0 in 2010. The trend for fatalities per 1,000 fires is dropping. Compared to the California value the number of deaths per 1,000 fire incidents is higher.Deaths per 1,000 incidents in Richmond, CA compared to nearest cities:
(Note: Based on data for all years, including only cities with at least 2,500 fire incidents)
| Richmond: | 1.9 |
| Berkeley: | 2.0 |
| Oakland: | 4.7 |
| San Francisco: | 1.3 |
| Concord: | 1.2 |
| San Leandro: | 2.4 |
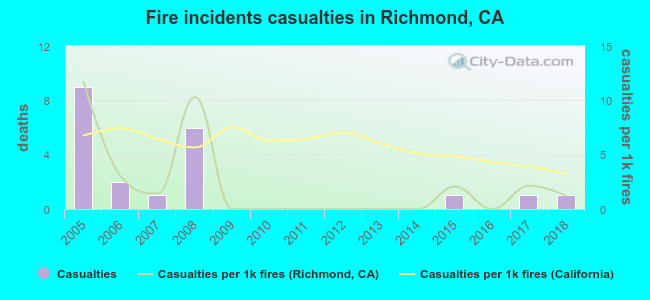 According to the reports from the years 2005 - 2018 the average number of fire-related yearly casualties is 2. The highest number of reported casualties - 9 took place in 2005, and the lowest - 0 in 2009. The data has a decreasing trend.
The average number of injuries per 1,000 fire incidents is 2. This indicator was the highest - 12 in 2005, and the lowest 0 in 2009. The trend for injuries per 1,000 fires is declining. Compared to the California value the number of injuries per 1,000 fires is lower.
According to the reports from the years 2005 - 2018 the average number of fire-related yearly casualties is 2. The highest number of reported casualties - 9 took place in 2005, and the lowest - 0 in 2009. The data has a decreasing trend.
The average number of injuries per 1,000 fire incidents is 2. This indicator was the highest - 12 in 2005, and the lowest 0 in 2009. The trend for injuries per 1,000 fires is declining. Compared to the California value the number of injuries per 1,000 fires is lower.Casualties per 1,000 incidents in Richmond, CA compared to nearest cities:
(Note: Based on data for all years, including only cities with at least 500 fire incidents)
| Richmond: | 4.0 |
| San Pablo: | 1.9 |
| El Cerrito: | 1.3 |
| Albany: | 1.6 |
| Berkeley: | 7.1 |
| Hercules: | 4.9 |
| Rodeo: | 1.4 |
| Sausalito: | 5.5 |
| San Rafael: | 3.1 |
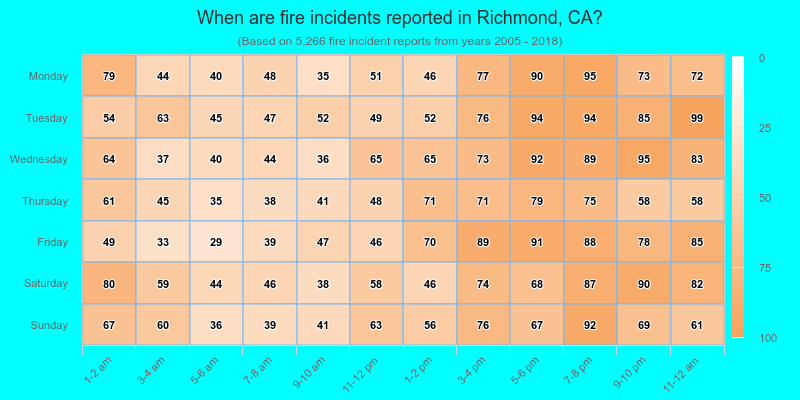
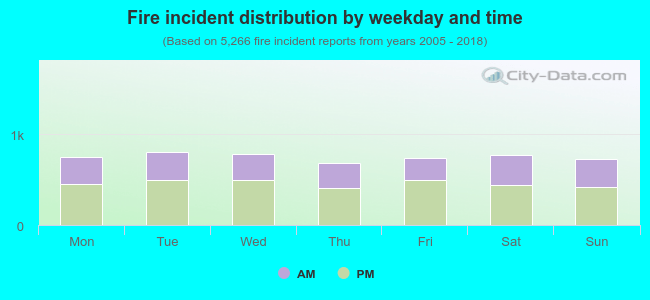 38.6% incidents where reported in the morning and 61.4% in the evening. The most fires (15.4%) took place on Tuesday, and the least (12.9%) on Thursday.
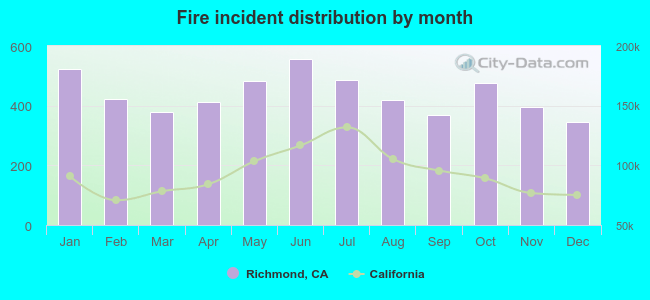 According to the 5,266 fires from years 2005 - 2018 most fires (10.6%) took place during June, and the least (6.6%) in December.
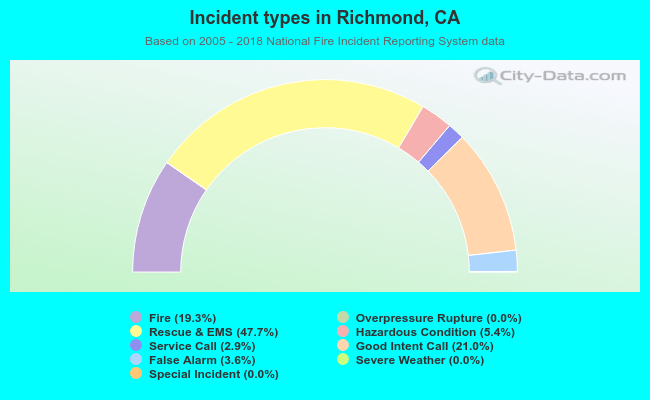 Out of all 27,314 cases reported during the years 2005 - 2018, the most belonged to the categories: Rescue & EMS (47.7%), Good Intent Call (21.0%), and Fire (19.3%).
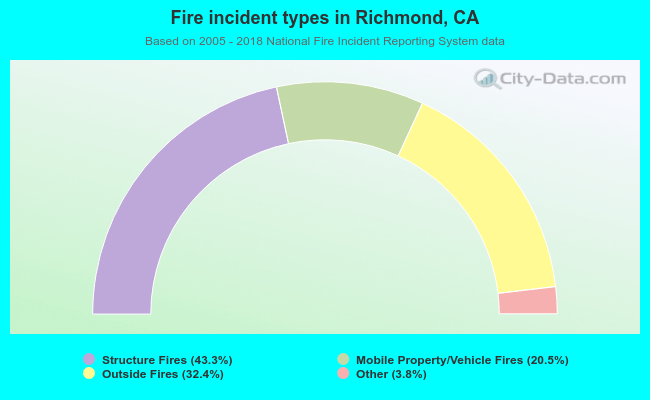 When looking into fire subcategories, the most incidents belonged to: Structure Fires (43.3%), and Outside Fires (32.4%).