El Sobrante: Fire Incidents, California (CA)
Where are fire incidents reported in El Sobrante, CA
Something went wrong! Please refresh the page.
|
| |||||||||||||||||||||||||||||||||||||||||||||||||||||||||||||||||||||||||||||||||||||||||||||||||||||||||||||
2005 - 2018 National Fire Incident Reporting System (NFIRS) incidents
- Incident types reported to NFIRS in El Sobrante, CA
- 1,19349.6%Rescue & EMS
- 43218.0%Good Intent Call
- 35214.6%Fire
- 2179.0%Hazardous Condition
- 1205.0%Service Call
- 873.6%False Alarm
- Fire incident types reported to NFIRS in El Sobrante, CA
- 17750.3%Structure Fires
- 11432.4%Outside Fires
- 5315.1%Mobile Property/Vehicle Fires
- 82.3%Other
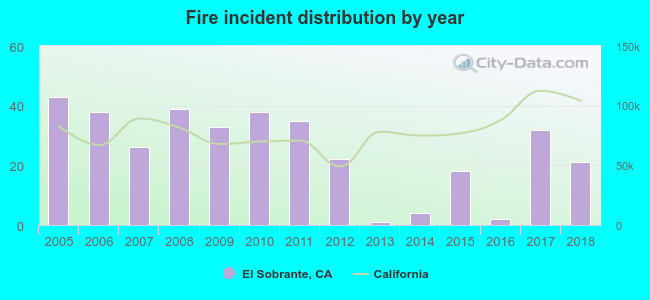 According to the data from the years 2005 - 2018 the average number of fires per year is 25. The highest number of reported fire incidents - 43 took place in 2005, and the least - 1 in 2013. The data has a declining trend.
The average number of yearly fire incidents per 10k residents in El Sobrante, CA compared to nearest cities:
(Note: Based on data for the last 3 years, including only cities with population 5,000 and above)
| El Sobrante: | 14.5 |
| Pinole: | 18.5 |
| San Pablo: | 41.0 |
| Richmond: | 41.0 |
| Hercules: | 13.4 |
| El Cerrito: | 25.2 |
| Briones: | 1.5 |
| Kensington: | 11.2 |
| Rodeo: | 49.2 |
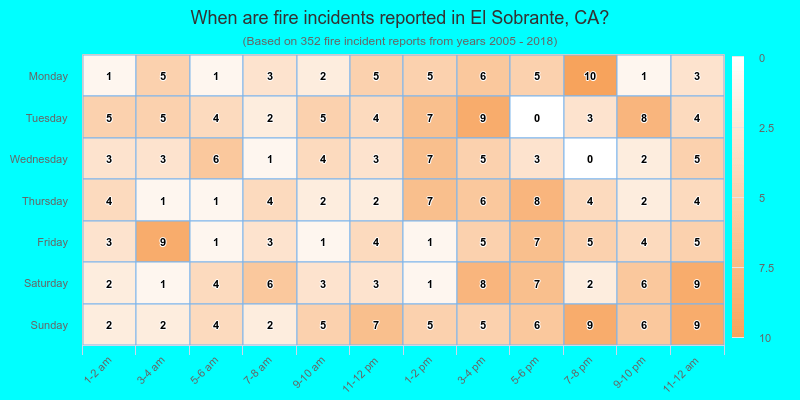
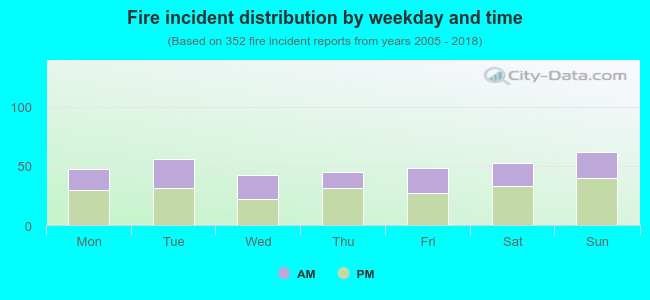 39.2% incidents where reported in the morning and 60.8% in the evening. The most fires (17.6%) took place on Sunday, and the least (11.9%) on Wednesday.
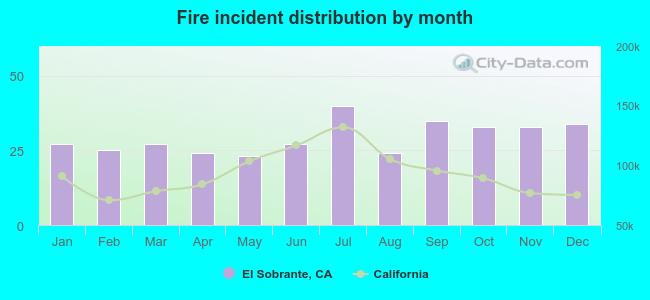 Based on the 352 reports from years 2005 - 2018 most fires (11.4%) took place during July, and the least (6.5%) in May.
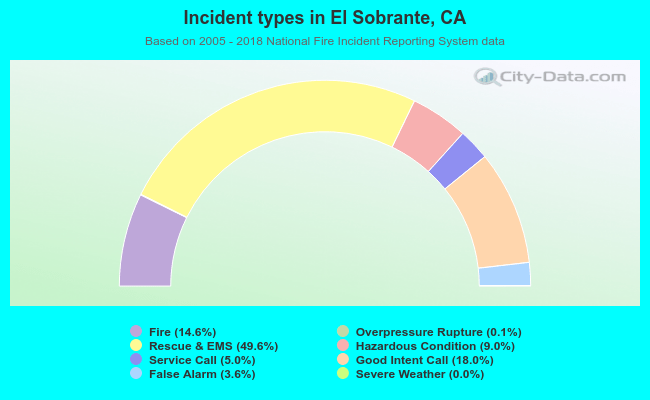 Out of all 2,404 cases reported during the years 2005 - 2018, the most belonged to the categories: Rescue & EMS (49.6%), Good Intent Call (18.0%), and Fire (14.6%).
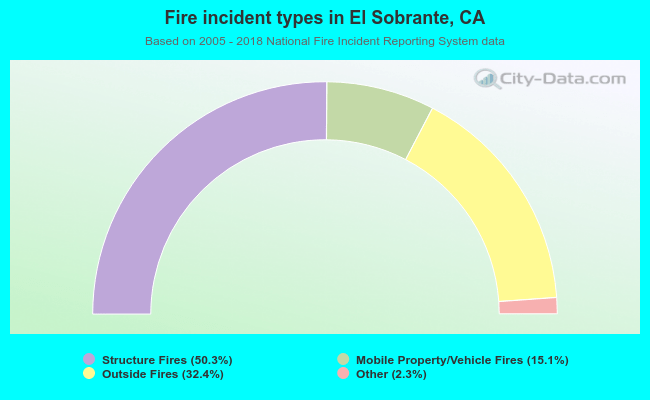 When looking into fire subcategories, the most incidents belonged to: Structure Fires (50.3%), and Outside Fires (32.4%).