San Pablo: Fire Incidents, California (CA)
Where are fire incidents reported in San Pablo, CA
Something went wrong! Please refresh the page.
| Fire incidents reported | |
|---|---|
| Sreet name | Count |
| SAN PABLO AVE | 186 |
| RUMRILL BLVD | 118 |
| SAN PABLO DAM RD | 116 |
| 23RD ST | 106 |
| BROOKSIDE DR | 90 |
| CHURCH LN | 86 |
| ROAD 20 | 80 |
| 11TH ST | 62 |
| GIANT RD | 60 |
| EL PORTAL DR | 56 |
| MARKET AVE | 48 |
| 21ST ST | 44 |
| SAN PABLO AV | 44 |
| 18TH ST | 38 |
| 15TH ST | 36 |
| MISSION BELL DR | 36 |
| RUMRILL BL | 36 |
| CRESTWOOD DR | 34 |
| STANTON AVE | 34 |
| CONTRA COSTA AVE | 32 |
| 19TH ST | 30 |
| 20TH ST | 30 |
| AMADOR ST | 30 |
| 16TH ST | 28 |
| CHRISTINE DR | 28 |
| 17TH ST | 26 |
| SANFORD AVE | 26 |
| BROADWAY AVE | 24 |
| DEL CAMINO DR | 24 |
| FILLMORE ST | 24 |
2002 - 2018 National Fire Incident Reporting System (NFIRS) incidents
- Incident types reported to NFIRS in San Pablo, CA
- 4,80051.5%Rescue & EMS
- 1,94120.8%Good Intent Call
- 1,54016.5%Fire
- 5035.4%Hazardous Condition
- 3223.5%False Alarm
- 2182.3%Service Call
- Fire incident types reported to NFIRS in San Pablo, CA
- 63441.2%Outside Fires
- 61539.9%Structure Fires
- 22714.7%Mobile Property/Vehicle Fires
- 644.2%Other
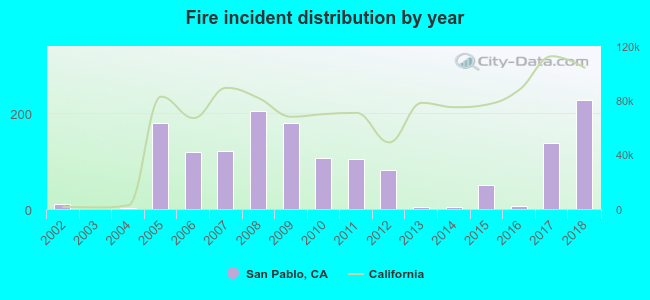 Based on the data from the years 2002 - 2018 the average number of fire incidents per year is 91. The highest number of fire incidents - 227 took place in 2018, and the least - 0 in 2003. The data has a growing trend.
The average number of yearly fire incidents per 10k residents in San Pablo, CA compared to nearest cities:
(Note: Based on data for the last 3 years, including only cities with population 5,000 and above)
| San Pablo: | 41.0 |
| Richmond: | 41.0 |
| El Sobrante: | 14.5 |
| El Cerrito: | 25.2 |
| Pinole: | 18.5 |
| Kensington: | 11.2 |
| Albany: | 19.3 |
| Hercules: | 13.4 |
| Rodeo: | 49.2 |
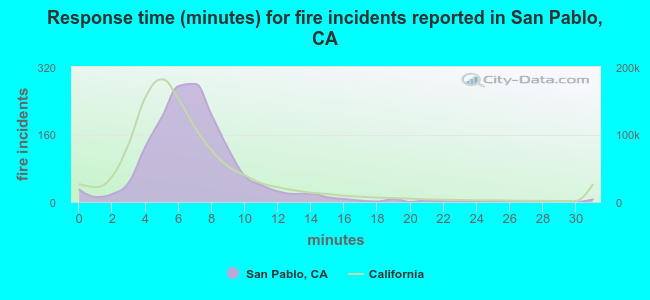 The median response time based on all reported fire incidents is 7 minutes. This is similar to the state median value.
The median response time in San Pablo, CA compared to nearest cities:
(Note: Based on data for all years, including only cities with at least 500 fire incidents)
| San Pablo: | 7 minutes |
| Richmond: | 7 minutes |
| El Cerrito: | 6 minutes |
| Albany: | 4 minutes |
| Hercules: | 6 minutes |
| Rodeo: | 6 minutes |
| Berkeley: | 5 minutes |
| San Rafael: | 5 minutes |
| Sausalito: | 6 minutes |
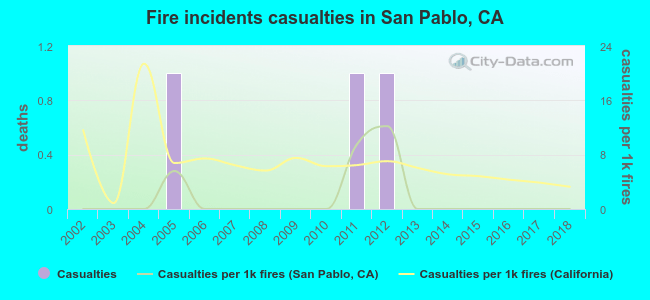 According to the data from the years 2002 - 2018 the average number of fire-related casualties per year is 0. The highest number of injuries - 1 took place in 2005, and the lowest - 0 in 2002. The data has a constant trend.
The average number of injuries per 1,000 fire incidents is 2. This indicator was the highest - 12 in 2012, and the lowest 0 in 2002. The trend for injuries per 1,000 fires is constant. Compared to the California value the number of injuries per 1,000 fire incidents is much lower.
According to the data from the years 2002 - 2018 the average number of fire-related casualties per year is 0. The highest number of injuries - 1 took place in 2005, and the lowest - 0 in 2002. The data has a constant trend.
The average number of injuries per 1,000 fire incidents is 2. This indicator was the highest - 12 in 2012, and the lowest 0 in 2002. The trend for injuries per 1,000 fires is constant. Compared to the California value the number of injuries per 1,000 fire incidents is much lower.Casualties per 1,000 incidents in San Pablo, CA compared to nearest cities:
(Note: Based on data for all years, including only cities with at least 500 fire incidents)
| San Pablo: | 1.9 |
| Richmond: | 4.0 |
| El Cerrito: | 1.3 |
| Albany: | 1.6 |
| Hercules: | 4.9 |
| Rodeo: | 1.4 |
| Berkeley: | 7.1 |
| San Rafael: | 3.1 |
| Sausalito: | 5.5 |
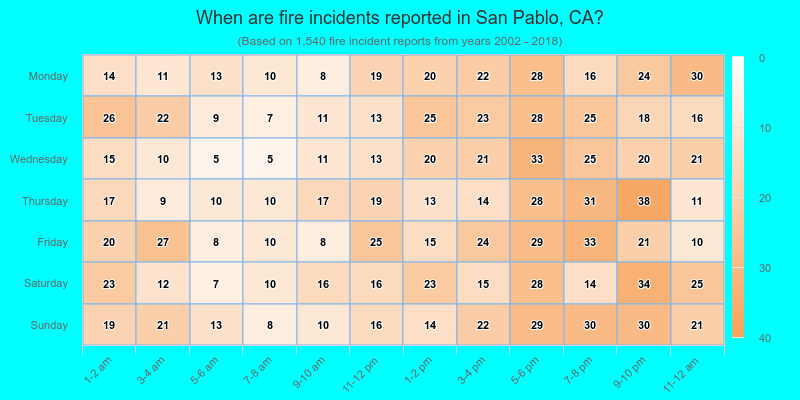
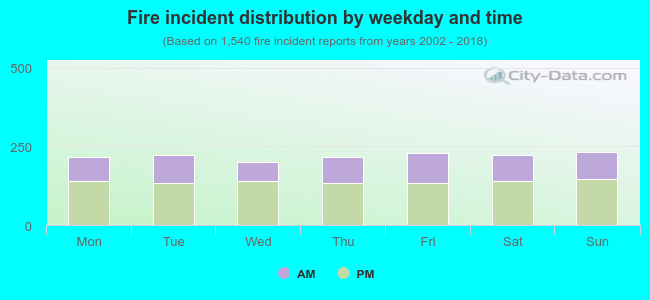 37.2% incidents where reported in the morning and 62.8% in the evening. The most fires (15.1%) took place on Sunday, and the least (12.9%) on Wednesday.
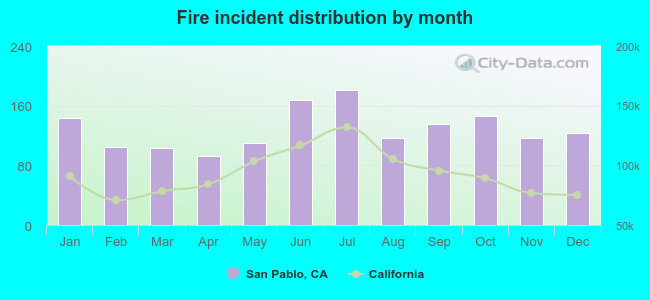 Based on the 1,540 fire incidents from years 2002 - 2018 most fires (11.8%) took place during July, and the least (6.0%) in April.
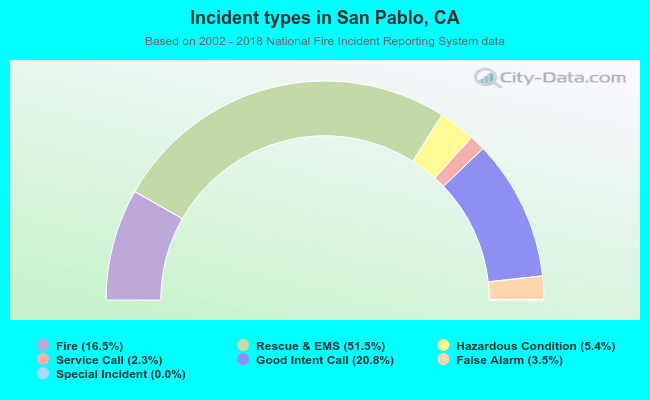 Out of all 9,328 cases reported during the years 2002 - 2018, the most belonged to the categories: Overpressure Rupture (51.5%), Service Call (20.8%), and Fire (16.5%).
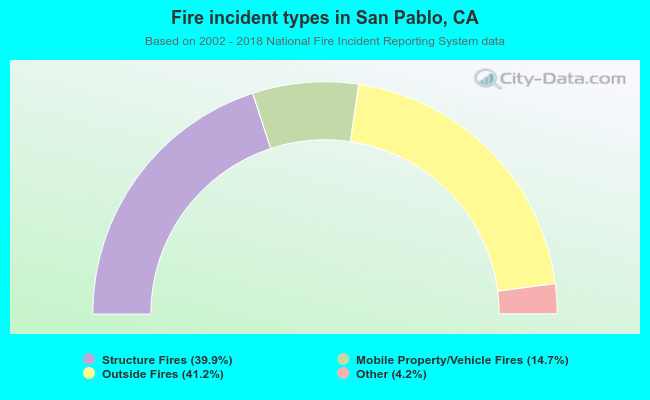 When looking into fire subcategories, the most incidents belonged to: Outside Fires (41.2%), and Structure Fires (39.9%).