Berkeley: Fire Incidents, California (CA)
Where are fire incidents reported in Berkeley, CA
Something went wrong! Please refresh the page.
| Fire incidents reported | |
|---|---|
| Sreet name | Count |
| SHATTUCK AVE | 146 |
| UNIVERSITY AVE | 132 |
| SHATTUCK AV | 90 |
| HASTE ST | 84 |
| ADELINE ST | 82 |
| GILMAN ST | 78 |
| SAN PABLO AV | 76 |
| SACRAMENTO ST | 66 |
| ADDISON ST | 64 |
| UNIVERSITY AV | 64 |
| BLAKE ST | 62 |
| TELEGRAPH AVE | 62 |
| MILVIA ST | 58 |
| DURANT AVE | 56 |
| DWIGHT WY | 56 |
| M L KING JR WAY | 56 |
| DWIGHT WAY | 54 |
| RUSSELL ST | 54 |
| ASHBY AV | 52 |
| HEARST AVE | 52 |
| VIRGINIA ST | 50 |
| PARKER ST | 48 |
| SAN PABLO AVE | 44 |
| ALCATRAZ AVE | 38 |
| ASHBY AVE | 38 |
| BANCROFT WAY | 38 |
| BANCROFT WY | 38 |
| CARLETON ST | 38 |
| CEDAR ST | 38 |
| CHANNING WAY | 38 |
| Other | 687 |
2005 - 2018 National Fire Incident Reporting System (NFIRS) incidents
- Incident types reported to NFIRS in Berkeley, CA
- 32,51461.4%Rescue & EMS
- 6,83212.9%False Alarm
- 4,0607.7%Good Intent Call
- 3,4296.5%Hazardous Condition
- 3,3206.3%Service Call
- 2,5394.8%Fire
- 1780.3%Special Incident
- Fire incident types reported to NFIRS in Berkeley, CA
- 1,09042.9%Outside Fires
- 92336.4%Structure Fires
- 32512.8%Mobile Property/Vehicle Fires
- 2017.9%Other
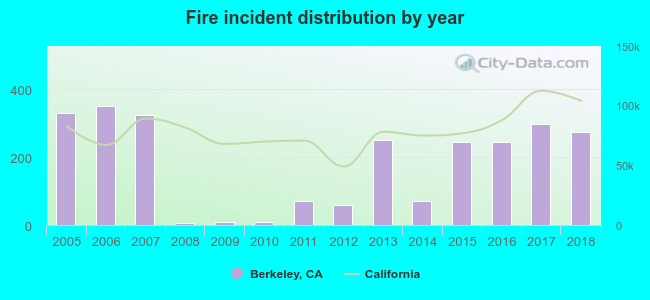 Based on the data from the years 2005 - 2018 the average number of fires per year is 181. The highest number of reported fire incidents - 351 took place in 2006, and the least - 6 in 2008. The data has a dropping trend.
The average number of yearly fire incidents per 10k residents in Berkeley, CA compared to nearest cities:
(Note: Based on data for the last 3 years, including only cities with population 5,000 and above)
| Berkeley: | 22.9 |
| Albany: | 19.3 |
| Kensington: | 11.2 |
| Emeryville: | 46.3 |
| El Cerrito: | 25.2 |
| Piedmont: | 10.7 |
| Orinda: | 26.1 |
| Richmond: | 41.0 |
| Oakland: | 37.6 |
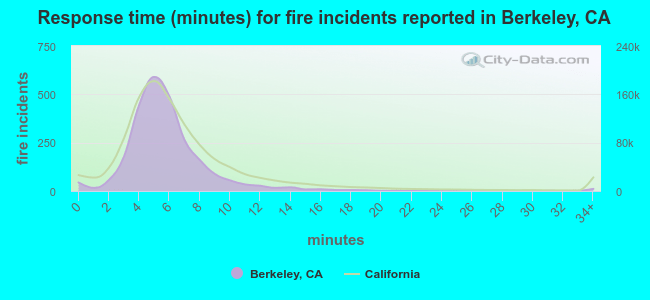 The median response time based on all reported fire incidents is 5 minutes. This is lower than the California median value.
The median response time in Berkeley, CA compared to nearest cities:
(Note: Based on data for all years, including only cities with at least 500 fire incidents)
| Berkeley: | 5 minutes |
| Albany: | 4 minutes |
| El Cerrito: | 6 minutes |
| Richmond: | 7 minutes |
| Oakland: | 5 minutes |
| San Pablo: | 7 minutes |
| Alameda: | 4 minutes |
| Lafayette: | 7 minutes |
| Hercules: | 6 minutes |
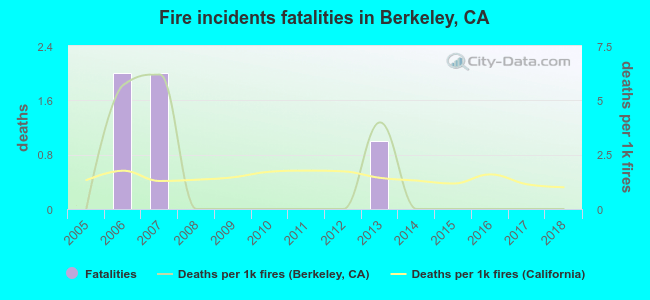 Based on the reports from the years 2005 - 2018 the average number of fire-related fatalities per year is 0. The highest number of reported deaths - 2 took place in 2006, and the lowest - 0 in 2005. The data has a constant trend.
The average number of fatalities per 1,000 fire incidents is 1. This indicator was the highest - 6 in 2007, and the lowest 0 in 2005. The trend for deaths per 1,000 fires is constant. Compared to the state value the number of fatalities per 1,000 incidents is higher.
Based on the reports from the years 2005 - 2018 the average number of fire-related fatalities per year is 0. The highest number of reported deaths - 2 took place in 2006, and the lowest - 0 in 2005. The data has a constant trend.
The average number of fatalities per 1,000 fire incidents is 1. This indicator was the highest - 6 in 2007, and the lowest 0 in 2005. The trend for deaths per 1,000 fires is constant. Compared to the state value the number of fatalities per 1,000 incidents is higher.Deaths per 1,000 incidents in Berkeley, CA compared to nearest cities:
(Note: Based on data for all years, including only cities with at least 2,500 fire incidents)
| Berkeley: | 2.0 |
| Richmond: | 1.9 |
| Oakland: | 4.7 |
| San Francisco: | 1.3 |
| San Leandro: | 2.4 |
| Concord: | 1.2 |
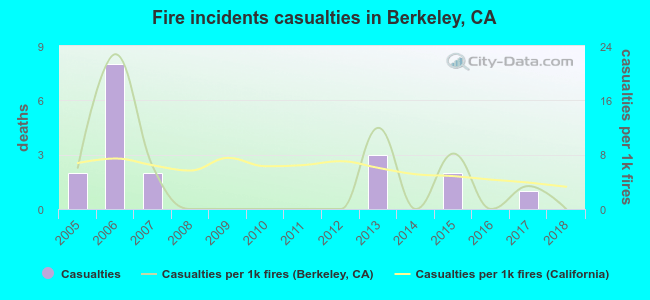 According to the data from the years 2005 - 2018 the average number of fire-related yearly casualties is 1. The highest number of reported injuries - 8 took place in 2006, and the lowest - 0 in 2008. The data has a decreasing trend.
The average number of casualties per 1,000 fire incidents is 4. This indicator was the highest - 23 in 2006, and the lowest 0 in 2008. The trend for casualties per 1,000 fires is dropping. Compared to the state value the number of injuries per 1,000 fires is higher.
According to the data from the years 2005 - 2018 the average number of fire-related yearly casualties is 1. The highest number of reported injuries - 8 took place in 2006, and the lowest - 0 in 2008. The data has a decreasing trend.
The average number of casualties per 1,000 fire incidents is 4. This indicator was the highest - 23 in 2006, and the lowest 0 in 2008. The trend for casualties per 1,000 fires is dropping. Compared to the state value the number of injuries per 1,000 fires is higher.
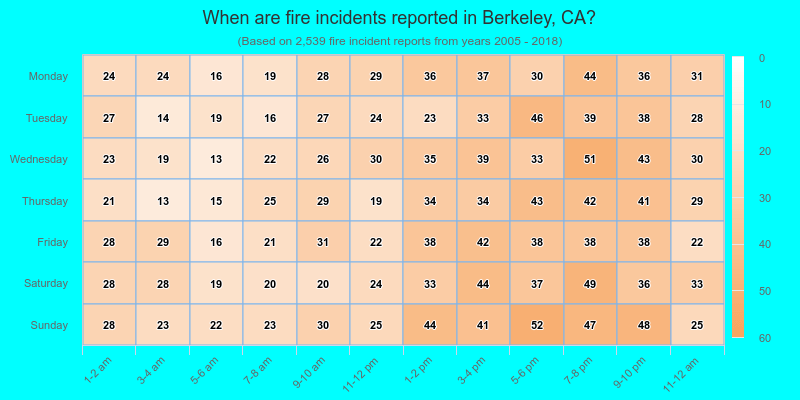
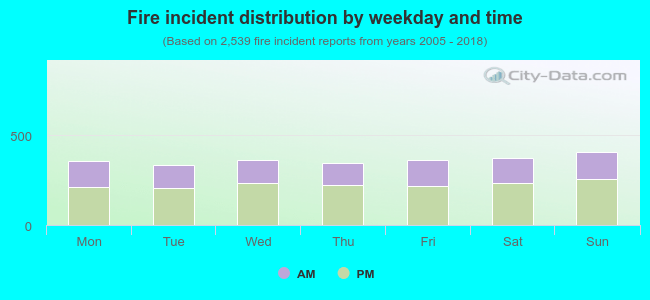 37.8% incidents where reported in the morning and 62.2% in the evening. The most fires (16.1%) took place on Sunday, and the least (13.2%) on Tuesday.
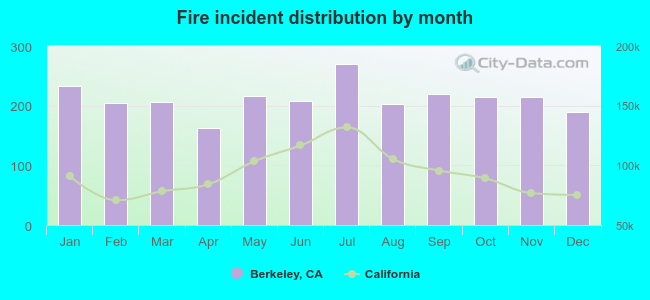 According to the 2,539 fire incident reports from years 2005 - 2018 most fires (10.6%) took place during July, and the least (6.4%) in April.
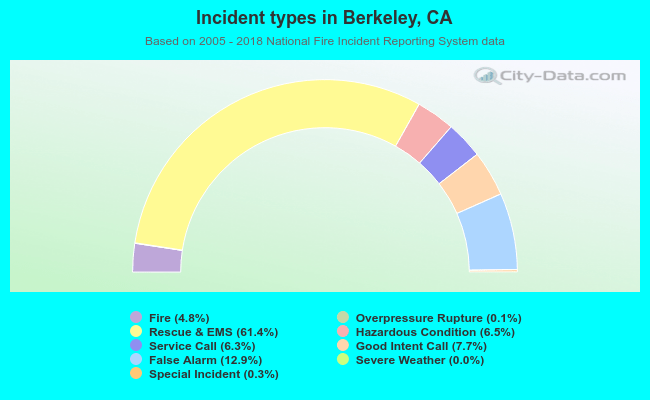 Out of all 52,923 cases reported during the years 2005 - 2018, the most belonged to the categories: Rescue & EMS (61.4%), False Alarm (12.9%), and Good Intent Call (7.7%).
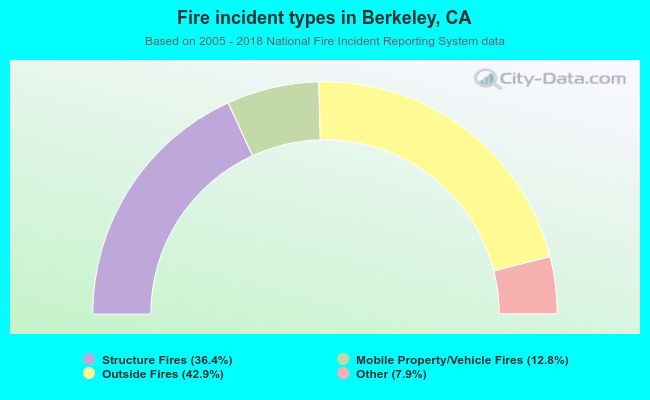 When looking into fire subcategories, the most reports belonged to: Outside Fires (42.9%), and Structure Fires (36.4%).