Teaneck: Fire Incidents, New Jersey (NJ)
Where are fire incidents reported in Teaneck, NJ
Something went wrong! Please refresh the page.
| Fire incidents reported | |
|---|---|
| Sreet name | Count |
| TEANECK RD | 420 |
| CEDAR LANE | 242 |
| QUEEN ANNE RD | 188 |
| GLENWOOD AVE | 164 |
| ENGLEWOOD AVE | 146 |
| OGDEN AVE | 126 |
| PALISADE AVE | 120 |
| RIVER RD | 120 |
| RUTLAND AVE | 114 |
| FOREST AVE | 104 |
| MAITLAND AVE | 98 |
| MAPLE ST | 82 |
| CHURCHILL RD | 80 |
| POMANDER WALK | 72 |
| SUSSEX RD | 70 |
| WINTHROP RD | 70 |
| FAYETTE ST | 52 |
| AYERS CT | 50 |
| WARWICK AVE | 50 |
| NORTHUMBERLAND RD | 48 |
| DOWNING ST | 46 |
| LINDEN AVE | 46 |
| TRAFALGAR ST | 46 |
| CARLTON TER | 44 |
| STATE ST | 44 |
| CEDAR | 42 |
| DEGRAW AVE | 42 |
| DELAVAN ST | 42 |
| EASTLAWN DR | 42 |
| FORT LEE RD | 42 |
| Other | 581 |
2004 - 2018 National Fire Incident Reporting System (NFIRS) incidents
- Incident types reported to NFIRS in Teaneck, NJ
- 5,74428.8%Hazardous Condition
- 4,23621.3%Service Call
- 3,43317.2%Fire
- 2,86914.4%False Alarm
- 1,8889.5%Rescue & EMS
- 1,6598.3%Good Intent Call
- 640.3%Overpressure Rupture
- 270.1%Special Incident
- Fire incident types reported to NFIRS in Teaneck, NJ
- 2,79081.3%Structure Fires
- 37310.9%Outside Fires
- 2697.8%Mobile Property/Vehicle Fires
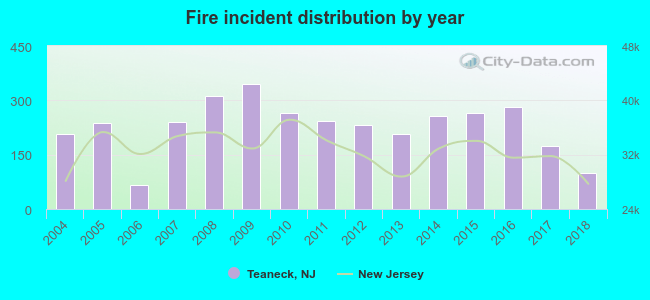 According to the data from the years 2004 - 2018 the average number of fire incidents per year is 229. The highest number of fire incidents - 344 took place in 2009, and the least - 65 in 2006. The data has a dropping trend.
The average number of yearly fire incidents per 10k residents in Teaneck, NJ compared to nearest cities:
(Note: Based on data for the last 3 years, including only cities with population 5,000 and above)
| Teaneck: | 47.0 |
| Bogota: | 35.6 |
| Englewood: | 88.8 |
| Hackensack: | 48.9 |
| Leonia: | 53.6 |
| Bergenfield: | 27.6 |
| Ridgefield Park: | 30.3 |
| Maywood: | 5.8 |
| River Edge: | 15.3 |
 The median response time based on all reported fire incidents is 3 minutes. This is lower compared to the New Jersey median value.
The median response time in Teaneck, NJ compared to nearest cities:
(Note: Based on data for all years, including only cities with at least 500 fire incidents)
| Teaneck: | 3 minutes |
| Englewood: | 4 minutes |
| Hackensack: | 3 minutes |
| Leonia: | 3 minutes |
| Bergenfield: | 3 minutes |
| Palisades Park: | 2 minutes |
| Fort Lee: | 4 minutes |
| Lodi: | 4 minutes |
| Ridgefield: | 3 minutes |
 Based on the reports from the years 2004 - 2018 the average number of fire-related fatalities per year is 1. The highest number of reported deaths - 7 took place in 2005, and the lowest - 0 in 2004. The data has a rising trend.
The average number of fatalities per 1,000 fires is 4. This indicator was the highest - 30 in 2005, and the lowest 0 in 2004. The trend for fatalities per 1,000 fire incidents is increasing. Compared to the New Jersey value the number of fatalities per 1,000 fire incidents is much higher.
Based on the reports from the years 2004 - 2018 the average number of fire-related fatalities per year is 1. The highest number of reported deaths - 7 took place in 2005, and the lowest - 0 in 2004. The data has a rising trend.
The average number of fatalities per 1,000 fires is 4. This indicator was the highest - 30 in 2005, and the lowest 0 in 2004. The trend for fatalities per 1,000 fire incidents is increasing. Compared to the New Jersey value the number of fatalities per 1,000 fire incidents is much higher.Deaths per 1,000 incidents in Teaneck, NJ compared to nearest cities:
(Note: Based on data for all years, including only cities with at least 2,500 fire incidents)
| Teaneck: | 3.5 |
| Englewood: | 1.1 |
| Passaic: | 0.3 |
| Paterson: | 2.1 |
| Union City: | 2.6 |
| Hoboken: | 0.7 |
 According to the reports from the years 2004 - 2018 the average number of fire-related casualties per year is 3. The highest number of reported casualties - 8 took place in 2004, and the lowest - 0 in 2007. The data has a dropping trend.
The average number of injuries per 1,000 fires is 11. This indicator was the highest - 39 in 2004, and the lowest 0 in 2007. The trend for injuries per 1,000 fires is decreasing. Compared to the state value the number of casualties per 1,000 fires is higher.
According to the reports from the years 2004 - 2018 the average number of fire-related casualties per year is 3. The highest number of reported casualties - 8 took place in 2004, and the lowest - 0 in 2007. The data has a dropping trend.
The average number of injuries per 1,000 fires is 11. This indicator was the highest - 39 in 2004, and the lowest 0 in 2007. The trend for injuries per 1,000 fires is decreasing. Compared to the state value the number of casualties per 1,000 fires is higher.Casualties per 1,000 incidents in Teaneck, NJ compared to nearest cities:
(Note: Based on data for all years, including only cities with at least 500 fire incidents)
| Teaneck: | 11.1 |
| Englewood: | 6.3 |
| Hackensack: | 13.1 |
| Leonia: | 1.4 |
| Bergenfield: | 18.9 |
| Palisades Park: | 7.4 |
| Fort Lee: | 18.4 |
| Lodi: | 6.3 |
| Ridgefield: | 7.6 |
 26.8% incidents where reported in the morning and 73.2% in the evening. The most fires (16.9%) took place on Friday, and the least (10.4%) on Saturday.
 Based on the 3,433 fire incidents from years 2004 - 2018 most fires (10.2%) took place during April, and the least (6.7%) in July.
 Out of all 19,926 cases reported during the years 2004 - 2018, the most belonged to the categories: Hazardous Condition (28.8%), Service Call (21.3%), and Fire (17.2%).
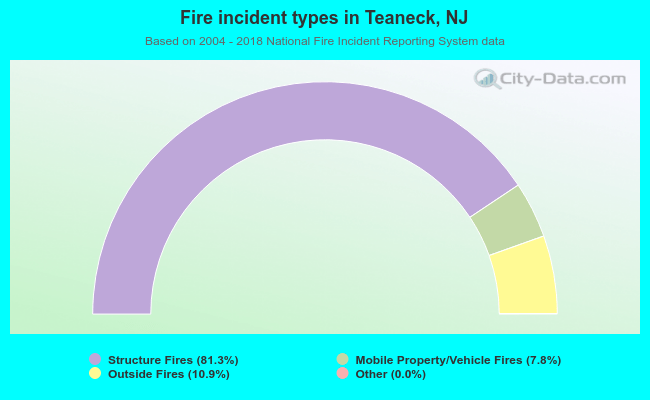 When looking into fire subcategories, the most incidents belonged to: Structure Fires (81.3%), and Outside Fires (10.9%).