Maywood: Fire Incidents, New Jersey (NJ)
Where are fire incidents reported in Maywood, NJ
Something went wrong! Please refresh the page.
|
| |||||||||||||||||||||||||||||||||||||||||||||||||||||||||||||||||||||||||||||||||||||||||||||||||||||||||||||
2003 - 2018 National Fire Incident Reporting System (NFIRS) incidents
- Incident types reported to NFIRS in Maywood, NJ
- 60649.8%Hazardous Condition
- 26822.0%Fire
- 18415.1%False Alarm
- 776.3%Service Call
- 544.4%Good Intent Call
- 231.9%Rescue & EMS
- 30.2%Overpressure Rupture
- Fire incident types reported to NFIRS in Maywood, NJ
- 16160.1%Structure Fires
- 4817.9%Outside Fires
- 3111.6%Mobile Property/Vehicle Fires
- 2810.4%Other
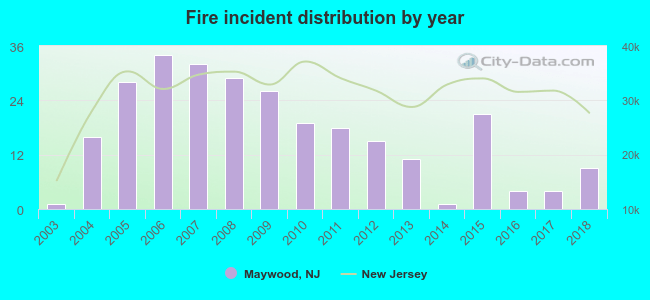 Based on the data from the years 2003 - 2018 the average number of fires per year is 17. The highest number of reported fire incidents - 34 took place in 2006, and the least - 1 in 2003. The data has an increasing trend.
The average number of yearly fire incidents per 10k residents in Maywood, NJ compared to nearest cities:
(Note: Based on data for the last 3 years, including only cities with population 5,000 and above)
| Maywood: | 5.8 |
| Rochelle Park: | 26.5 |
| Hackensack: | 48.9 |
| Saddle Brook: | 26.1 |
| River Edge: | 15.3 |
| Lodi: | 24.5 |
| Bogota: | 35.6 |
| Teaneck: | 47.0 |
| Paramus: | 4.6 |

 According to the reports from the years 2003 - 2018 the average number of fire-related yearly casualties is 1. The highest number of reported injuries - 6 took place in 2005, and the lowest - 0 in 2003. The data has a constant trend.
 23.9% incidents where reported in the morning and 76.1% in the evening. The most fires (19.8%) took place on Sunday, and the least (10.1%) on Friday.
 According to the 268 fire incident reports from years 2003 - 2018 most fires (11.6%) took place during September, and the least (5.2%) in June.
 Out of all 1,217 cases reported during the years 2003 - 2018, the most belonged to the categories: Hazardous Condition (49.8%), Fire (22.0%), and False Alarm (15.1%).
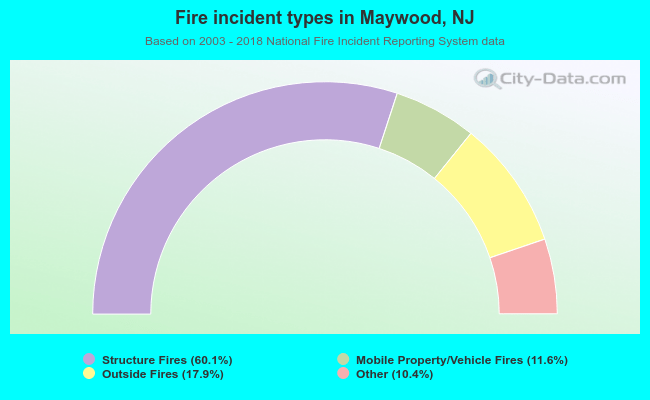 When looking into fire subcategories, the most reports belonged to: Structure Fires (60.1%), and Outside Fires (17.9%).