River Edge: Fire Incidents, New Jersey (NJ)
Where are fire incidents reported in River Edge, NJ
Something went wrong! Please refresh the page.
|
| |||||||||||||||||||||||||||||||||||||||||||||||||||||||||||||||||||||||||||||||||||||||||||||||||||||||||||||
2004 - 2018 National Fire Incident Reporting System (NFIRS) incidents
- Incident types reported to NFIRS in River Edge, NJ
- 66744.2%Hazardous Condition
- 34622.9%Fire
- 28819.1%False Alarm
- 1137.5%Service Call
- 664.4%Good Intent Call
- 151.0%Rescue & EMS
- 90.6%Overpressure Rupture
- 40.3%Severe Weather
- Fire incident types reported to NFIRS in River Edge, NJ
- 22865.9%Structure Fires
- 7722.3%Outside Fires
- 3710.7%Mobile Property/Vehicle Fires
- 41.2%Other
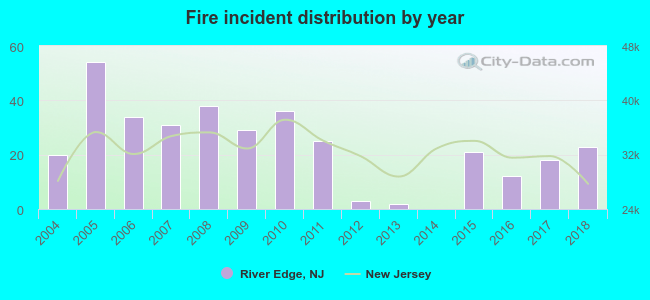 According to the data from the years 2004 - 2018 the average number of fires per year is 23. The highest number of reported fires - 54 took place in 2005, and the least - 0 in 2014. The data has an increasing trend.
The average number of yearly fire incidents per 10k residents in River Edge, NJ compared to nearest cities:
(Note: Based on data for the last 3 years, including only cities with population 5,000 and above)
| River Edge: | 15.3 |
| New Milford: | 8.2 |
| Oradell: | 32.7 |
| Bergenfield: | 27.6 |
| Maywood: | 5.8 |
| Paramus: | 4.6 |
| Rochelle Park: | 26.5 |
| Dumont: | 20.0 |
| Hackensack: | 48.9 |

 28.3% incidents where reported in the morning and 71.7% in the evening. The most fires (15.9%) took place on Friday, and the least (11.8%) on Tuesday.
 Based on the 346 fire incident reports from years 2004 - 2018 most fires (14.2%) took place during May, and the least (5.5%) in February.
 Out of all 1,508 cases reported during the years 2004 - 2018, the most belonged to the categories: Hazardous Condition (44.2%), Fire (22.9%), and False Alarm (19.1%).
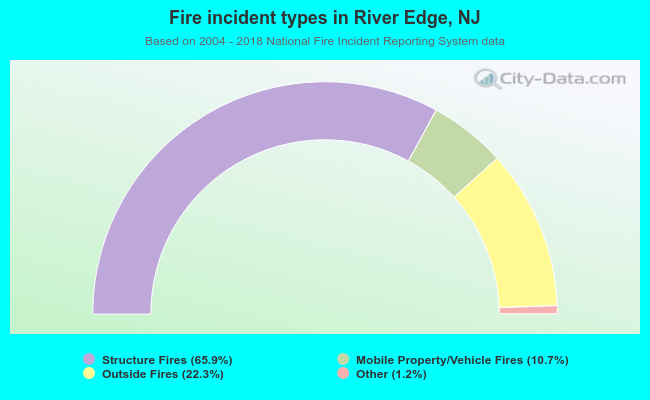 When looking into fire subcategories, the most reports belonged to: Structure Fires (65.9%), and Outside Fires (22.3%).