New Milford: Fire Incidents, New Jersey (NJ)
Where are fire incidents reported in New Milford, NJ
Something went wrong! Please refresh the page.
|
| |||||||||||||||||||||||||||||||||||||||||||||||||||||||||||||||||||||||||||||||||||||||||||||||||||||||||||||
2004 - 2018 National Fire Incident Reporting System (NFIRS) incidents
- Incident types reported to NFIRS in New Milford, NJ
- 1,12244.7%Hazardous Condition
- 55322.0%False Alarm
- 44417.7%Fire
- 1867.4%Good Intent Call
- 1556.2%Service Call
- 301.2%Rescue & EMS
- 180.7%Overpressure Rupture
- Fire incident types reported to NFIRS in New Milford, NJ
- 30869.4%Structure Fires
- 8418.9%Outside Fires
- 296.5%Other
- 235.2%Mobile Property/Vehicle Fires
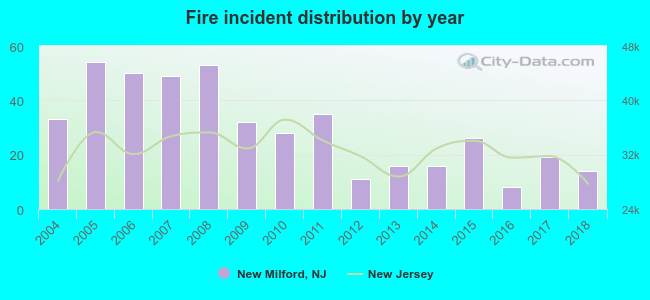 Based on the data from the years 2004 - 2018 the average number of fires per year is 30. The highest number of reported fires - 54 took place in 2005, and the least - 8 in 2016. The data has a decreasing trend.
The average number of yearly fire incidents per 10k residents in New Milford, NJ compared to nearest cities:
(Note: Based on data for the last 3 years, including only cities with population 5,000 and above)
| New Milford: | 8.2 |
| River Edge: | 15.3 |
| Bergenfield: | 27.6 |
| Oradell: | 32.7 |
| Dumont: | 20.0 |
| Emerson: | 24.5 |
| Paramus: | 4.6 |
| Cresskill: | 9.1 |
| Tenafly: | 11.0 |
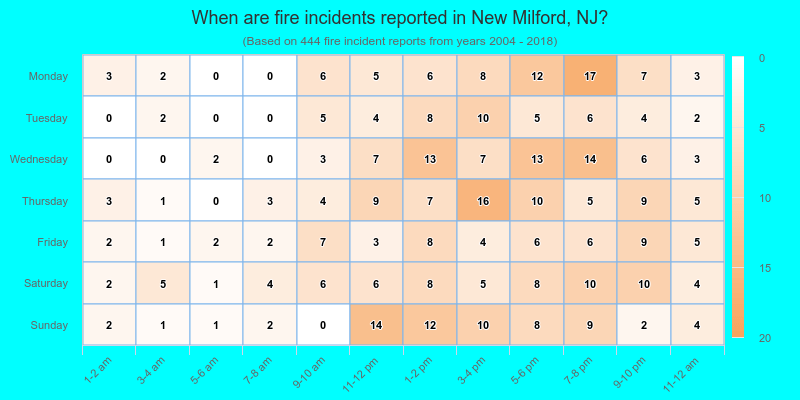
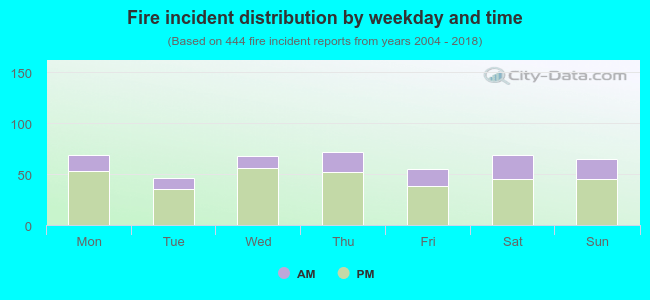 27.0% incidents where reported in the morning and 73.0% in the evening. The most fires (16.2%) took place on Thursday, and the least (10.4%) on Tuesday.
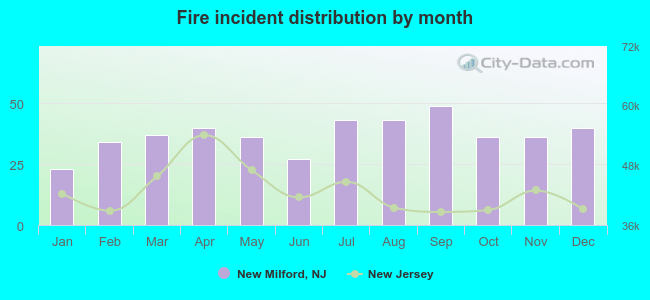 According to the 444 reports from years 2004 - 2018 most fires (11.0%) took place during September, and the least (5.2%) in January.
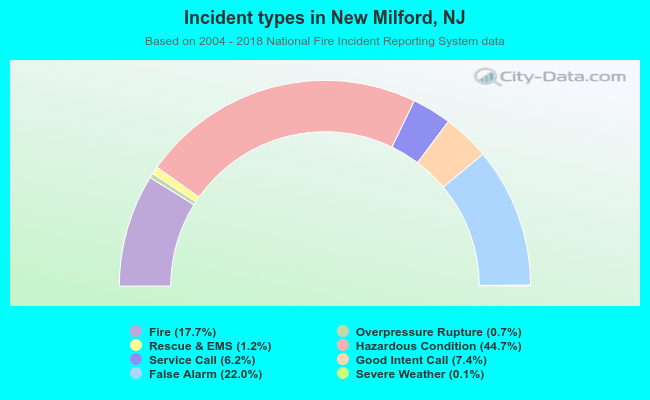 Out of all 2,510 cases reported during the years 2004 - 2018, the most belonged to the categories: Hazardous Condition (44.7%), False Alarm (22.0%), and Fire (17.7%).
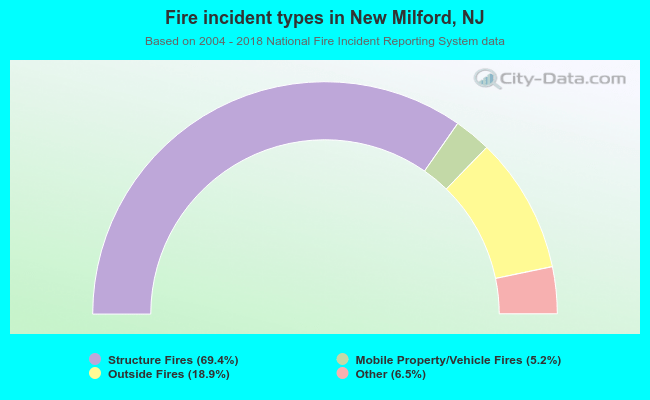 When looking into fire subcategories, the most incidents belonged to: Structure Fires (69.4%), and Outside Fires (18.9%).