Dumont: Fire Incidents, New Jersey (NJ)
Where are fire incidents reported in Dumont, NJ
Something went wrong! Please refresh the page.
|
| |||||||||||||||||||||||||||||||||||||||||||||||||||||||||||||||||||||||||||||||||||||||||||||||||||||||||||||
2005 - 2018 National Fire Incident Reporting System (NFIRS) incidents
- Incident types reported to NFIRS in Dumont, NJ
- 1,01339.5%Hazardous Condition
- 67326.3%False Alarm
- 43416.9%Fire
- 2379.2%Service Call
- 1355.3%Good Intent Call
- 502.0%Rescue & EMS
- 140.5%Severe Weather
- 70.3%Overpressure Rupture
- Fire incident types reported to NFIRS in Dumont, NJ
- 23754.6%Structure Fires
- 15134.8%Outside Fires
- 358.1%Mobile Property/Vehicle Fires
- 112.5%Other
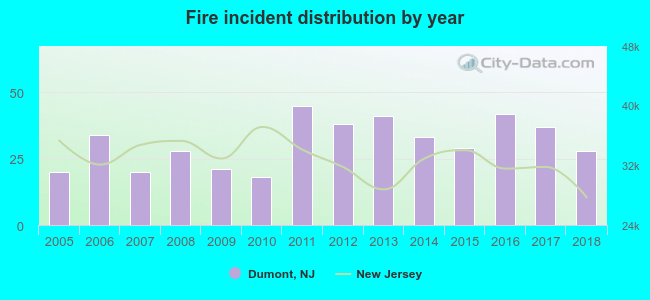 Based on the data from the years 2005 - 2018 the average number of fires per year is 31. The highest number of fires - 45 took place in 2011, and the least - 18 in 2010. The data has an increasing trend.
The average number of yearly fire incidents per 10k residents in Dumont, NJ compared to nearest cities:
(Note: Based on data for the last 3 years, including only cities with population 5,000 and above)
| Dumont: | 20.0 |
| New Milford: | 8.2 |
| Cresskill: | 9.1 |
| Bergenfield: | 27.6 |
| Oradell: | 32.7 |
| Tenafly: | 11.0 |
| Closter: | 14.0 |
| River Edge: | 15.3 |
| Emerson: | 24.5 |

 According to the reports from the years 2005 - 2018 the average number of fire-related casualties per year is 1. The highest number of casualties - 8 took place in 2011, and the lowest - 0 in 2007. The data has a dropping trend.
 27.9% incidents where reported in the morning and 72.1% in the evening. The most fires (16.6%) took place on Monday, and the least (10.8%) on Tuesday.
 Based on the 434 fires from years 2005 - 2018 most fires (11.8%) took place during October, and the least (4.4%) in November.
 Out of all 2,563 cases reported during the years 2005 - 2018, the most belonged to the categories: Hazardous Condition (39.5%), False Alarm (26.3%), and Fire (16.9%).
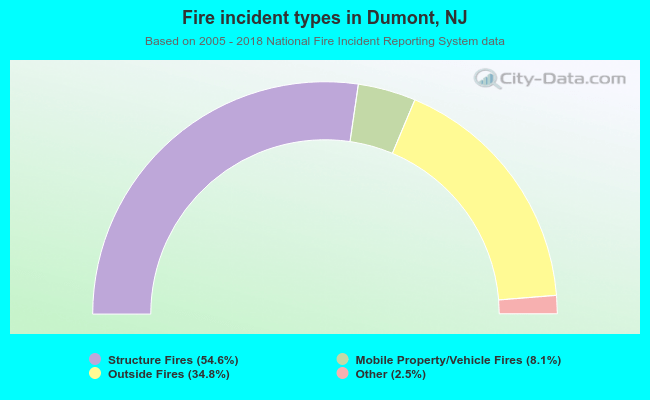 When looking into fire subcategories, the most reports belonged to: Structure Fires (54.6%), and Outside Fires (34.8%).