Saddle Brook: Fire Incidents, New Jersey (NJ)
Where are fire incidents reported in Saddle Brook, NJ
Something went wrong! Please refresh the page.
|
| |||||||||||||||||||||||||||||||||||||||||||||||||||||||||||||||||||||||||||||||||||||||||||||||||||||||||||||
2002 - 2018 National Fire Incident Reporting System (NFIRS) incidents
- Incident types reported to NFIRS in Saddle Brook, NJ
- 76834.3%False Alarm
- 69931.3%Hazardous Condition
- 47621.3%Fire
- 1396.2%Service Call
- 773.4%Rescue & EMS
- 703.1%Good Intent Call
- 30.1%Overpressure Rupture
- 30.1%Severe Weather
- Fire incident types reported to NFIRS in Saddle Brook, NJ
- 15933.4%Structure Fires
- 13227.7%Outside Fires
- 9920.8%Other
- 8618.1%Mobile Property/Vehicle Fires
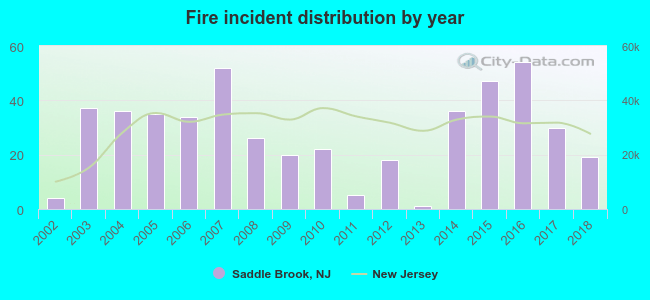 Based on the data from the years 2002 - 2018 the average number of fires per year is 28. The highest number of fire incidents - 54 took place in 2016, and the least - 1 in 2013. The data has a growing trend.
The average number of yearly fire incidents per 10k residents in Saddle Brook, NJ compared to nearest cities:
(Note: Based on data for the last 3 years, including only cities with population 5,000 and above)
| Saddle Brook: | 26.1 |
| Rochelle Park: | 26.5 |
| Elmwood Park: | 21.6 |
| Maywood: | 5.8 |
| Garfield: | 12.0 |
| Lodi: | 24.5 |
| Fair Lawn: | 22.2 |
| Hackensack: | 48.9 |
| Hasbrouck Heights: | 18.9 |

 Based on the data from the years 2002 - 2018 the average number of fire-related yearly casualties is 0. The highest number of casualties - 1 took place in 2003, and the lowest - 0 in 2002. The data has a constant trend.
 28.4% incidents where reported in the morning and 71.6% in the evening. The most fires (16.2%) took place on Monday, and the least (13.0%) on Friday.
 According to the 476 reports from years 2002 - 2018 most fires (14.3%) took place during April, and the least (6.1%) in December.
 Out of all 2,236 cases reported during the years 2002 - 2018, the most belonged to the categories: False Alarm (34.3%), Hazardous Condition (31.3%), and Fire (21.3%).
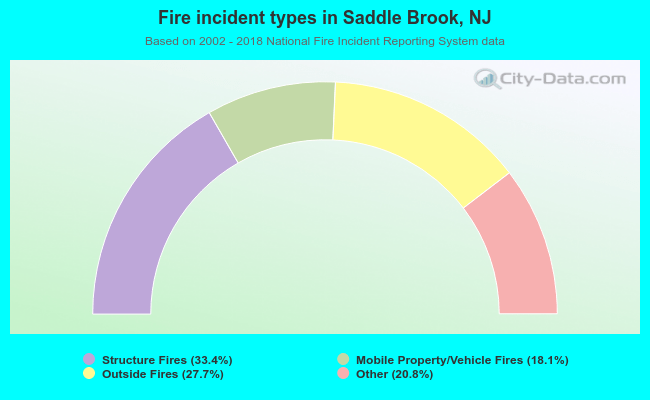 When looking into fire subcategories, the most reports belonged to: Structure Fires (33.4%), and Outside Fires (27.7%).